


Services on Demand
Journal
Article
 English (pdf)
 Article in xml format
 Article references
 Send this article by e-mail
Indicators
-
 Cited by SciELO
 -
 Access statistics
Related links
-
 Similars in
SciELO
Similars in
SciELO
Share

 Permalink
Atmósfera
Print version ISSN 0187-6236
Atmósfera vol.22 n.1 Ciudad de México Jan. 2009
Characterization of traffic–generated pollutants in Bucharest
G. RADUCAN and S. STEFAN
University of Bucharest, Faculty of Physics, Department of Atmospheric Physics,
P. O. Box MG–11, Magurele, Bucharest, Romania
Corresponding author: G. Raducan; e–mail: gabi_raducan@yahoo.com
Received October 21, 2007; accepted September 22, 2008
RESUMEN
La directiva 96/62/EC del Consejo de la Unión Europea sobre determinación y manejo de la calidad del aire ambiental establece que deben existir planes de acción para las zonas donde la concentración de contaminantes excede los valores límite. En las áreas urbanas dichos valores límite se rebasan en especial debido al tráfico. En este trabajo analizamos la variabilidad temporal de los niveles de concentración de NOX, O3 y SO2 en dos cañones urbanos. La distribución de las concentraciones demuestra que el tráfico es la fuente más importante de NOX, contaminante que se emite por la operación de los motores vehiculares. El nivel de contaminación en la calle U2 es 25% menor que el de la calle U1, aún cuando el tráfico cuantificado en la calle U2 es 50% menor que el de la U1. Esto se debe a que la geometría y la ubicación de las calles es diferente.
ABSTRACT
European Union Council directive 96/62/EC on ambient air quality assessment and management requires the development of action plans for zones where the concentrations of pollutants in ambient air exceed limit values. In the urban areas the limit values are exceeded, especially due to the traffic. In this paper, we analyzed the temporal variability levels of concentration of NOX, O3 and SO2 in two street canyons. The distribution of concentrations proves that traffic is the most important source of NOX, this pollutant being emitted during running of the vehicle engines. The level of pollution within U2 street is 25% less than U1 street, even though the measured traffic within U2 street is 50% less than within U1 street. This happen because the streets geometry and locations are different.
Keywords: Pollutant concentrations, traffic, urban, meteorological conditions.
1. Introduction
In urban areas, where the population is very numerous and the traffic is relatively high, the exposure of people to the concentrations related traffic is significant (Morris et al., 1995; Fenger, 1999).
Pollutant levels depend on traffic as well as on meteorological and topographic conditions that influence pollutant dispersion or accumulation, in the studied area. For example, the background winds perpendicular to the street axis create a vortex in the street, which rallies the pollutants, increasing the pollutants levels upwind and decreasing the pollutants levels downwind (Louka et al., 2000).
For reducing the pollutants emissions in the atmosphere, it is necessary to permanently monitor the air quality, which means high costs. Dispersion models are not so expensive to establish the air quality, but they can be used only when both meteorological conditions and topography data are available. In addition, emission sources have to be known.
Main goal of our research study was to assess both the causes and the factors enhancing the pollution in an urban area. We have evaluated the concentration levels of NOX, SO2 and O3 in street canyons in two crossing sites in Bucharest area. The chosen streets are similar with most of the streets in the Bucharest center, considering the mean height of buildings along the street, the general street topography and pollutant concentrations. Therefore, results of this study can be applied to other streets. The characteristics of the sites and the traffic data used are presented in Section 2. The results of the correlation between traffic and pollutant concentrations are shown in Section 3. Here we also introduced a normalized and non–dimensional parameter K to characterize the air quality in this urban area. This parameter is more accessible for local authorities in the decisional acts related to urban air quality. In the final section of the paper, some conclusions are presented.
2. The streets and the traffic data
2.1 Characteristics of the sites
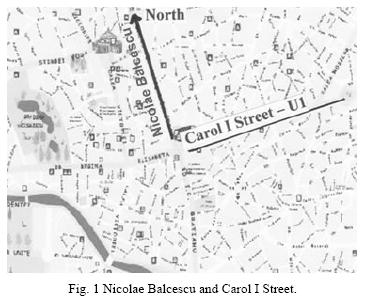
The field study was conducted for a year in two junctions which can be considered hot spots, continued with two streets, in this paper U1 (Carol I Street), located to 90° from North (Fig. 1) and U2 (Dacia Avenue) located to 135° from North (Fig. 2), in the city of Bucharest, Romania. The first junction is wider than the second, but the street canyon U1 is shorter than U2 and the buildings surrounding the street are of equal height. U2 is a street canyon with buildings of different heights and different roof geometry. Consequently, the aspect ratio H/W of the streets is different (H is the average height of the canyon walls and W is the canyon width) (Berkowicz et al., 2002). The measurements of pollutant concentrations were made in 2002 year.

2.2 Traffic measurements
Traffic measurements have been done using the devices from a mobile laboratory belonging to Romanian Auto Register (RAR). For both areas chosen, we measured the traffic flow (number of vehicle/hour) and concentration of pollutants like NO2, O3 and SO2. The instruments used are an automatic machine Horiba, which records the pollutants concentrations near the breathing level (situated at 1.5 m height related to ground) (Tripathi et al., 2004) and a Vaisala weather station, which records the meteorological parameters (temperature, humidity, solar radiation, wind speed and wind direction).
Wind flow and pollutant dispersion within continuous street canyons essentially depend on the aspect ratio, the street length and building roof geometry (Theurer, 1999).
In Figure 3, it is shown the traffic flow in junction and crossing U1 for each day of the week.

The graph shows higher traffic in weekdays, and decrease by 50% in weekends when people leave urban areas. Figure 3 points out the morning peak, around nine o'clock and the afternoon peak during weekdays.
The traffic flow is different for the selected streets (Fig. 4). In U2 street canyon, the measured number of vehicles is 50% smaller than in U1. The daily trend of the traffic in both streets is similar. In both streets the decreasing trend of traffic is also observed during the weekend.

3. Results and discussions
3.1 Air pollutants and traffic
Air pollution from traffic is a complex mixture of many chemicals, but nitrogen oxides (NOX) proved to be a good indicator of traffic pollution in urban areas (Briggs, 1997; Nieuwenhuijsen, 2004).The primary emission from traffic is mostly nitric oxide (NO), which is transformed to NO2 by atmospheric photochemical reactions, influenced by ozone concentrations.
The correlation between traffic flow–U1 and traffic flow–U2, represented in Figure 5 is relatively good, but it was influenced by traffic congestions. Hourly average concentration data (O3 and NO), measured for weekdays and weekend in U1 street are plotted in Figure 6. The variability of traffic and the NO concentration is similar, emphasizing that the traffic is the most important source of NO. The O3 concentration values are small when the NO concentration values are large due to the processes of NO2 generation (Fig. 6).


Hourly averages concentration data (NOX and SO2), measured for weekdays and weekend in U1 street are plotted in Figure 7. The graphs show the temporal variability of the pollutants levels. Therefore, we can see very high levels recorded for NOX (up to 1500 µg/m3), while for SO2 the values are below 30 µg/m3.

Figures 8 (U1) and 9 (U2) show a very good correlation between traffic flow and nitrogen oxides (NO and NO2) concentrations in the street. Such distribution of concentrations proves that traffic is the most important source of NOX, this pollutant being emitted by the vehicle engines during their running.
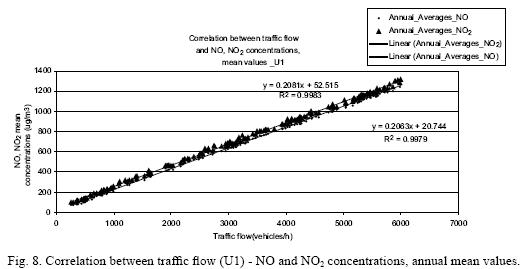

The different shapes of the graphs for the U1 and U2 streets (Figs. 8 and 9) is due to the influence of the traffic flow and the topographic characteristics on the NO and NO2 concentrations in the street.
Figure 10 (U1 street) shows anti–correlation between traffic flow and O3. This is because the traffic determines NO emissions and NO uses ozone in the photochemical processes.

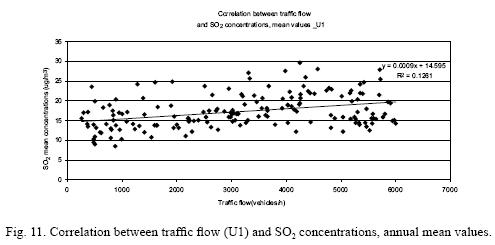
The correlation between traffic flow and SO2 concentrations was plotted in Figure 11. The weak correlation proves that traffic is not a source of this pollutant and the streets are not next to an industrial area.
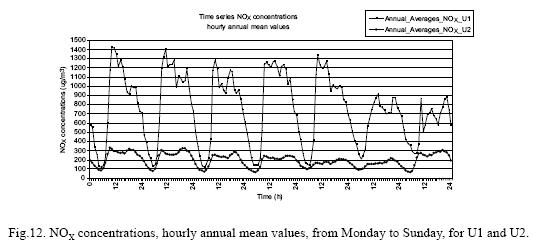
The graphs presented in Figure 12 show that the level of pollution within U2 street is 25% less than within U1 street, even though the traffic within U2 street is 50% less than within U1 street (Fig. 4). The streets geometry and locations are different and they have a great influence on the pollution level.
3.2 The wind influence
Direction and intensity of the wind significantly influence the state of the atmosphere in urban areas, especially in canyon streets and consequently dispersion of pollutants (Kim and Baik, 2004).
To analyze the influence of the wind on the behaviour of pollutants in the street canyons, we have selected a short period with higher pollutant concentration, January 19–25 (Fig. 13).

Generally, the behaviour of the concentration values is known: when the wind speed is higher, the dispersion, due to increased turbulence, is more active and the pollutants dilution is better, resulting in low levels of pollution (Kim and Baik, 2004); when the wind speed is lower, elevated levels of pollutants are measured.
Wind rose shows that the wind blows especially in sector 60° to 90° and the higher wind speed was recorded from 60° (Fig. 14). The direction of U1 street canyon is similar with the dominant wind direction for this period and NO2 concentration values are smaller than those for U2 street, however the traffic is less in U2 street (Fig. 4, selected area). It means that the wind enhances the turbulence and consequently the pollutant dispersion within U1 street.

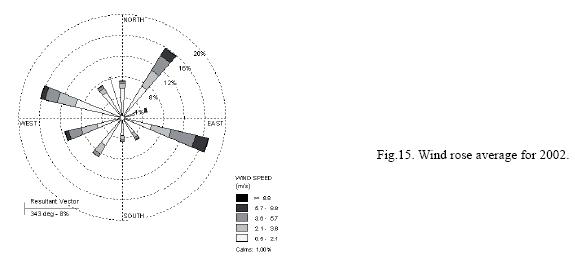
Generally, the annual wind rose (Fig. 15) shows that the wind blows, over 16%, on the direction of 110°, 16% on 35°, 16% on 285° toward the north. It means that the wind is neither perpendicular to nor parallel with the streets (Figs. 1 and 2 for streets location). In this situation, in the street, a helical vortex rises, which advances along the street, carrying on the pollutants. The highest wind speed was recorded from 240° (11.7m/s).
3.3 The K parameter to characterize the air quality
To characterize the air quality in an urban area we have introduced the normalized non–dimensional parameter K, because is more accessible for local authorities in the decisional acts related to urban air quality. This is defined as:

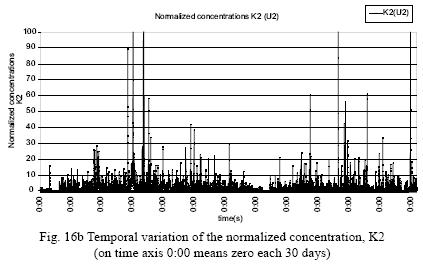
where C is the raw concentration of NO (µg/m3 converted from ppb), Uref (m/s) is the wind speed measured at the mast, H (m) is the height of the canyon and Q/L (mg/s/m) is the NO emission per unit length along the canyon (Fig. 16a and b) (Meroney et al., 1996).

The actual emissions along the streets during this experiment were not possible to be directly measured, so an estimate from the RAR (Romanian Auto Register) has been used.
For simplicity, a linear relationship between the emissions and the total traffic flow is assumed, i.e.,

where T is the total traffic flow in vehicles/h and e is an averaged emission factor for vehicles emission in the street. A value of 7.81 µg/m/veh was derived for e on U1 and U2 during peak flows, which is based on the vehicle classifications of mean traffic flow in U1 and U2, from a large number of traffic counts and the emissions database from the RAR. Using such a simple model for the emissions will exclude any effects due to idling or acceleration within the traffic flow.
The normalized concentrations K (non–dimensional), for U1 (K1) and U2 (K2) were plotted in Figure 16a and b. These graphs show a very strong temporal variability especially for K2. All the values, especially the extreme values for K2 are higher than for K1 because the traffic congestions and the characteristic stop–start traffic flows, within U2 provide substantial variability to the concentrations. This means that the fluidization within U1 is better than within U2.
4. Summary and conclusions
In this paper, the influence of traffic and wind speed and direction on the temporal variability of NOX, NO, NO2, O3 and SO2 have been investigated.
The results show relatively high levels of nitrogen oxides and traffic flow, around two times a day: in the morning between 7:00 and 10:00 local time, when people go to work, and in the afternoon, between 16:00 and 19:00 local time, when people go back home.
We have noticed a good correlation between pollutants concentrations in the street (NO, NO2) and traffic flow, despite the fact that the nitrogen oxides participate in photochemical reactions. These results prove that traffic is the most important source of NOX, emitted by running engines.
The influence of traffic flow characteristics on nitrogen oxides concentrations varied for different street canyon geometries. Therefore, the level of pollution within U2 street is reduced to 25% than within U1 street, even if the traffic within U2 street is reduced to 50% than within U1 street.
The wind influence is also observed in our analysis (Fig. 13). So, wind has a significant, but local effect on air pollution concentrations.
The traffic congestions and the stop–start traffic flows lead to high pollution and strong temporal variability (Fig. 16a and b), because they enhanced emission rates from vehicle engines. This means that the fluidization of the traffic is very necessary.
Acknowledgements
The authors gratefully acknowledge the data provided by Dipl. Eng. Octavian–Valeriu Datculescu, Romanian Auto Register, Bucharest, Romania, and for various discussions on traffic. The authors thank the two reviewers for their observations and suggestions, which helped us to improve the paper. The work of author S. Stefan was supported, in part, by the contract CEEX 734/2006.
References
Berkowicz M. K., G. Vachon, Pl. Louka, J.–M. Rosant, P. G. Mestayer and J.–F. Sini, 2002. Examination of traffic pollution distribution in a street canyon using the Nantes'99 experimental data and comparison with model results. Water Air Soil Pollution Focus 2, 311–324. [ Links ]
Briggs D. J., 1997. Mapping urban air pollution using GIS: a regression–based approach. Int. Geographical Information Science 11, 699–718. [ Links ]
Fenger J., 1999. Urban air quality. Atmos. Environ. 33, 4877–4900. [ Links ]
Kim J. J. and J. J. Baik, 2004. A numerical study of the effects of ambient wind direction on flow and dispersion in urban street canyon using the RNG k–ε turbulence model. Atmos. Environ. 38, 3039–3049. [ Links ]
Louka P., S. E. Belcher and R. G. Harrison, 2000. Coupling between air flow in streets and the well–developed boundary layer aloft. Atmos. Environ. 34, 2613–2621. [ Links ]
Meroney R. N., M. Pavageau, S. Rafailidis and M. Schatzmann, 1996. Study of line source characteristics for 2–D physical modeling of pollutant dispersion in street canyons. J. Wind Engineering and Industrial Aerodynamics 62, 37–56. [ Links ]
Morris R. D., E. N. Naumova and R. L. Munasinghe, 1995. Background air pollution and hospitalisation for congestive. Am. J. Pub. Health 85, 1361. [ Links ]
Nieuwenhuijsen M. J., 2004. Exposure assessment in occupational and environmental epidemiology. Oxford University Press, Oxford, 283 pp. [ Links ]
Theurer W., 1999. Typical building arrangements for urban air pollution modelling. Atmos. Environ. 33, 4057–4066. [ Links ]
Tripathi R. M., A. Vinod Kumar, S. T. Manikandan, S. Bhalke, T. N. Mahadevan and V. D. Puranik, 2004. Vertical distribution of atmospheric trace metals and their sources at Mumbai, India, Atmos. Environ. 38, 135–146. [ Links ]

