


Serviços Personalizados
Journal
Artigo
 Inglês (pdf)
 Artigo em XML
 Referências do artigo
 Enviar este artigo por email
Indicadores
-
 Citado por SciELO
 -
 Acessos
Links relacionados
-
 Similares em
SciELO
Similares em
SciELO
Compartilhar

 Permalink
Atmósfera
versão impressa ISSN 0187-6236
Atmósfera vol.22 no.1 Ciudad de México Jan. 2009
Comparison of gauge–corrected versus non–gauge corrected satellite–based quantitative precipitation estimates during the 2004 NAME enhanced observing period
D. J. GOCHIS
Research Applications Laboratory, National Center for Atmospheric Research, Boulder, CO, USA
Corresponding author; e–mail: gochis@rap.ucar.edu
S. W. NESBITT
Department of Atmospheric Sciences, University of Illinois at Urbana–Champaign, Urbana, Illinois, USA
W. YU
Research Applications Laboratory, National Center for Atmospheric Research, Boulder, CO, USA
S. F. WILLIAMS
Earth Observing Laboratory, National Center for Atmospheric Research, Boulder, CO, USA
Received February 14, 2008; accepted September 20, 2008
RESUMEN
Las estimaciones cuantitativas de precipitación basadas en satélite (QPE – por sus siglas in inglés), ofrecen la posibilidad de monitorear la precipitación global casi en tiempo real. Asumiendo que su exactitud (en términos de su frecuencia e intensidad) puede ser comprobada; tales productos resultarían muy valiosos para reducir la incertidumbre en la asimilación de datos en superficie, así como en las aplicaciones en simulaciones hidrológicas y de predicción a corto plazo. Durante el experimento del Monzón Norteamericano llevado a cabo sobre partes de México en 2004, se colectaron datos de lluvia para integrar una base de datos y que sirvieron para evaluar cinco productos QPE, 2 calibrados con pluviómetros y 3 más sin calibrar. El análisis de la estimación de lluvia diaria promedio y de su desviación condicional, así como los mapas de frecuencia, muestran que los productos QPE no calibrados tienden a sobreestimar la frecuencia, de los eventos de magnitud moderada a intensa (>25 mm/d), comparado con las mediciones basadas únicamente con pluviómetros. Todos los productos capturaron razonablemente la distribución de la precipitación a larga escala, pero algunos de los productos que no fueron corregidos, particularmente los que se enfocaban en las razones de lluvia basada en mediciones por infrarrojo, mostraron valores de patrones de correlación comparativamente bajos con los obtenidos de pluviómetros. Aunque los productos calibrados normalmente tienden a subestimar la precipitación incluso a valores umbrales altos, se determinó un valor significativo de corrección de sesgo que se sumó a los productos QPE calibrados con pluviómetros, a diferencia de los no calibrados. Sin embargo, este valor resalta los retos a futuro en relación a colectar e integrar datos de pluviómetros en superficie en conjunto con los productos QPE en operación.
ABSTRACT
Satellite–based quantitative precipitation estimates (QPE) offer the potential for global, near real–time monitoring of precipitation. Provided their accuracy, in terms of frequency and intensity structures, can be verified, such products would prove to be highly valuable for constraining uncertainty in land data assimilation, hydrological simulation and short–term prediction applications. Two gauge–corrected and three uncorrected satellite–based QPE products are assessed over México against a new composite gauge dataset developed from data collected during the 2004 North American Monsoon season. Analysis of daily averaged rain rates, rain–rate conditional biases, and frequency maps each show a tendency for uncorrected satellite QPE products to overestimate the frequency of moderate to heavy precipitation events (>25 mm/d) with respect to gauge–only analyses. While all products reasonably captured the large–scale distribution of rainfall, some uncorrected products, particularly those emphasizing infra–red based retrieval of rain rates, possessed comparatively low pattern correlation scores with the gauge composite. Although gauge–corrected products tended to somewhat underestimate rainfall at heavy event thresholds, significant value, in terms of overall bias correction, appears to be added to gauge–corrected QPE products versus uncorrected products. This added value, however, highlights ongoing challenges with regards to collecting and integrating surface gauge data in an operational QPE framework.
Keywords: Precipitation, remote sensing, land data assimilation, North American Monsoon, México, hydrologic modeling.
1. Motivation
Accurate and timely quantitative precipitation estimates (QPE) are essential for forecasting and mitigating flood hazards (Scofield and Kuligowski, 2003) and landslide potential (Hong et al., 2007b), assessing water resources, forecast model verification (Janowiak et al., 2007), land data assimilation and, more generally, improving our process understanding of energy and water exchanges at the Earth's surface. These applications are particularly relevant in semi–arid ecosystems whose hydrologic inputs can be highly variable as well as highly concentrated in both space and time. Two goals of the North American Monsoon Experiment (NAME c.f. Higgins et al., 2006, and Higgins and Gochis 2007, for details) are to improve understanding of land–atmosphere processes in the semi–arid regions of southwestern North America and, most importantly, to transfer this new understanding into improved predictions of monsoon precipitation. Recent data impact studies using special observations collected during the 2004 NAME Enhanced Observing Period (EOP), have demonstrated that assimilation of precipitation analyses into the operational Continental Data Assimilation System (CDAS), run at the US National Weather Service, National Center for Environmental Prediction, has a direct and beneficial impact in developing more accurate analyses of atmospheric conditions used to initialize weather prediction models (Mo, 2007, and personal communication). The impacts from assimilating precipitation on lower atmosphere (i.e. below 500 mb) thermodynamic structure can, at times, be as great as the impact from additional atmospheric soundings. Remotely sensed QPE from satellites provide the potential for continuous global estimates of precipitation; however their accuracy with respect to ground–based measurements must be established. Therefore, continued rigorous assessment of currently operational satellite–based QPE products for the North American Monsoon (NAM) and other hydroclimatically complex regions is warranted and is subject of much ongoing research (e.g. Huffman et al., 2007; Hong et al., 2007a; Nesbitt et al., 2008). This paper aims to assess the performance of five currently operational remotely sensed precipitation products in their ability to represent the statistical characteristics of NAM precipitation using a special composite of ground based rain gauge measurements developed for the 2004 NAME EOP.
To illustrate the importance of this and similar assessments, the sensitivity of model–analyzed NAM hydrological fluxes to precipitation forcing is demonstrated for July and August of 2004 in Figure 1. Here, we have driven an operational version of the Noah land surface model (Ek et al., 2003) within the NCAR High Resolution Land Data Assimilation System (HRLDAS–Chen et al., 2007) using a spatial grid of 4 km resolution with 3–hourly North American Regional Reanalysis (NARR–Mesinger et al., 2006) meteorological forcing (e.g. temperature, humidity, wind speed, pressure, incoming short and longwave radiation) and five different satellite QPE products. The satellite products are a subset of those analyzed below and include CMORPH (Joyce et al., 2004), RMORPH (Janowiak et al., 2007), PERSIANN (Hsu et al., 1997; Sorooshian et al., 2000), and TRMM3b42 (Huffman et al., 2007; each of these products are described in detail in Section 3 below). The only difference between model simulations is the prescribed precipitation forcing. It is shown in Figure 1 that land surface hydrological fluxes of surface evapotranspiration (ET) and runoff, and the runoff fraction (equal to the fraction of total runoff over accumulated rainfall) vary substantially between simulations. Although the coarsest scale (e.g. O1000 km) spatial distribution of simulated ET, runoff and runoff fractions are similar between model runs, there are marked differences in the magnitude and regional scale (e.g. O100 km) variability of fluxes. The region of Jul–Aug accumulated ET in excess of 400 mm in western México for CMORPH and PERSIANN far exceeds the extent covered in the RMORPH and TRMM3b42 simulations. Furthermore, the differences in surface runoff and runoff fraction are quite large between the products revealing not only the impacts of differences in total precipitation but also impacts related to differences in rainfall intensity which, largely, control partitioning between infiltration and surface runoff for a given soil type and vegetation cover.
For remotely sensed precipitation products to be useful in land data assimilation in the NAM region, some assessment of product accuracy must be made in order to constrain the degree of hydrological forcing into the land surface. The special composite gauge dataset described below provides a unique opportunity to comprehensively assess the performance of several currently operational satellite QPE products for the 2004 NAME EOP and to support current and future studies of the North American Monsoon system.
2. Background
Satellite remote sensing based estimates of NAM precipitation have been conducted for several years. Negri et al. (1993, 1994) used Special Sensor Microwave Imager (SSM/I) data to characterize the extent and intensity of diurnally driven convective rainfall in western México. Averaged rain rates derived from morning and afternoon overpass times produced reasonable estimates of monthly total rainfall for parts of western México on the order of 400–600 mm/month. Later, Cortez–Vázquez (1999, 2000) used infra–red based estimates of outgoing longwave radiation to characterize the climatological seasonal evolution of convective clouds over México, as well as various modes of intra–seasonal variability. While these early studies made significant contributions to the characterization of the diurnal and seasonal evolution of rainfall in the remote regions of western México, uncertainty in rainfall rate estimates and poor correlation with surface gauge measurements limited confident application of such products for more detailed hydrological–based studies such as rainfall–runoff or land surface modeling.
Through the NAME research program, several recent works have made significant progress in refining definition of the character of diurnal rainfall and cloud structures over the NAM region of northwest México and the southwest US. These studies have used a wide array of surface rain gauge, surface radar and space–borne platforms. Using a network of 87 automated rain gauges distributed across the complex terrain of the Sierra Madre Occidental (SMO), Gochis et al. (2003, 2004) documented the diurnal cycle of rainfall frequency and intensity patterns as they relate to variations in elevation and their proximity to the Gulf of California. This pattern is described as one where precipitation initiates shortly after midday, and most frequently, over the high elevations of the western slope of the SMO, but with a modest intensity, and later in the afternoon and evening but less frequently and often with greater intensity at lower elevations. Gochis et al. (2007a) highlighted the fact that rainfall intensity distributions at low (0–1000 m), mid (1000–2000 m) and high (2000–3000 m) elevations are distinct from one another and that the heaviest daily rainfall intensity values are confined to a relatively narrow region in the coastal and foothill regions in between the SMO and the Gulf of California. Rowe et al. (2008) recently verified this elevational dependence of rainfall intensity distributions using a dual–polarization, calibrated radar composite developed during the 2004 NAME EOP. Analyzing surface rain gauges, IR–based imagery and Topical Rainfall Measurement Mission (TRMM) precipitation radar data, Gebremichael et al. (2007) also found a strong expression of topography on diurnally–evolving mesoscale and sub–mesoscale precipitation structures in a local region of far northwest México. Despite the regularity of the diurnal cycle and its apparent phase locking with the terrain of the SMO, Lang et al. (2007) illustrated that the organization and propagation of convective elements often deviate from their preferred pattern under so–called 'disturbed' regimes.
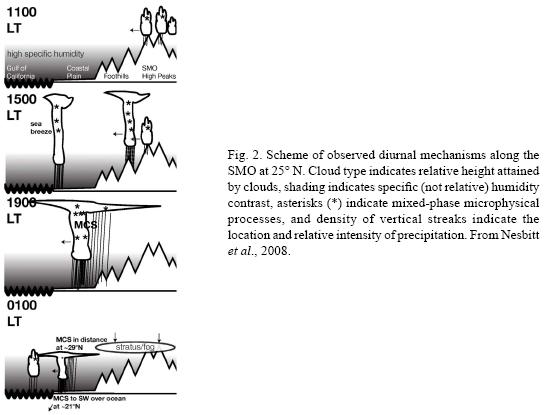
While the initial studies of Negri et al. (1993, 1994) and Cortez–Vázquez (1999, 2000) provided preliminary insight into the diurnal and seasonal evolution of cold cloud occurrence over western southwestern North America, detailed investigations into the cloud structures responsible for generating NAM precipitation have only recently been completed. In evaluating the PERSIANN–CCS (Precipitation Estimation from Remotely Sensed Information Using Artificial Neural Networks – Cloud Classification Scheme) product, Hong et al. (2007a) found an elevation dependent bias in rainfall frequency and intensity when compared with the gauge data of Gochis et al. (2003, 2004). The elevation–dependent structure of this bias was hypothesized to be caused by an over–dependence of PERSIANN, and presumably other infra–red based retrieval methods, on the relationship between cloud top brightness temperatures and rainfall occurrence and intensity. The manifestation of this bias structure was an underestimate of rainfall frequency and intensity at high elevations of the SMO and an overestimation at lower elevations. Nesbitt et al. (2008) expanded this work significantly by investigating biases in a broader suite of spaceborne precipitation retrievals in the context of infrared brightness temperature data (used to infer cloud top height), ground–based radar, and surface gauge data. The principal findings of Nesbitt et al., 2008 are encapsulated in the conceptual diagram illustrated in Figure 2. These findings suggest a diurnally–modulated cloud regime where convective clouds form shortly before local solar noon over the high terrain of the SMO but whose total cloud depths are relatively shallow (i.e. not of tropopause depth), are relatively deficient of deep mixed–phase processes and are of low cloud base height with respect to terrain. Over lower terrain elevations of the SMO and along the coastal plain region, while clouds tend to be less frequent, they more often are of tropopause depth, possess substantial mixed phase processes and have significantly higher cloud base heights. The results of Nesbitt et al. (2008) were confirmed in the radar studies of Rowe et al. (2008) who also found a general decrease in convective cloud thickness and cloud top height overlying increasing terrain elevations as one proceeds from the Gulf of California coastline eastward to the crest of the SMO.
The purpose of this article is to assess the error characteristics of five currently operational satellite QPE products over the NAME region as compared with a special composite surface rain gauge data set for the 2004 NAME EOP. Emphasis is placed on evaluating the spatial patterns of rainfall frequency at a range of precipitation threshold exceedence values. It is acknowledged that significant and complex uncertainties exist when comparing precipitation measurements from different platforms (e.g., from gauges, radars, and satellite estimates) due to spatial and temporal sampling differences, retrieval errors, poor gauge maintenance, in–optimal gauge siting, etc. (c.f. Tustison et al., 2001, 2003; Steiner et al., 2003; Sieck et al., 2007). A comprehensive treatment of all uncertainties is beyond the scope of any one study but a body of studies taken together, such as those discussed above and that presented here, in time, serve to provide a robust analysis.
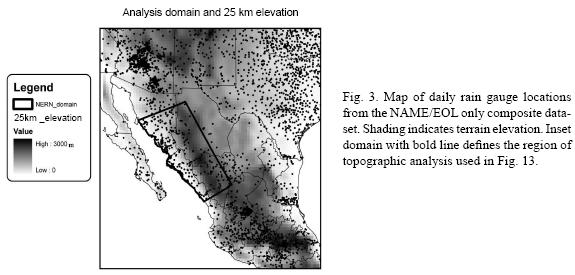
The work presented here differs from the previously mentioned studies in that a) there is a comparative emphasis on evaluating the skill of the QPE with respect to a newly developed gauge composite dataset, b) our region of assessment is fairly broad which makes it more relevant for continental–scale land data assimilation applications, and c) the gauge data set used is clearly superior in terms of the number and spatial distribution of stations compiled compared with previous studies. We compare three satellite–only products versus two gauge–corrected satellite products, each of which is described in Section 3 over the NAME Tier 1.5 domain (Fig. 3) which is similar to that used in the NAME Model Assessment Program (NAMAP, Gutzler et al., 2005). The gauge data used are also described in Section 3. Although results are presented for the entire study domain, emphasis is placed on evaluating products over the core area of the NAM over the SMO of western México. In performing this assessment we attempt to answer the following research questions: what are the relative error characteristics of a selection of operational satellite QPE products when compared with ground–based rain gauge network in the NAM region?; and, to what degree are these error characteristics ameliorated by operational gauge correction procedures? Results of our assessment are provided in Section 4 and these finding are discussed in Section 5.
3. Data and model descriptions
3.1 NAME/EOL Gauge–only composite datasets
As discussed in Gochis et al. (2004, 2007a) and in Cavazos et al. (2007) the operationally–available ground–based precipitation observing network in the core region of the NAM in northwest México is sparse. This deficiency is particularly true with respect to the distribution of operationally–available stations across the complex and remote terrain of the Sierra Madre Occidental mountains, the Mexican Plateau and the Sierra Madre Oriental mountains. There is also a general lack of availability of precipitation measurements with sub–daily time resolution. The lack of fine–scale precipitation observing networks has and continues to limit assessment of remotely sensed QPE from space–borne platforms over the NAM region and significantly complicates the validation and improvement of numerical models used to simulate critical features of the NAM precipitation climatology (Gutzler et al., 2005). In recognition of this deficiency, the NAME research program has made several enhancements to the regional precipitation observing network (e.g. Gochis et al., 2007a; Lobato–Sánchez et al., 2007) and has undertaken a concerted effort to unify existing cooperative climate observer measurements. This effort has resulted in the development of a gauge–only composite dataset for the 2004 NAME EOP which possesses a significantly improved distribution of ground–based station measurements across western México. Figure 3 shows the distribution of surface rain gauges that have been collected as part of the NAME/EOL (Earth Observing Laboratory of the National Center for Atmospheric Research–NCAR) gauge–only precipitation composite for 2004 (data available online at: http://data.eol.ucar.edu/master:list?project=NAME). While the composite dataset contains data from both manual and automated rain gauges from the US and Mexican operational networks, it also includes many datasets that are not typically available for real–time data products or the climate archive maintained by the US National Climate Data Center, particularly from México. These datasets include gauge observations from agricultural mesonets, river basin networks, the Mexican Navy, the NAME Event Rain gauge Network of Gochis et al. (2004, 2007a), and the NAME simple rain gauge network of Lobato–Sánchez et al. (2007), among others. All gauge data were passed through the same quality control procedures developed by NCAR EOL in addition to their native source quality control which include gross error checking as well as manual inspection for some stations. Complete details on the networks contained within the NAME/EOL composite and the quality–control procedures used can be found online at http://data.eol.ucar.edu/codiac/dss/id=82.140.
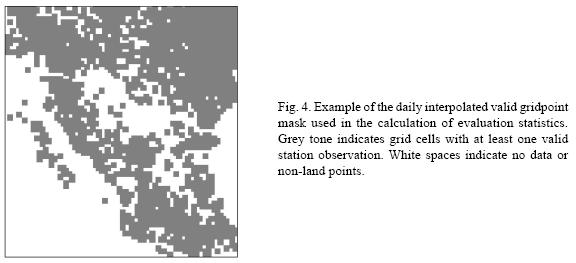
Comparisons between satellite QPE and surface gauge measurements are made by interpolating the gauge data and all satellite data to a common, spatially–continuous grid with a horizontal resolution of 0.25°. Point gauge data were interpolated using the natural neighbor interpolation method (Sibson, 1981; Watson, 1992) available in the 'ncl' (NCAR Command Language) suite of analysis tools. This method is comparatively more dynamic than typical inverse distance weighting or Cressman–type analyses (Cressman, 1959; Barnes, 1964) such as that used in the National Oceanic and Atmospheric Administration (NOAA) Climate Prediction Center (CPC) Unified Rain Gauge Dataset (URD, Higgins et al., 2000) in that it does not require a fixed search radius or minimum number of data points. Essentially, natural neighbor weighting methods permit enhanced characterization of anisotropic fields from unevenly spaced data points compared with distance–based methods (Watson, 1992). This capability is particularly attractive for observations of warm season, convective precipitation, which can be highly localized in space and time. All of the analyses below are performed using this interpolated gauge product. However, as noted later, many of the error statistics are calculated using only gauge interpolated grid cells which contain at least one valid gauge observation or, in other words, a matching gauge–satellite data pair, which required creating a mask of matching pairs for each day during July and August of 2004. An example of the spatial distribution of valid gauge–interpolated grid points is provided in Figure 4. The purpose of this filtering of the data is to minimize the influence of the gauge interpolation procedure on some of the statistical analysis.
3.2 Satellite–based QPE products
We compare five currently operational satellite QPE products against the gridded EOL gauge composite described above. Gridded 0.25° horizontal resolution satellite data were integrated in time to create daily rainfall estimates for July and August of 2004. In this work we compare the performance of two gauge–corrected products against three un–corrected products. Three of these satellite products were described in Nesbitt et al. (2008). Here we briefly detail these three products and two additional products as follows.
The NOAA Climate Prediction Center MORPHing technique (hereafter referred to as CMORPH) advects precipitation estimates from all available, low–Earth orbiting, passive microwave (PMW) sensors in time using higher temporal resolution geostationary infrared (IR) data (Joyce et al., 2004; Janowiak et al., 2007). PMW rainfall is composited on a global grid every 30 min, and in times between PMW passes, IR brightness temperatures from the global constellation of geostationary IR satellites are used to advect PMW features using a "morphing" procedure. This blending technique results in a globally–continuous data product that is available at every 30 min with a latency past real–time of about 18 hours. (Details available online: http://www.cpc.noaa.gov/products/janowiak/cmorph_description.html).
Owing to known deficiencies in both IR and PMW–based precipitation retrieval methods, Janowiak et al. (2007) describe a gauge–correction procedure for CMORPH resulting in a new product called RMORPH. Gauge correction is performed by calculating the ratio between CMORPH and the Climate Prediction Center gauge–only, gridded, daily total rainfall product (Higgins et al., 2000), and then multiplying this ratio by the original CMORPH estimate. In doing so, CMORPH is used as a diurnal disaggregator of the daily gauge estimates. It is noted that the correction procedure in RMORPH is only applicable to land points and that uncertainties in the daily gauge product resulting from the sparcity of operationally–available data directly translate into uncertainties in the final RMORPH product. As with CMORPH, RMORPH estimates are available every 30 min but with a data latency of at least 1–1.5 days. Both CMORPH and RMORPH are available from 60° N–60° S on 8 km and 0.25° grids, the latter of which is used in this assessment.
We make a special note regarding the RMORPH product in our analysis. Over México the EOL composite contains 1300 daily station observations on average. The daily CPC gridded product of Higgins et al. (2000) was reported to ingest on average around 900 station observations from México during the 2004 NAME EOP (Wei Shi, 2008, personal communication). For this study, no attempt was made to partition the datasets with respect to gauges or grid–cells that contained matching gauge observations in RMORPH or the EOL gauge composite. Therefore, our inclusion of RMORPH in this analysis is only to serve as a reference of a gauge–corrected product and the evaluation metrics provided must be regarded as significantly biased. We feel inclusion of RMORPH is warranted because it can be directly contrasted with CMORPH which is not corrected by surface gauge observations.
The PERSIANN rainfall product uses neural network classification/approximation procedure to compute an estimate of rainfall rate (Hsu et al., 1997; Sorooshian et al., 2000). Initial rainfall estimates are generated using geostationary IR brightness temperatures. The algorithm then incorporates TRMM 2A12 passive microwave rainfall estimates with the above as input into the neural network. Note that this study uses the operational version of PERSIANN, while a related study by Hong et al. (2007) uses a parallel version of PERSIANN with a cloud classification scheme (PERSIANN–CCS). The PERSIANN–CCS is described as using the spatial structure of measured IR brightness temperature characteristics to select a more appropriate microwave rain rate estimate (Hong et al., 2004). Rainfall estimates from PERSIANN are available on a 50° N–50° S 4 km grid every 30 min, although here we evaluate a version of PERSIANN which has been aggregated to a 0.25° grid. (Details available online: http://hydis8.eng.uci.edu/persiann).
Full details on the TRMM multi–satellite precipitation analysis (TMPA) products have recently been provided by Huffman et al. (2007). In this work we utilize two of the family of version 6 TMPA products: the real–time multi–satellite analysis (hereafter referred to as TRMM_RT) and the non–real–time merged satellite–gauge analysis product (hereafter TRMM3b42). The base TMPA algorithm calibrates IR rain–rate estimates with TRMM radar and TRMM passive microwave estimates of precipitation, as well as other available passive microwave satellites (Huffman et al., 2001). Native spatial and temporal resolutions of the TMPA products are 0.25° and three hours, respectively. A gauge corrected procedure over land points is applied in the non–real–time TRMM3b42 product used here which involves scaling monthly accumulations of the TRMM_RT estimates by the ratio of monthly gauge accumulations to those of the TRMM_RT. The gauge data sets used in this correction procedure are the Global Precipitation Climatology Project (GPCP) monthly gauge analysis (Adler et al., 2003) and the Climate Assessment and Monitoring System monthly rain gauge analysis (Xie and Arkin, 1996). Using the event rain gauge network of Gochis et al. (2004), Huffman et al. (2007) showed that the TRMM3b42 product reasonably captures the diurnal cycle of precipitation across the Sierra Madre Occidental, albeit with a phase lag of approximately 2 hours delay and a slight overestimate in the magnitude of peak rainfall. Differences between the uncorrected real–time TRMM_RT and gauge–corrected TRMM3B42 used here are also discussed in Huffman et al. (2007), and suggest that the real–time product has a significant positive bias compared with the non–real–time 3b42 product. We note that the TRMM_RT product contained missing 5 days (approximately 8% of the total record) during the NAME EOP in Jul–Aug 2004. These missing days are not present in the TRMM3b42 product. In contrast to RMORPH, there is little overlap of the gauge data used in the TRMM3B42 product. During July and August of 2004 approximately 45–50 gauge observations reside in the Global Precipitation Climatology Centre (GPCC) database which is used in the GPCP monthly analysis for México, which is less that 4% of the 1300 gauges residing in the EOL database. (Information on the GPCC database is available online at: http://orias.dwd.de/GPCC/GPCC_Visualizer). Given the small fraction of potentially overlapping stations between TRMM3b42 and the EOL gauge composite, we view these data sets as essentially independent. (Details on the TRMM products are available online at: http://trmm.gsfc.nasa.gov/data_dir/data.html).
All satellite QPE datasets had a land mask applied to facilitate comparison with land–based gauge data. As mentioned above, all contingency attributes were calculated using only grid cells which contained at least one valid station point. Conversely, frequency histograms and cross–correlation fields shown below were generated from all land points regardless of whether or not a valid station observation was available.
4. Results
Comparisons of 2004 Jul–Aug daily average precipitation from the interpolated EOL gauge composite and the five satellite QPE products are shown in Figure 5. Daily average precipitation was used as opposed to total precipitation due to the fact that the TRMM_RT product possessed several instances of missing data fields in which case data for missing days was not used. Provided in each sub–panel are the domain maximum daily average rainfall rate (MAX Davg), conditional biases (BIAS) and root mean square differences (RMSD) using a threshold of events greater than 1 mm/d. Also provided are the absolute maximum daily total precipitation values (Abs DMax) from the entire record from each product. The BIAS and RMSD values were calculated from the time series of daily analyses using only grid cells where a valid gauge observation was present for interpolation. From Figure 5 it is evident that all QPE products reasonably represent the large–scale distribution of precipitation throughout the domain. In particular, the axis of maximum warm season precipitation along the western SMO slopes is clearly evident, as are comparatively dry regions in north central and northeastern México. In terms of overall conditional mean bias structures, the two gauge–corrected QPE products (TRMM3b42 and RMORPH) each possess very small magnitude biases (–1.3 and 0.2 mm/d, respectively) though they appear to be deficient in capturing some of the localized high accumulation areas over western and southwestern México compared to the EOL composite. This deficiency in capturing relatively localized maxima is further evidenced by lower estimates of maximum daily rainfall rate compared with the EOL composite. In other, drier regions, monthly totals from TRMM3b42 and RMORPH are generally equivalent with those from gauges.
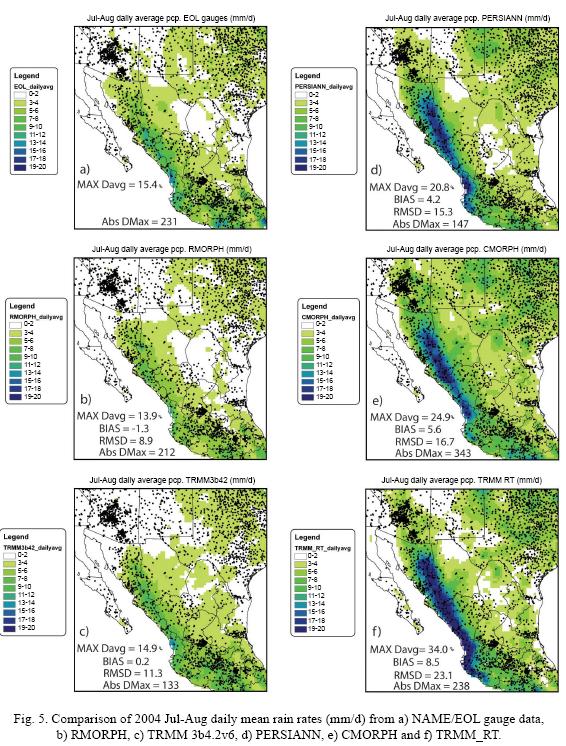
The uncorrected gauge products CMORPH, PERSIANN and TRMM_RT, each tend to overestimate both the extent and magnitude of daily averaged rainfall compared with gauges resulting in a higher magnitude and positive conditional bias (5.6, 4.2 and 8.5 mm/d, respectively) with respect to the gauge–corrected products. Also, RMSD values are moderately higher for CMORPH, PERSIANN, and TRMM_RT (16.7, 15.3, and 23.1 mm/d, respectively) than for RMORPH and TRMM3b42 (8.9 and 11.3 mm/d, respectively). In addition to a general overestimation in the extent and magnitude of rainfall, CMORPH, PERSIANN and TRMM_RT each significantly overestimate the magnitude and extent of high rainfall accumulation over western México. While this strong positive bias does not exist in all locations, in the northern SMO this overestimate can be in excess of 100% of the EOL gauge estimates.
The absolute maximum daily total values range widely and do not show any correspondence to gauge–corrected or non–gauge–corrected QPE products. The maximum one–day rainfall observed at an EOL gauge site was 231 mm. Similar values of 212 and 238 mm were observed in the RMORPH and TRMM_RT products, respectively. The TRMM3b42 and PERSIANN products possessed substantially lower maximum values of 133 and 147 mm, respectively. Conversely, CMORPH possess a maximum daily total value (343 mm) far in excess of that observed by any of the other products or gauges. The fact that the different products have such a large range in their maximum observed values complicates statistical characterization of error structures for low frequency (i.e. high intensity) events as discussed below.
Next, we assess the statistical character of rainfall from each of the QPE products in order to identify rainfall frequency and intensity characteristics that may influence the aforementioned bias structures. Figures 6, 7 and 8 show maps of rainfall frequency where precipitation threshold values of 1, 10 and 25 mm/d have been applied. Additionally, Figure 9 provides frequency histograms from each of the products at the 1, 10, 25, and 50 mm/d threshold values. Data from all land points are used in the analysis of rainfall frequency. Clearly, the dominant feature of the analyses is the trend towards lower frequency values for higher rainfall event thresholds. Furthermore, as with the daily average rain rate maps in Figure 5, each of the QPE products captures the general pattern of rainfall frequency variation, highlighting maxima in the regions of western México and the central Mexican highlands and Sierra Madre del Sur towards the southern end of the domain. This frequency pattern roughly mirrors the distribution of significant topographic features within the domain, thus highlighting the partial control of rainfall by topography as discussed in previous works (e.g. Gochis et al., 2007a; Janowiak et al., 2007; Lang et al., 2007; Nesbitt et al., 2008 and Rowe et al., 2008). At each threshold value, the CMORPH and PERSIANN satellite QPE products tend to overestimate the frequency of rainfall events, particularly over western México. An increased frequency of heavier events (10, 25 and 50 mm/d) becomes more evident for in all uncorrected satellite products (CMORPH, PERSIANN and TRMM_RT) as evidenced by the frequency maps and the rainfall histograms. Specifically, each possess heavier tails at nearly all frequency levels in their histograms than do gauges at the 10, 25 and 50 mm/d thresholds and each possesses significant area in western México where the frequency of 10 and 25 mm/d events is greater than 0.4 (green shading). The ranges of comparatively high frequencies for moderate and large events contrasts with those of the interpolated EOL gauge composite data or either of the two gauge–corrected satellite QPE products. Conversely, both TRMM3b42 and RMORPH appear to underestimate the frequency distribution and spatial extent of rainfall frequency values at event thresholds of 10 and 25 mm/d. Also, the occurrence of >25 mm/d precipitation events in TRMM3b42 and RMORPH appear to be restricted to the western coast of mainland México on the Gulf of California coastal plain, an extent somewhat narrower than that of the EOL gauge product. Our interpretation of these latter features is that while the gauge correction procedures used in TRMM3b42 and RMORPH do serve to remove a significant overestimate of rainfall occurrence and magnitude in uncorrected products over western México, the impact is to underestimate the frequency of rainfall with respect to the independent gauge analysis of the EOL composite. Whether or not this apparent overcorrection is the result of the correction procedure or deficiencies in the available operational gauge data used in the gauge–correction procedures remains an open question.
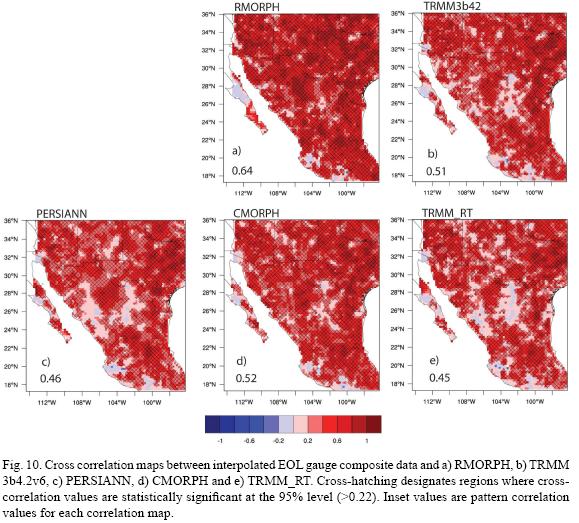
We explore the space–time correlation structure between the satellite QPE products and the EOL gauge product through the use of cross–correlation maps, pattern correlation scores and principal components analysis. Pattern correlation values are estimated using only land points and statistical significance of cross–correlation values are calculated using a two–tailed t–test at the 95% level (equivalent to minimum correlation value of approximately 0.22 with a sample size of 62 –57 for TRMM_RT–). Overall cross–correlation (cc) scores shown in Figure 10 reflect reasonably positive and statistically significant agreement in daily precipitation in all products. However, appreciable differences in the magnitudes and spatial distribution of cc values exist between products. Due to the large number of common gauge observations, the RMORPH product exhibits overall highest spatial correlation with a pattern correlation score of 0.64 and nearly the entire land area domain. TRMM3b42 and CMORPH exhibit similar spatial distributions of cross correlation values and, subsequently, similar pattern correlation values of 0.52 and 0.51, respectively. Both TRMM_RT and PERSIANN have difficulty in regions of north central and western México where cross–correlation values fall below 0.2 and are not statistically significant at the 95% level. Correspondingly, both TRMM_RT and PERSIANN possess pattern correlation values that are lower than RMORPH, TRMM3b42 and CMORPH.
A principal components (PC) analysis was performed as a means to intercompare the coherency of spatial variability patterns in between the daily EOL gauge product and the QPE product. It needs to be stressed that the patterns diagnosed, even from the EOL gauge composite, are not to be interpreted as robust climatological patterns of daily rainfall in nature. In particular, due to the relatively small sample size (62 days for the gauges, RMORPH, CMORPH, PERSIANN and TRMM3b42, 57 days for TRMM_RT) and the large degree of spatial variability of rainfall in the NAM system, there exists significant uncertainty as to whether or not the diagnosed patterns represent robust physical modes of the NAM climate system. On the contrary, here we simply use the diagnosed EOF patterns and the correlation structure of the eigenvector time–series as a means to assess the agreement between the products and not to infer a physical behavior of the NAM climate system. Figure 11 shows the loading values and percent of variance explained by the first three principal components of daily precipitation by each product. The plotted values are standardized values of the PC–loading factors such that the sum of the square of all gridpoint values equals one. We attempted to apply the variance based selection criteria of North et al. (1982) to isolate leading distinct modes from those that are potentially degenerate in terms of their contribution to daily precipitation variance. All QPE products exhibited at least one separable mode with the exception of TRMM3b42. Up to three principal components were separable for most products although the PERSIANN, CMORPH and gauge products exhibited only small changes in contributed variance between the second and third components. All products showed very little changes in contributed variance between the third and fourth components, so for comparison sake, we show the first three components from each product in Figure 11.
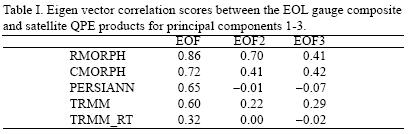
The most dominant feature of the analysis is the large concentration of loading factors in PC1 that is present over Texas, which, in most cases extends southwestward into north central México. This pattern is likely an expression of the positive seasonal precipitation anomaly in the northeastern portions of the NAM region as described by Douglas and Englehart (2007) and slightly below normal precipitation in western México. A basic expression of this pattern in all products appears to contribute to the existence of statistically–significant correlations (Table I) between the time series of eigenvectors from each product and the gauge composite for PC1. However, a weak correlation score between EOL gauges and TRMM_RT for PC1 and visual inspection of the loading patterns suggests this agreement is tenuous at best. There is clear agreement between each of the three PC patterns from the EOL gauge composite and those from the RMORPH product, with PC3 showing the weakest agreement. It is interesting to note the strong and comparatively coherent concentration of loading values in each of the three leading components in both PERSIANN and TRMM_RT, and to a much lesser degree CMORPH, over western México, a feature that is not as distinct in either the EOL gauge or gauge corrected QPE (RMORPH and TRMM3b42) products. Most products show comparatively poor agreement with the EOL gauges in terms of the spatial pattern of loading values or eigenvector correlation scores for PC3.
To explore the rate dependent bias structure of the QPE products further, Figure 12 shows the conditional bias and RMSD values calculated at precipitation thresholds from greater than or equal to 0 mm/d (i.e. all valid measurement days) to greater than or equal to 50 mm/d. Note that the conditional bias, as in Figure 5 above, is calculated only for days in which both products meet the prescribed threshold value and only for those grid cells that physically contain an actual gauge observation. Conditional bias structures from the 0–25 mm/d threshold values are generally consistent with the differences in the threshold rainfall frequency values shown above. Uncorrected satellite QPE products (CMORPH, PERSIANN and TRMM_RT) each show significant positive biases, while the two gauge–corrected products RMORPH and TRMM3b42 exhibit small magnitude biases, both of which become negative by the 25 mm/d threshold value. The CMORPH and TRMM_RT products have RMSD values largely in excess of those from the other product through the 25 mm/d threshold value. Also, through the 25 mm/d threshold value, RMSD monotonically increases, though is not necessarily linear for all products.
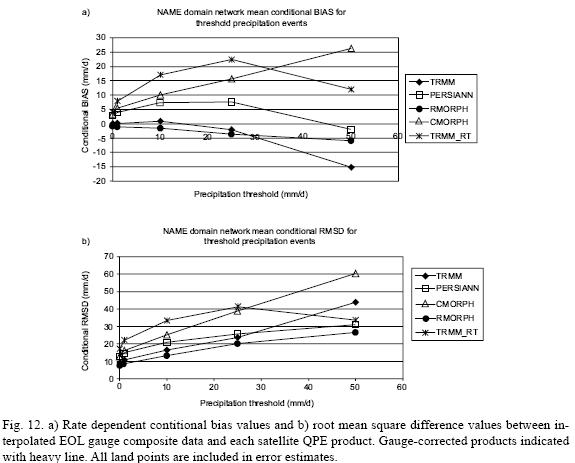
The behavior of the conditional bias and RMSD at the 50 mm/d threshold is less consistent. There is a distinct drop in the RMSD and in the magnitude of the conditional bias for the TRMM_RT product, which is somewhat counterintuitive given the heavy tail of >50 mm/d frequencies in the TRMM_RT frequency histogram. This behavior is due to the influence of large error magnitudes of the largest rainfall events. By comparing the ranking absolute maximum daily total values (Abs DMax from Fig. 5) it is seen that CMORPH possesses both the largest bias at the 50 mm/d threshold and the largest value of Abs DMax. Similarly, PERSIANN, RMORPH and TRMM3b42 all have Abs DMax values less than that of the gauges, and subsequently have negative biases at the 50 mm/d threshold. The control of the conditional bias and RMSD values at this threshold from the over– or under–estimation of the largest events appears to occur in spite of the overall shape and weight of the frequency histogram distributions given in Figure 9, thus highlighting the impact of a few large event errors on the overall bias structure at thresholds that possess a relatively small sample of events. It is also interesting to note that the RMSD values for TRMM3b42 also become greater than those of TRMM_RT at the 50 mm/d threshold highlighting the significant underestimate in the occurrence of heavy rainfall events in TRMM3b42.
To facilitate comparison of the elevation dependent rainfall structures of these QPE products with earlier studies by Gochis et al. (2004, 2007a), Nesbitt et al. (2008) and Rowe et al. (2008), Figure 13 shows the variation in the estimated mean frequency of precipitation with elevation as sampled over the NERN domain of Gochis et al. (2004) shown in Figure 3. Families of curves from the QPE and gauge products are shown for the 1 and 25 mm/d threshold values and the elevation bins used here are 0–1000, 1000–2000 and 2000–maximum elevation (3280 m) mapped from the USGS North American Hydro 1k dataset (USGS, 2006). As documented by each of the earlier diagnostic studies, rainfall in this limited domain is characterized by comparatively high frequency but low magnitude events at higher elevations and lower frequency but higher magnitude events at lower elevations. The same elevation dependent trends are evidenced as above, where, for 1 mm/d event thresholds, precipitation frequency clearly increases with increasing elevation for all QPE products, and, for 25 mm/d event thresholds, precipitation frequency generally decreases with elevation, particularly between the 1000–2000 and 2000–3280 m elevation bins. Subtle differences in the frequency patterns at low versus high elevations between products are also evident in Figure 13 and can be compared against the frequency maps shown in Figures 6, 7 and 8. Notably, the positive bias in 1 mm/d threshold events in CMORPH becomes most evident at mid and high elevation locations. Conversely, both TRMM based products (3b42 and RT) tend to underestimate the frequency of 1 mm/d threshold events with respect to gauges events along the low elevation regions west of the Sierra Madre Occidental. All uncorrected QPE products (CMORPH, PERSIANN and TRMM_RT) significantly overestimate the frequency of 25 mm/d threshold events at all elevations. Although various bias structures of the QPE products are evident, it is clear that each of the QPE products captures the general relationship of rainfall frequency and intensity with respect to elevation over a limited region of western México.
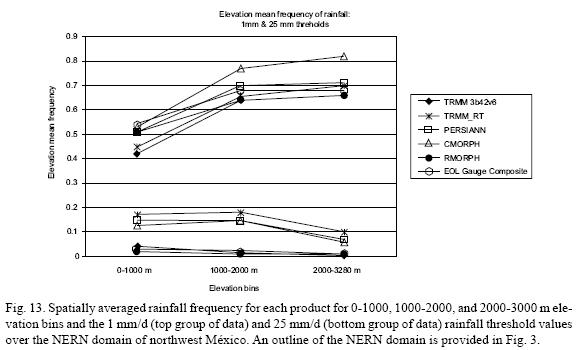
Figure 14 provides the contingency statistics (Threat Score–TS, False Alarm Ratio–FAR, Probability of Detection–POD, and Hiedke Skill Score–HSS) for each of the QPE products at precipitation threshold values of 0, 1, 10, 25, and 50 mm/d. As with the conditional bias estimates, each of the contingency statistics is calculated only for grid cells which contain valid gauge observations, thereby minimizing uncertainties related to the gauge interpolation procedure. There is a clear trend in all products towards decreasing skill and POD values and increasing FAR values for increasing rainfall threshold values, reflecting a persistent difficulty for all products to verify large precipitation events. Not surprisingly, differences in POD values between QPE products tend to reflect the differences in FAR values. While POD values remain comparatively high for CMORPH and TRMM_RT at all thresholds, they are associated with concurrent high FAR values. All products exhibit both high FAR and low POD values at the 25 and 50 mm/d thresholds. The RMORPH product exhibits contingency scores that are comparable to other products at low precipitation thresholds. However, at the larger (25 and 50 mm/d) thresholds RMORPH possesses modestly superior scores, particularly with regard to TS, FAR and HSS values, which likely highlights the influence of non–independent gauge data. Skill scores from the other QPE products appear to suffer from respective biases at the larger threshold values which, from above, include high bias for CMORPH, PERSIANN and TRMM_RT. The low bias in TRMM3b42, diagnosed above, appears to manifest itself as a low POD score at the 25 and 50 mm/d threshold values. Otherwise, the TRMM3b42 product exhibits modestly superior TS and HSS scores at the 25 and 50 mm/d thresholds compared to CMORPH, PERSIANN and TRMM_RT.
5. Summary and discussion
Using a special composite of daily rain gauge data for the US and México, this study has assessed the performance of five operational satellite–based remotely sensed QPE products during the 2004 NAME EOP. The development of the EOL gauge composite dataset for NAME provides a unique opportunity for satellite QPE assessment given the very large number of station observations compiled that are not often available during operational product generation nor contained within typically available climate archives. The analytical approach used emphasized assessment of the underlying statistical distributions and spatial patterns of daily rainfall accumulations across the Tier 1.5 region of the NAME. In addition to comparing individual products against an interpolated gauge analysis, comparison between operationally gauge–corrected (RMORPH and TRMM3b42) and uncorrected (CMORPH, PERIANN and TRMM_RT) QPE products was also made. The results of our analysis support the following conclusions.
All satellite QPE products reasonably represent the continental scale (O1000 km) spatial patterns of daily precipitation in the NAM region. As with early studies by Negri et al. (1993, 1994) and Cortez–Vázquez (1999), the dominant feature of the summertime precipitation regime in southwestern North America is a broad band of increased rainfall overlying, and along the western slopes of the Sierra Madre Occidental of western México.
The magnitudes and regional spatial distributions of mean daily rainfall differed, often substantially, between the satellite QPE products and with respect to the EOL gauge composite. Uncorrected satellite products tended to overestimate daily rain rates (i.e. larger mean rates and larger maximum observed rates) across much of western México compared with gauges, while gauge–corrected products showed better agreement. Error structures, however, were not uniform over the entire domain for all products and all rainfall threshold levels. Marked differences were found in the absolute maximum daily total rainfall values.
Analysis of rainfall frequency maps, frequency histograms and conditional bias plots at various rain rate threshold levels highlight rate dependent sensitivities in the QPE products. At larger rain rate thresholds there are distinct differences in the magnitude and spatial distribution of frequency values, particularly in western México, with uncorrected QPE products exhibiting large overestimates compared to the EOL gauge composite. Gauge–corrected products, even RMORPH which contained a large number of validation gauge observations, tended to modestly underestimate the frequency of 25 and, more so, 50 mm/d rainfall events.
All satellite QPE products appear to capture the first mode of variability of daily rainfall during 2004 as diagnosed by principal components analyses. However, only the RMORPH and CMORPH products possess statistically significant correlation values with eigenvector time–series from gauges in all three leading components diagnosed here. While all products exhibit generally significant cross–correlation values across the entire domain, the PERSIANN and TRMM_RT products possessed insignificant cross–correlation values over parts of north–central and western México, which suggests a potential for improved algorithm calibration in these regions. We suspect that the lower correlation scores for PERSIANN and TRMM_RT in these regions are caused by biases in the relationship between cloud top IR radiances and rain rates as has been discussed in Hong et al. (2007) and Nesbitt et al. (2008).
All products exhibit low probability of detection values and high false alarm ratios for 25 and 50 mm/d thresholds. Ignoring RMORPH contingency scores, the TRMM3b42 product possesses modestly superior skill scores and the lowest false alarm ratios for 25 and 50 mm/d thresholds compared with the other non–corrected products.
Here we have emphasized evaluation of daily precipitation amounts as this permits the fullest set of evaluation data; more than 1300 quality controlled stations over México. Other studies have individually assessed issues related to the diurnal cycle of precipitation in this region (e.g. Hong et al., 2007a; Huffman et al., 2007; Lang et al., 2007; Nesbitt et al., 2008; Rowe et al., 2008) using a more limited number and spatial distribution of gauges. By evaluating all of these products on a consistent grid over a near–continental scale domain we aim to characterize their performance in a manner that would be useful for land data assimilation as well as regional scale model assessment, such as conducted under the NAMAP effort. The suite of spatial analyses used here (e.g. frequency maps, cross–correlation maps and principal components analyses) suggests that the leading spatial mode of precipitation variability was reasonably well represented in all products. However, it is clear that there is much discrepancy between products with regards to rainfall intensity structures. For example, although the spatial patterns and temporal correlation of precipitation estimates by CMORPH are equally as good as those from RMORPH and TRMM3b42, CMORPH suffers from a strong positive bias. The reasonable spatial characterization of rainfall pattern is promising for land data assimilation applications, but uncertainties with respect to intensity structures continue to limit the use of uncorrected products for runoff applications (e.g. flooding and water resources) and serve to alias the simulated magnitudes of land–atmosphere exchanges.
We reiterate the difficulty and uncertainties that reside in comparing surface gauge measurements with satellite–based precipitation estimates. Lack of information on sub–pixel scale rainfall variability, random errors in gauge data, and representativeness of biases in the spatial distribution of surface gauge measurements, among other issues, pervasively complicate the detailed assessment of error structures, in particular error variance structures, which, in turn, complicates assessment of the scale dependence of error (c.f. Krajewski and Smith, 2002 and references therein). Additional uncertainties, such as the role of sub–cloud evaporation and the definition of shallow cloud properties in complex terrain regions further complicate the process of attributing the causes of QPE errors. Also, since all of the QPE products utilize information sources from a variety of different remote sensing platforms (e.g. passive microwave radiances, infra–red radiances, TRMM radar and gauges) it is difficult if not impossible to fully decompose the error structures into their component data sources.
Nevertheless, the aggregate behavior of the products illustrated in this work using a suite of statistical methods points to a consistent benefit derived from performing gauge–correction of raw satellite QPE estimates in the NAM region, even if the amount of operationally–available gauge data is relatively small, as in the case of TRMM3b42. (We note that TRMM3b42, while generated continuously, currently has a latency period of approximately 1 month after real–time, thus limiting its application for operational land data assimilation.) It is speculated that insufficient sampling by operationally–available gauges results in a significant fraction of undetected events, and, when combined with potential shortcomings in gauge–correction procedures, tends to result in a modest underestimate in the frequency of rainfall events, particularly at larger thresholds (i.e. an underestimate in the spatial distribution of heavy event frequency). This behavior appears to be evident even for RMORPH which contained a significant number of stations common with the validation data set. In addition, gauge–adjustment, while leading to an improvement in overall bias, may lead to undesirable changes in the resulting probability distribution function of rain rates, leading to an underdetection of heavy rain rates.
The benefit derived from surface gauges presents several challenges for real–time quantitative precipitation estimation. In remote regions, such as western México, scientific, economic and logistical challenges exist in collecting and communicating high quality gauge measurements, particularly at sub–daily timescales. The enhancement of such networks, at least for climate monitoring purposes, has been a principal contribution of the NAME program with data from these networks contributing to an improved characterization of monsoon rainfall (e.g. Gochis et al., 2004 and 2007a; Gebremichael et al., 2007; Nesbitt et al., 2008) and the development of comparatively rich validation datasets such as that used here. These initial successes must now be used to develop a more optimal real–time precipitation observing network which can form a crucial link in data assimilation and prediction efforts. The substantial improvement in performance of TRMM3b42 and RMORPH compared to their uncorrected counterparts (CMORPH and TRMM_RT) for NAM rainfall demonstrates the value of, at least, first order bias correction. However, more sophisticated error assessment and correction methodologies such as quantile mapping or error variance mapping, proposed for weather radar by Krajewski and Smith (2002) for remotely sensed QPE, need to be more vigorously pursued. Furthermore, additional data impact studies using comparatively rich climatological networks of surface gauge observations also need to be performed to identify key gauge locations in sparse regions which are both valuable in terms of their information content and practical to maintain and access in real–time. In the meantime, progress towards meeting these objectives will require developing and sustaining intensive ground validation sites such as those proposed under the Global Precipitation Mission (details available online at: http://www.gpm.gsfc.nasa.gov/) in addition to a robust network of high quality real–time reporting event gauges.
Acknowledgements
We dedicate this work to the memory Miguel Cortez–Vázquez, whose contribution to the NAME research program was invaluable and whose wonder for the natural world was a privilege to be acquainted with. We extend thanks to Chris Watts, Jaime Garatuza–Payán and Julio César–Rodríguez and CONAGUA for supporting the NERN, to Matthias Steiner for his constructive comments in the preparation of this manuscript. The assistance of Martin Montero and Vidal Salazar in language translation is greatly appreciated. The EOL NAME composite precipitation datasets were prepared by Linda Cully, Joel Clawson, Janine Goldstein, Don Statt and Scot Loehrer of NCAR's Earth Observing Laboratory under a grant from the US National Oceanic and Atmospheric Administration (NOAA) Climate Program Office. Support for this work was provided by NOAA grants NA04OAR4310166 and NA07OAR4310214.
References
Adler R. F., J. Susskind, G. J. Huffman, D. Bolvin, E. Nelkin, A. Chang, R. Feraro, A. Gruber, P.–P. Xie, J. Janowiak, B. Rudolf, U. Schneider, S. Curtis and P. Arkin, 2003. The Version–2 Global Precipitation Climatology Project (GPCP) Monthly Precipitation Analysis (1979–present). J. Hydrometeorol. 4, 1147–1167. [ Links ] Barnes S. L., 1964. A technique for maximizing details in numerical weather map analysis. J. App. Met. 3, 396–409. [ Links ]
Cavazos T., C. Turrent and D. P. Lettenmaier, 2007. Extreme precipitation variability in the core of the North American Monsoon. Submitted to Geophys. Res. Lett. [ Links ]
Chen F., K. W. Manning, M. A. LeMone, S. B. Trier, J. G. Alfieri, R. Roberts, M. Tewari, D. Niyogi, T. W. Horst, S. P. Oncley, J. B. Basara and P. D. Blanken, 2007. Description and evaluation of the characteristics of the NCAR high–resolution land data assimilation system. J. Appl. Meteorol. Climatol. 46, 694–713. [ Links ]
Cortez–Vázquez M., 1999. Marcha anual de la actividad convectiva en México. Atmósfera 12, 101–110. [ Links ]
Cortez–Vázquez M., 2000. Intraseasonal variation of convective activity in México and Central America. Atmósfera 13, 95–108. [ Links ]
Cressman G. P., 1959. An operational objective analysis system. Mon. Wea. Rev. 87, 367–374. [ Links ]
Douglas A. V. and P. J. Englehart, 2007. A climatological perspective of transient synoptic features during NAME 2004. J. Climate 20, 1947–1954. [ Links ]
Ek M. B., K. E. Mitchell, Y. Lin, E. Rogers, P. Grunmann, V. Koren, G. Gayno and J. D. Tarpley, 2003. Implementation of Noah land surface model advances in the National Centers for Environmental Prediction operational mesoscale Eta model. J. Geophys. Res. 108, 8851, doi:10.1029/2002JD003296. [ Links ]
Gebremichael M., E. R. Vivoni, C. J. Watts, J. Garatuza–Payán and J. César–Rodríguez, 2007. Submesoscale spatiotemporal variability of North American Monsoon rainfall over complex terrain. J. Climate 20, 1751–1773. [ Links ]
Gochis D. J., J.–C. Leal, W. J. Shuttleworth, C. J. Watts and J. Garatuza–Payán, 2003. Preliminary diagnostics from a new event–based precipitation monitoring system in support of the North American Monsoon Experiment. J. Hydrometeorol. 4, 974–981. [ Links ]
Gochis D. J., A. Jiménez, C. J. Watts, J. Garatuza–Payán and W. J. Shuttleworth, 2004. Analysis of 2002 and 2003 warm–season precipitation from the North American Monsoon Experiment Event Rain gauge Network. Mon. Wea. Rev. 132, 2938–2953. [ Links ]
Gochis D. J., L. Brito–Castillo and W. J. Shuttleworth, 2006. Hydroclimatology of the North American Monsoon region in northwest México. J. Hydrol. 316, 53–70. [ Links ]
Gochis D. J., C. J. Watts, J. Garatuza–Payán and J. César–Rodríguez, 2007a. Spatial and temporal patterns of precipitation intensity as observed by the NAME event rain gauge network from 2002 to 2004. J. Climate 20, 1734–1750. [ Links ]
Gochis D. J., L. Brito–Castillo and W. J. Shuttleworth, 2007b. Correlations between sea–surface temperatures and warm season streamflow in northwest México. Int. J. Climatol. 27, 883–901. [ Links ]
Gutzler D. S., 2004. An index of interannual precipitation variability in the core of the North American monsoon region. J. Climate 17, 4473–4480. [ Links ]
Gutzler D. S., H. K. Kim, R. W. Higgins, H. M. H. Juang, M. Kanamitsu, K. Mitchell, K. Mo, P. Pegion E. Ritchie, J. K. Schemm, S. Schubert, Y. Song and R. Yang, 2005. The North American Monsoon Model Assessment Project – Integrating numerical modeling into a field–based process study. Bull. Amer. Meteorol. Soc. 86, 1423–1429. [ Links ]
Higgins R. W., Y. Yao and X. Wang, 1997. Influence of the North American Monsoon system on the U.S. summer precipitation regime. J. Climate 10, 2600–2622. [ Links ]
Higgins R.W., W. Shi, E. Yarosh and R. Joyce, 2000. Improved United States precipitation quality control system and analysis. NCEP/Climate Prediction Center Atlas 7, 40 pp. [ Links ]
Higgins R. W., A. Douglas, A. Hahmann, E. H. Berbery, D. Gutzler, J. Shuttleworth, D. Stensrud, J. Amador, R. Carbone, M. Cortez, M. Lobato, R. Meitin, J. Ropelewski, J. Schemm, S. Schubert and C. Zhang, 2003. Progress in Pan–American climate variability research: The North American Monsoon system. Atmósfera 16, 29–65. [ Links ]
Higgins R. W., D. Ahijevych, J. Amador, A. Barros, E. H. Berbery, E. Caetano, R. Carbone, P. Ciesielski, R. Cifelli, M. Cortez–Vázquez, A. Douglas, M. Douglas, G. Emmanuel, C. Fairall, D. Gochis, D. Gutzler, T. Jackson, R. Johnson, C. King, T. Lang, M.–I. Lee, D. Lettenmaier, R. Lobato, V. Magaña, J. Meitin, K. Mo, S. Nesbitt, F. Ocampo–Torres, E. Pytlak P. Rogers, S. Rutledge, J. Schemm, S. Schubert, A. White, C. Williams, A. Wood, R. Zamora, and C. Zhang, 2006. The North American Monsoon Experiment (NAME) 2004 field campaign and modeling strategy. Bull. Amer. Meteor. Soc. 87, 79–94. [ Links ]
Higgins R. W. and D. J Gochis, 2007. Synthesis of results from the North American Monsoon Experiment (NAME) process study. J. Climate 20, 1601–1607. [ Links ]
Hong Y., D. J. Gochis, J.–T. Cheng, K.–L. Hsu and S. Sorooshian, 2007a. Evaluation of PERSIANN–CCS rainfall measurement using the NAME event Rain Gauge Network. J. Hydrometeorol. 8, 469–482. [ Links ]
Hong Y., R. F. Adler and G. J. Huffman, 2007b. Satellite remote sensing for global landslide monitoring. Eos Transactions 88, 357–358. [ Links ]
Hsu K. L., X. G. Gao, S. Sorooshian and H. V. Gupta, 1997. Precipitation estimation from remotely sensed information using artificial neural networks. J. Appl. Meteorol. 36, 1176–1190. [ Links ]
Huffman G. J., R. F. Adler, M. M. Morrissey, D. T. Bolvin, S. Curtis, R. Joyce, B. McGavock and J. Susskind, 2001. Global precipitation at one–degree daily resolution from multisatellite observations. J. Hydrometeorol. 2, 36–50. [ Links ]
Huffman G. J., R. F. Adler, D. T. Bolvin, G. Gu, E. J. Nelkin, Y. Hong, D. B. Wolff, K. P. Bowman, E. F. Stocker, 2007. The TRMM multisatellite analysis (TMPA): Quasi–global multiyear, combined–sensor precipitation estimates at fine scales. J. Hydrometeorol. 8, 38–55. [ Links ]
Janowiak J. E., V. J. Dagostaro, V. E. Kousky and R. J. Joyce, 2007. An examination of precipitation in observations and model forecasts during NAME with emphasis on the diurnal cycle. J. Climate 20, 1680–1692. [ Links ]
Joyce R. J., J. E. Janowiak, P. A. Arkin and P. P. Xie, 2004. CMORPH: A method that produces global precipitation estimates from passive microwave and infrared data at high spatial and temporal resolution. J. Hydrometeorol. 5, 487–503. [ Links ]
Krajewski W. F. and J. A. Smith, 2002. Radar hydrology: rainfall estimation. Adv. Water Res. 25, 1387–1394. [ Links ]
Lang T. J., D. A. Ahijevych, S. W. Nesbitt, R. E. Carbone and S. A. Rutledge, 2007. Radar–observed characteristics of precipitating systems during NAME 2004. J. Climate, 20, 1713–1733. [ Links ]
Lobato–Sánchez R., R. W. Higgins, O. Rodríguez–López, F. Oropeza–Rosales, C. Arias–López, I. Mendoza–Uribe, W. Shi, E. Yarosh and J. Salinas, 2007. A simple rain guage network in support of NAME. Oral presentation at the 7th Meeting of the NAME Science Working Group. Information available online at: (http://galileo.imta.mx/DBNAME/). [ Links ]
Mesinger F., G. DiMego, E. Kalnay, K. Mitchell, P. C. Shafran, W. Ebisuzaki, D. Jovic, J. Woollen, E. Rogers, E. H. Berbery, M. B. Ek, Y. Fan, R. Grumbine, R. W. Higgins, H. Li, Y. Lin, G. Manikin, D. Parrish and W. Shi, 2006. North American regional reanalysis. Bull. Amer. Meteorol. Soc. 87, 343–360. [ Links ]
Mo K., 2007. Influence of soundings over México on regional analysis. Oral presentation, Joint Assembly of the American Geophysical Union and Unión Geofísica Mexicana, Acapulco, MX, May 22, 2007. [ Links ]
Negri A. J., R. F. Adler, R. A. Maddox, K. W. Howard and P. R. Keehn, 1993. A regional rainfall climatology over México and the southwest United States derived from passive and geosynchronous infrared data. J. Climate 6, 2144–2161. [ Links ]
Negri A. J., R. F. Adler, E. J. Nelkin and G. J. Huffman, 1994. Regional rainfall climatologies derived from special sensor microwave imager (SSM/I) data. Bull. Amer. Meteor. Soc. 75, 1165–1182. [ Links ]
Nesbitt S. W., D. J. Gochis and T. Lang, 2008. Characteristics of convection along the Sierra Madre Occidental observed during NAME–2004: Implications for warm season precipitation estimation in complex terrain. In press J. Hydrometeorol. [ Links ]
North G. R., T. L. Bell and R. F. Calahan, 1982. Sampling errors in the estimation of empirical orthogonal functions. Mon. Wea. Rev. 110, 699–706. [ Links ]
Rowe A. K., S. A. Rutledge, T. J. Lang, P. E. Ciesielski and S. M. Saleeby, 2008. Elevation–dependent trends in precipitation during NAME. Mon. Wea. Rev. submitted. [ Links ]
Scofield R. A. and R. J. Kuligowski, 2003. Status and outlook of operational satellite precipitation algorithms for extreme–precipitation events. Wea. Forecast. 18, 1037–1051. [ Links ]
Sibson R., 1981. A brief description of Natural Neighbor Interpolation, in Interpreting Multivariate Data. (V. Barnett, Ed.). John Wiley and Sons, New York, 21–36. [ Links ]
Sieck L. C., S. J. Burges, and M. Steiner, 2007. Challenges in obtaining reliable measurements of point rainfall. Water Res. Resear. 43, W01420, Jan 31, 2007. [ Links ]
Small E. E., 2001. The influence of soil moisture anomalies on variability of the North American monsoon system. Geophys. Res. Lett. 28, 139–142. [ Links ]
Sorooshian S., K. L. Hsu, X. Gao, H. V. Gupta, B. Imam and D. Braithwaite, 2000. Evaluation of PERSIANN system satellite–based estimates of tropical rainfall. Bull. Am. Meteorol. Soc. 81, 2035–2046. [ Links ]
Steiner M. T. L. Bell, Y. Zhang and E. F. Wood, 2003. Comparison of two methods for estimating the sampling–related uncertainty of satellite rainfall averages based on a large radar dataset. J. Climate 16 (22), 3759–3778. [ Links ]
Tustison B., D. Harris and E. Foufoula–Georgiou, 2001. Scale issues in verification of precipitation forecasts. J. Geophys. Res. 106, 11775–11784. [ Links ]
Tustison B., D. E. Foufoula–Georgiou and D. Harris, 2003. Scale–recursive estimation for multisensor quantitative precipitation forecast verification: A preliminary assessment. J. Geophys. Res. 107, 8377, doi:10.1029/2001JD001073. [ Links ]
Tymchak M. P. and R. Torres, 2007. Effects of variable rainfall intensity on the unsaturated zone response of a forested sandy hillslope. Water Resour. Res. 43, doi:10.1029/2005WR004584. [ Links ]
USGS, 2006. Hydro1k Elevation Derivative Database. Available online: http://eors.usgs.gov/products/elevation/gtopo30/hydro/index.html. [ Links ]
Vivoni E. R., H. A. Gutiérrez–Jurado, C. A. Aragón, L. A. Méndez–Barrozo, A. J. Rinehart, R. L. Wycoff, J. C. Rodríguez, C. J. Watts, J. D. Bolten, V. Lakshmi and T. J. Jackson, 2007a. Variation of hydrometeorological conditions along a topographic transect in northwestern México during the North American monsoon. J. Climate 20, 1792–1809. [ Links ]
Vivoni E. R., M. Gebremichael, C. J. Watts, R. Bindlish and T. J. Jackson, 2007b. Comparison of ground–based and remotely–sensed surface soil moisture estimates over complex terrain during SMEX04, Remote Sens. of Environ. 112, 314–325. [ Links ]
Watson D., 1992. Contouring: – A guide to the analysis and display of spatial data, Pergamon Press. ISBN 0–08–040286–0. [ Links ]
Watts C. J., R. L. Scott, J. Garatuza–Payán, J. C. Rodríguez, J. H. Prueger, W. P. Kustas and M. Douglas, 2007. Changes in vegetation condition and surface fluxes during NAME 2004. J. Climate 20, 1810–1820. [ Links ]
Williams C. R., S. W. Nesbitt, A. B. White, K. S. Gage and F. M. Ralph, 2007. Vertical structure of precipitation and related microphysics observed by NOAA profilers and TRMM during NAME 2004. J. Climate 20, 1693–1712. [ Links ]
Xie P. and P. A. Arkin, 1996. Gauge–based monthly analysis of global land precipitation from 1971 to 1994. J. Geophys. Res. 101, 19023–19034. [ Links ]

