


Services on Demand
Journal
Article
 English (pdf)
 Article in xml format
 Article references
 Send this article by e-mail
Indicators
-
 Cited by SciELO
 -
 Access statistics
Related links
-
 Similars in
SciELO
Similars in
SciELO
Share

 Permalink
Atmósfera
Print version ISSN 0187-6236
Atmósfera vol.22 n.1 Ciudad de México Jan. 2009
Ionospheric response to the phenomena occurring below and above it: a summary
D. K. SHARMA, P. K. SHARMA
Department of Applied Sciences and Humanities, Manav Rachna College of Engineering, Faridabad 121001, India
Corresponding author: D. K. Sharma; e–mail: dkphdes@rediffmail.com
R. CHAND, J. RAI
Department of Physics, Indian Institute of Technology, Roorkee 247 667
Received January 3, 2008, accepted August 8, 2008
RESUMEN
Algunas de las anomalías bien conocidas de la capa F2 pueden tener su origen en la atmósfera baja y otras pueden tener fuentes extra terrestres. Se ha sugerido que los fenómenos que ocurren bajo la ionosfera, tales como truenos, relámpagos/duendes, erupciones volcánicas y temblores, y los que ocurren arriba, como eyecciones masivas de la corona solar, erupciones solares y otros eventos extra terrestres, pueden producir efectos específicos en la capa F2. En este trabajo hemos tratado de resumir los efectos que tienen sobre las temperaturas iónica y electrónica algunos fenómenos que ocurren bajo la ionosfera como los truenos, relámpagos/duendes y la actividad sísmica y otros que ocurren sobre ella como las erupciones solares. El artículo también discute posibilidades. Las temperaturas iónica y electrónica se midieron con el RPA (por sus siglas en inglés) abordo del satélite indio SROSS–C2. Las temperaturas iónica y electrónica normales se compararon con las registradas durante el día anormal o alterado. Los datos del satélite correspondientes al periodo alterado fueron analizados de manera que otros posibles efectos fueron eliminados. Los datos utilizados son del periodo 1995–1998 en el rango de altitud 430–460 km sobre la región india. Los datos de actividad eléctrica se obtuvieron del IMD, Pune, y los detalles de los eventos de actividad sísmica durante este periodo se extrajeron del sitio de internet del USGS y de la literatura existente. Los datos de erupciones solares se obtuvieron del NGDC, Boulder, Colorado, EUA.
ABSTRACT
Some of well known F2 layer anomalies might have their origin in lower atmosphere and some have extra terrestrial sources. It has been suggested that the phenomena occurring below the ionosphere such as thunderstorms, lightning/sprites, volcanic eruptions and earthquakes and above the phenomena like corona mass ejection, solar flares and extra terrestrial events may produce F2 layer signatures. In the present paper we have tried to summarize the effect of some phenomena occurring below the ionosphere like thunderstorms, lightning/sprites and seismic activity and the phenomena such as solar flares which occur above the ionosphere, on the ionospheric electron and ion temperatures. The paper also discusses possibilities. The ionospheric electron and ion temperatures were measured by the RPA payload aboard the Indian SROSS–C2 satellite. The normal day's ion and electron temperatures have been compared to the temperatures recorded during the disturbed day. The satellite data corresponding to the disturbance period were analyzed in such way that the other possible effects were eliminated. The data used are from the period 1995–1998 in the altitude range 430–630 km over the Indian region. The data of thunderstorms activity have been obtained from IMD, Pune and details of seismic events during this period downloaded from the USGS website and existing literature. The data of solar flares have been obtained from NGDC, Boulder, Colorado, USA.
Keywords: Ionospheric temperatures, F2 region, thunderstorms, seismic activity, solar flares.
1. Introduction
The ionospheric temperatures and density are very sensitive to the phenomena occurring above and below it. The ionospheric temperatures and density variation due to solar flare, geomagnetic storm, thunderstorms, lightning/sprites, seismic activity, etc. have been studied by various workers (Rai et al., 1972; Inan et al., 1991; Taranenko et al., 1992; Depuev and Zelenova, 1996; Schunk and Sojka, 1996; Molchanov et al., 1998; Molchanov and Hayakawa, 1998; Ondoh, 1998; Liu et al., 2000, 2004; Sharma et al., 2003a, 2004a, 2004b, 2004c, 2005, etc.). The above phenomena play an important role in changing the ionospheric parameters in F2 region. The ionospheric temperatures also show variation associated with day–length, season, latitude, longitude, altitude and with the 11–year solar cycle (Mahajan et al., 1983; Oyama et al., 1996; Richards, 2001; Sharma et al., 2003b). The change in ionospheric temperatures may affect the radio communication, navigation, exploration of near earth space, and electronic systems in satellites and spacecrafts. A review of the effect on the ionosphere due to phenomena occurring below it is given by Kazimirovsky et al. (2003). Therefore, understanding, monitoring and forecasting the change of ionospheric temperatures due to the phenomena occurring below and above the ionosphere is important.
In recent years sprites have been observed as atmospheric phenomena and are formed by massive but weak luminous flashes that appear directly above an active thunderstorm system (Sentman and Wescott, 1993; Sentman et al., 1995). They are coincident with cloud–to–ground or intracloud lightning strokes and their spatial structures range from small single or multiple vertically elongated spots, to bright groupings, that extend from the cloud tops up to about 95 km. Sprites are predominantly red. The brightest region lies in the altitude range from 65 to 75 km, above which there is often a faint red glow or wispy structure that extends to about 90 km. Below the bright red region, blue tendril–like filamentary structures often extend downward to as low as 40 km. Sprites rarely appear singly, usually occurring in clusters of two, three or more. Some of the very large events seem to be tightly packed clusters of many individual sprites. Other events are more loosely packed and may extend across horizontal distances of 50 km or more and occupy atmospheric volumes in excess of 10,000 cubic km. Blue jets are a second high altitude optical phenomenon distinct from sprites that are observed above thunderstorms. As their name implies, blue jets are optical ejections from the top of the electrically active core regions of thunderstorms. Following their emergence from the top of the thundercloud, they typically propagate upward in narrow cones of about 15 degrees full width at vertical speeds of roughly 100 km/s, fanning out and disappearing at heights of about 45 km (Wescott et al., 1995). The plasma temperature at low and mid latitudes is mainly sensitive to three physical processes, namely the electron heating by photoelectrons, electron cooling by heat transfer to the colder ion and neutrals, and heat transport due to thermal conduction. The sprites associated with active thunderstorm may affect the electric field, conductivity and the temperature of the stratosphere, mesosphere and ionospheric regions (Otsuyama et al., 1999). Many researchers (Taranenko et al.,1992; Pasko et al., 1995; Wiscott et al., 1996; Yukhimuk et al., 1998; Eack et al., 2000; Singh et al., 2001) have extensively studied the effect of sprites on ionosphere.
From last several decades a connection between earthquakes and ionosphere has been proposed. Many hypotheses have been suggested but could not success as the earthquake precursory to reduce the hazard of life and property. The thermal fluctuations in the ionosphere related to the prediction of earthquakes and volcanic eruptions remain largely an unsolved problem. A large number of earthquakes occur on the Earth each year and ~100–120 of them with magnitude > 5 in different regions of the world are extremely hazardous for the inhabitants of our planet. The ionospheric anomalies due to the seismic activity appearing before few hours or days have been studied (Datchenko et al., 1972; Kim et al., 1994; Koshevaya et al., 1997; Zaslavski et al., 1998; Liu et al., 2000, 2004; Silina et al., 2001; Pulinets, 1998a, b, 2004; Pulinets et al., 2003; etc.).
Pulinets and Boyarchuk (2004) have written a decent book on 'ionospheric precursors of earthquakes'. In this book, they explain the variations of near–Earth plasma observed over seismically active areas several days/hours before strong seismic shocks. It demonstrates that the seismo–ionospheric coupling is part of the global electric circuit and the anomalous electric field appearing in active seismic areas is the main carrier of information from the earth into the ionosphere. The discussion of physical mechanisms is based on experimental data. The book proceeds to describe existing complex systems of space–born and ground–based monitoring for electromagnetic and ionospheric precursors of earthquakes, as well as those still under construction.
Koshevaya et al. (1997) have studied the connection mechanism between the lithosphere and the ionosphere. They have found macroscopic changes of the ionospheric parameters prior to the occurrence of earthquake above the epicenter at altitudes from about 400 to about 1000 km in the ionosphere. Zaslavski et al. (1998) concluded that in some cases the electron density in the F region increases in the localized epicenter zone whereas in other cases it has decreased. These effects are generally small in size and nearly masked by other ionospheric disturbances. Their small magnitude diminishes their capability to become a real seismic precursor.
A review of electromagnetic phenomena associated with earthquakes in terrestrial electromagnetic noise environment was also presented by Hayakawa (2004). Molchanov and Hayakawa (1998) analyzed the 10 major earthquakes related electromagnetic signals. They found that the ionospheric effect was a transient oscillation with a 5 to 10 day period, which is initiated a few days before a large earthquake and decays over a few days to weeks after it. They concluded that this phenomenon could be understood in terms of long period gravity waves generated during the earthquakes and their intensification in the ionosphere as they propagate upward. Rikitake (1976) also concluded that the low period gravity waves generated at the epicenter may propagate to ionospheric height. Emission and propagation of electromagnetic radiations, ULF, ELF and VLF from earthquake epicenter were reported by several authors (Gokhberg et al., 1982; Yamada et al., 1989; Shalimov and Gokhberg, 1998; Hayakawa et al., 1996; Fujinawa and Takahashi, 1998; Kawate et al., 1998). These waves may create localized Joule heating in the ionosphere.
The effect of solar flare on total electron content (TEC) have been studied by various workers (Hanssen and Emsile, 1988; Anastasiadis, 1999; Charikov, 2000; Kudryashev and Avakyan, 2000; Avakyan, 2001; Afraimovich et al., 2001) using GPS and satellite data. Afraimovich et al. (2001) have used the GPS network data to study the effect of solar flares of September 23, 1998 and July 29, 1999. They found that the fluctuation of TEC and its time derivative by removing the linear trend of TEC with a time window at about 5 min are coherent for all stations on the dayside earth and no such effect of solar flares was detected on the nightside of the earth's ionosphere. The effect of solar flares on the ionospheric F region has also been studied (Mendillo et al., 1974; Mitra, 1974) by VHF radio beacons experiment on geo–stationary satellite and the TEC enhancement was noticed. Global observation of the flares of August 7, 1972 using 17 stations in North America, Europe and Africa (Mendillo et al., 1974) revealed that the TEC was increased by 15–30% during the solar flares. The low latitudes showed a larger increase of TEC compared with the high latitude. Some events of solar flares have also been studied by Kanellakos et al. (1962) to see the effect on E and F regions of the ionosphere and it has been found that the electron density was enhanced at these heights. Thome and Wagner (1971) theoretically studied the effect of solar flares on electron density and found that the electron density is enhanced in E and F regions of the ionosphere. Thus various experimental and theoretical studies on the effect of solar flares on TEC have been done and can be found in existing literature. However, no study to the authors' knowledge is reported for the ionospheric temperature behavior during solar flares in F2 region.
In the low and mid latitude ionosphere, solar activities are the main source of energy; this influences both the natural gas temperature and winds, and hence is related to the ionospheric temperatures (Suhasini et al., 2001). Care has been taken in the selection of events to take into account the low solar activity (mean sunspot number is 13.9) for the analysis.
In the present paper ionospheric electron and ion temperatures data have been analyzed to study the ionospheric electron and ion temperatures anomalies due to the phenomena below and above the ionosphere in the F2 ionosphere region. The ionospheric electron and ion temperatures data were carefully analyzed to avoid masking by other possible sources and have also been compared to estimated values by the International Reference Ionosphere (IRI–95).
2. Experimental data collection and analysis
The electron and ion temperatures in the topside ionosphere have been measured with the help of in–situ Retarded Potential Analyzer (RPA) payload aboard the Stretched Rohini Series Satellite (SROSS–C2), which was launched by Indian Space Research Organization (ISRO) on May 4, 1994 to study the ionospheric composition and temperature anomalies. The SROSS–C2 satellite was launched with the help of ASLV–D4 rocket in the orbit 930 × 430 km altitude with a 46° inclination to the equatorial plane. After two months of its operation the satellite orbit was bought down to 630 × 430 km altitude. It was successfully operated continuously for seven years and on July 12, 2001 re–entered to atmosphere. The SROSS–C2 satellite was the fourth satellite of Stretched Rohini Series Satellite programme of ISRO and it was designed, developed, fabricated and tested in the ISRO satellite center (ISAC) of Bangalore. The weight of this satellite was 114 kg, which carried 6 kg hydrazine fuel and generated 50 watt onboard power. The velocity of the satellite was 7.8 km/s. It covered the geographic latitude belt of 31° S to 34° N and the longitude range 40° E to 100° E. It was a spin–stabilized satellite with its spin axis perpendicular to its longitudinal axis and the rate of spin was 5 revolutions per minute (rpm). The satellite moved in the orbit keeping the spin axis perpendicular to the orbital plane. In this kind of orbital motion RPA sensors face the velocity vector once in each spin cycle of the satellite. The angle between the sensor normal and satellite velocity vector keeps on changing from 0 to 360° at the rate of 30° per second.
For the present study only those solar flare events which are free from thunderstorm activity were selected. For its verification we have used the data on thunderstorm obtained from India Meteorological Department (IMD), Pune (India). The IMD covers the area bounded by 40 to 100° E only. Further, the SROSS–C2 satellite recordings were also confined to the region 31° S to 34° N in latitude and 40 to 100° E in longitude.
The RPA payload consists of two sensors, viz. electron and ion sensors and associated electronics (Garg and Das, 1995). In addition, a spherical Langmuir probe is included and used as a potential probe for estimating the variation of spacecraft potential during spinning of the satellite. The electron and ion sensors both have planar geometry and consist of multi–grid Faraday cups with a collector electrode (Garg and Das, 1995). The different grids in the sensor are designated as the entrance grid, the retarding grid, the suppressor grid and the screen grid. These grids are made of gold–plated tungsten wire mesh with 90–95% optical transparency. The electron and ion RPA are used for in–situ measurements of ionospheric electron and ion temperatures. These sensors are mechanically identical and mounted on the top deck moved in the cartwheel mode perpendicular to the spin axis of the spacecraft and collected data within 30° (for ions) and within 90° (for electrons) of the satellite vector. Both sensors have different grid applied voltages suitable for the collection of electrons and ions, respectively. The charged particles whose energies are greater than the applied voltage on the retarding grid pass through various grids and finally reach the collector electrode to cause the sensor current. This current is measured by a linear auto–gain ranging electrometer, which is translated into electron and ion temperatures. The data are transmitted to the ground station in a digital format at 8 kbps. The data are sampled at every 22 ms by the sensor aboard the satellite moving with a velocity of 7.8 km/s. The RPA experiment is switched on only during the satellite visibility over the ground station at Bangalore (12.6° N, 77.3° E).
The electron and ion temperatures data recorded by RPA payload aboard the Indian SROSS–C2 satellite during the period from January 1995 to December 1998 were used for this purpose. The data on thunderstorms activity have been obtained from India Meteorological Department (IMD) Pune and data on solar flares for the same period from National Geophysical Data Center (NGDC), Boulder, Colorado, USA. The data of earthquakes were downloaded from United States Geological Survey (USGS) website during the period from January 1995 to December 1998. The International Reference Ionosphere (IRI–95) model data for the same period were downloaded from the Internet and used for the purpose of comparison. In the subsequent part of the paper the IRI–95 model will be referred as IRI model.
The IRI is an international project sponsored by the Committee on Space Research (COSPAR) and the International Union on Radio Science (URSI). The IRI describes the median or average value of electron density, ionospheric temperatures (electron, ion and neutrals temperatures) and ion composition as a function of height, location, local time and sunspot number for magnetically quite conditions. It is an empirical model based on the data from the worldwide network of ionosonde stations, incoherent scatter radar and Alouette topside sounders and in situ measurements by several satellites and rockets. The model does not include any effect such as solar flares, seasonal, diurnal and day–to–day change, etc.
It is a difficult task to study the ionospheric response to the phenomena occurring below and above it using the satellite data because the passes of satellite rarely match the particular events (active thunderstorms region, earthquake epicenter and solar flares). The first task was to select the satellite data corresponding to the particular events recorded during the period from January 1995 to December 1998. The recorded average electron and ion temperatures during particular events have been compared with average normal day's electron and ion temperatures for the same time interval. The electron and ion temperatures data were analyzed in such a way that the perturbation due to diurnal, seasonal, latitudinal, longitudinal and altitudinal effects are negligible. The average of normal days electron and ion temperatures were calculated for a month, which includes 20 days pre– and post– particular events leaving the 10 days of events duration. Pre– and post– event 5 days data are assumed to be affected by the events. One season data has been included for each event, therefore, the possibility of seasonal effect has been ruled out. A 5° window around the geographic location of the events (such as thunderstorm and seismic activity) has been selected to minimize the latitudinal and longitudinal effects. To calculate the normal day electron temperature only event time duration data have been used to avoid any perturbation due to diurnal effect. All data corresponds to the altitude range from 430 to 630 km. The average altitude from the geographic location to satellite recording is about 500 km. The temperature variation due to altitude is negligible in the present study. All the temperature data recorded by the SROSS–C2 satellite are within the error limit of ±50 K in the temperature range 500 K to 5000 K (Garg and Das, 1995; Sharma et al., 2004a). The maximum error limit of ±50 K is applicable to all data presented in this paper.
3. Results and discussion
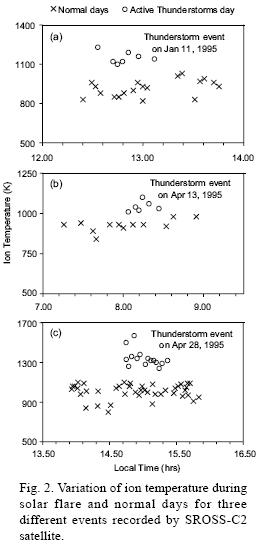
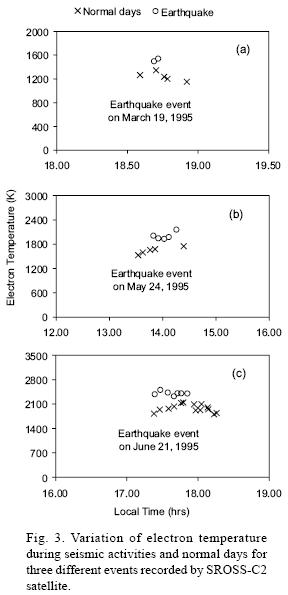
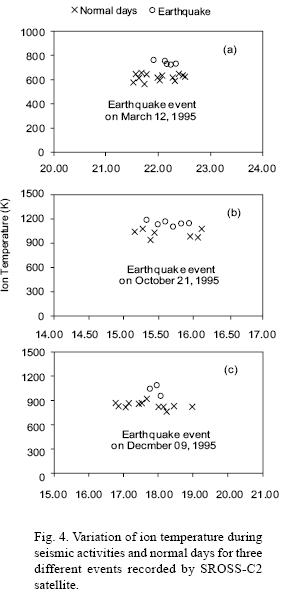
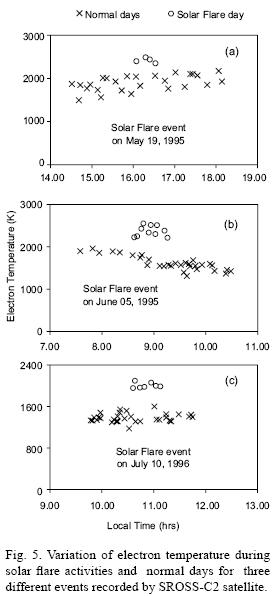
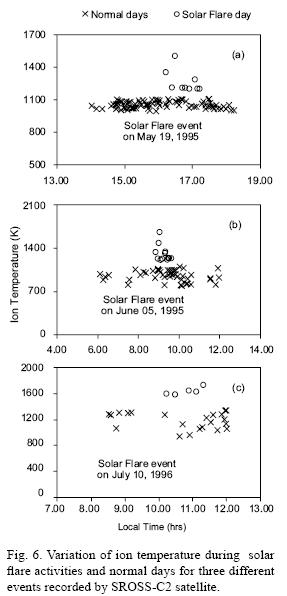
To study the ionospheric electron and ion temperatures variation during the phenomena occurring below and above the ionosphere, a total of 44 events have been identified from January 1995 to December 1998 over the Indian region. To improve the presentation quality we have reduced the number of representing figures. We are presenting here the figures for thunderstorms, seismic events and solar flares (events are shown in respective tables) that correspond to the first three entries mentioned in the respective tables. During the thunderstorms and normal day the recorded electron and ion temperatures are shown in Figures 1(a, b, c) and 2 (a, b, c), respectively. For the seismic events the electron and ion temperatures are shown in Figures 3 (a, b, c) and 4 (a, b, c), respectively. Similarly the electron and ion temperatures recorded during the solar flares are shown in Figures 5 (a, b, c) and 6 (a, b, c) respectively. In figures the interval of anomalous temperature registration is related to the phenomena considered.
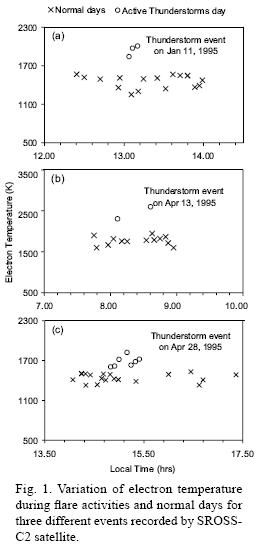
3.1 Ionospheric response to thunderstorms
The data collected by SROSS–C2 satellite using RPA payload during the period from 1995–1998 has been analyzed for anomalous variations due to thunderstorm activity in the altitude range from 430–630 km. The measurements corresponding to three different locations, viz. Bhopal (23.16° N, 77.36° E), Panji (15.30° N, 73.55° E) and Trivandrum (08.29° N, 76.59° E) have been analyzed. During the period from 1995 to 1998, it has been found that seven events of thunderstorms correspond to the satellite data, i. e. three events correspond to Bhopal, three to Trivandrum and one to Panji. These seven events are free from the other anomalies (solar flares and seismic activities), which have been verified by the obtained data. The recorded average electron and ion temperatures during active thunderstorms have been compared with the normal days average electron and ion temperatures for the same time interval.
As mentioned above it is a difficult task to study the ionospheric temperatures using the satellite data in respect of thunderstorm activity because it very rarely passes of satellite match the thunderstorm activity at a meteorological data station. The first task is to match the satellite data corresponding to the thunderstorm activities. Only those thunderstorm events, which are free from the solar flares and also free from earthquakes have been considered in this study.
The present study has a limitation in the sense that only seven thunderstorm days have been found to correspond with the satellite passes. On many occasions during its passes above the thunderstorm, the sensors could not record the electron and ion temperatures.
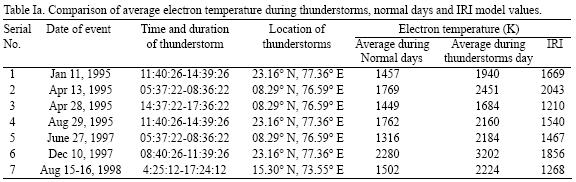
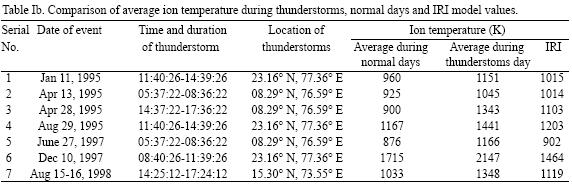
In 1995 two events recorded correspond to Bhopal and two to Trivandrum. At Bhopal, there were thunderstorms on January 11 and August 29, 1995. During these events the average electron temperature was enhanced by 1.2 to 1.3 times over the normal day average electron temperature. However, at Trivandrum it was enhanced by 1.2 to 1.4 times during the active thunderstorms on April 13 and 28, 1995 over the normal days. As well, the average ion temperature at Bhopal was enhanced by 1.2 times for both events and at Trivandrum it was enhanced by 1.1 to 1.5 times during the thunderstorm activities.
Two events were recorded in 1997, one corresponding to Trivandrum on June 27 and another to Bhopal on December 10. At Trivandrum, the average electron temperature was enhanced by 1.7 times and at Bhopal it was enhanced by 1.4 times during the active thunderstorms as compared to the normal days. The average ion temperature was enhanced by 1.3 times to that of normal days temperature at both locations. In 1998, one event has been found at Panji. There were two active thunderstorms recorded during two consecutive days (August 15 and 16) at the same time. The average electron temperature was enhanced by 1.5 times and the average ion temperature by 1.3 times to that of normal day's temperature. The average electron and ion temperatures during thunderstorm, normal days and values estimated by IRI model for all seven events are shown in Table I (a, b), respectively. The table also shows the time, duration and location of thunderstorm activities.
The enhancements in ionospheric electron and ion temperatures have been attributed to different kind of lightning activity, which are associated with active thunderstorms. Recent observation of optical phenomena such as sprites, blue jets, blue starters, elves and associated phenomena (Taranenko et al., 1992; Pasko et al., 1996, 1997; Bell et al., 1995; Sentman et al., 1995; Lehtimen et al., 1996, 2000) propagating from top of the active thunderstorm may generate radiations from ULF to VLF (Inan et al., 1991, 1996; Otsuyama et al., 1999), which in turn, may propagate still upward and heat the local plasma in the ionosphere. This is only a possibility proposed by the authors.
3.2 Ionospheric response to seismic activity
The data collected by SROSS–C2 satellite using RPA payload during the period from January 1995 to December 1996 were used to analyze the anomalous variations in the ionospheric electron and ion temperatures due to earthquake events in the same altitude range.
It is also a difficult task to study the ionospheric electron and ion temperatures using the satellite data in respect of earthquake events because the passes of satellite rarely match the epicenter zone of seismic events. The recorded average electron and ion temperatures during seismic activity have been compared with average normal day's electron temperature for the same time interval. The electron temperature data were analyzed in such a way as that for thunderstorm events. Many workers have suggested that the seismogenic electric fields are released few hours to few days before and until the occurrence of an earthquake (Koshevaya et al., 1997). Pulinets (2004) has suggested that the ionospheric concentration gradually started to diminish 5 days before the seismic shock. After the main seismic shock the possibility to generate the seismogenic field duration is not defined in literature. Therefore, in the present analysis it is considered that pre– and post– 5 days data are influenced by seismogenic effects. In order to avoid the masking of electron and ion temperatures perturbation due to solar flares and thunderstorms only earthquake events, which are free from the other anomalies have been considered in this study. On March 19, 1995 an earthquake with an epicenter location at 9.88° N and 92.90° E has been recorded. During this event the average electron temperature was enhanced by 1.2 times over the normal days average electron temperature as estimated from the data. On May 24, 1995 and June 21, 1995 the earthquakes of magnitude 4.6 and 4.7 respectively, were recorded at different locations (16.52° N, 79.68° E; 21.78° N, 85.33° E). The electron temperature enhancements during both events were almost similar as that of March 19, 1995.
Three events were recorded in 1996, on January 18, September 25, and October 8, with a magnitude of 4.2, 5.0 and 4.2 respectively. During the event of January 18, 1996 the average electron temperature was enhanced 1.5 times over the normal day's average electron temperature, as estimated from the data. On September 25, 1996 and October 8, 1996 the enhancements in average electron temperature were 1.4 and 1.3 times respectively, compared to the normal days average electron temperature. The magnitude and location of earthquake events along with the quantitative values of the temperatures anomalies during the occurrence of the earthquakes are given in Table IIa. Similar enhancements have been found for the ion temperature during the seismic events over the normal days ion temperature for all nine events. The resultant values of ion temperature during seismic events and normal days along with the details of the seismic events are shown in Table IIb. The tables also show the values estimated by IRI model.
The possible physical mechanism of the enhancement in ionospheric temperatures is discussed by Pulinets (1998b), which is also supported by experimental evidence. The main source of atmospheric–ionospheric coupling over the epicenter zone is the emanation of different chemical substances like radon, light gases and submicron aerosols from earth (Alekseev and Alekseeva, 1992). They change the electrodynamics properties of atmosphere over the epicenter zone. The vertical atmospheric electric field changes due to an electrode effect near ground layer of atmosphere have been observed by Hoppel (1967). In the presence of aerosols the electrode effect enhanced the electric field of up to several kV/m (Boyarchuk et al., 1997; Vershinin et al., 1997). These vertical fields penetrate into the ionosphere where, due to anisotropic conductivity of ionosphere they transform into horizontal fields (Kim et al., 1994). The Joule heating plays an important role in the enhancement of ionospheric temperature. The seismogenic electric field within the ionosphere is modulated by daily variations of plasmaspheric electric fields that cause the daily variations of the sign of seismo–ionospheric variations (Pulinets et al., 1998). The detailed theoretical calculations and further experimental observations strengthen the hypothesis of temperature enhancement due to earthquake over the epicenter zone of ionospheric region, which may be developed as a short term precursor in future.
3.3 Effect of solar flares on ionospheric temperatures
A flare is defined as a sudden, rapid and intense variation in the brightness of sun. A flare occurs when magnetic energy that has built up in the solar atmosphere is suddenly released (Carrington, 1860). Radiations are emitted across virtually the entire electromagnetic spectrum, from radio waves at long wavelengths through the optical emissions and X–rays to γ–rays at short wavelengths. During the solar flares, magnetic energy of 1029 to 1033 ergs is released by means of magnetic reconnection (Anastasiadis, 1999). The energy released during a solar flare is used in intense localized heating, particle acceleration and in mass flows (Priest, 1992).
During the period from January 1995 to December 1998, we have identified a total of five solar flare events on the dayside of earth, which correspond to the locations at Bhopal, Panji and Pune over India. These stations were chosen on the basis of maximum passes of SROSS–C2 satellite and also for having meteorological data.
The effect of two solar flare events (May 19, 1995 and July 10, 1996) corresponding to the meteorological station at Panji are shown in Figures 5 (a, c) and 6 (a, c) for electron and ion temperatures respectively. The enhancement in the average electron temperature for these events was 1.3 to 1.5 times and for ion temperature it was 1.2 to 1.4 times over the normal days temperatures. Two solar flares events corresponding to the meteorological station at Pune were identified on June 5, 1995 and December 28, 1998. The enhancement in the average electron temperature for these events was 1.5 to 1.8 times and for ion temperature it was 1.3 to 1.4 times over the normal days. A flare event appeared on November 9, 1998 has been analyzed for the meteorological station at Bhopal in India. The enhancements in the electron temperature were 1.9 times over the normal days average electron temperature. However, the ion temperature enhancement during the event was 1.2 times over the normal days temperature. The average electron and ion temperatures during solar flares, normal days and values estimated by IRI model for all seven events are shown in Table III (a, b) respectively. The table also shows the time, duration and location of solar flares.
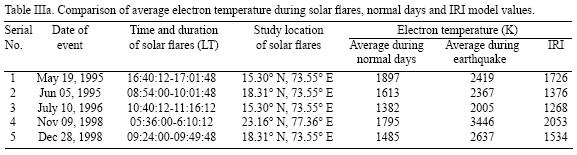
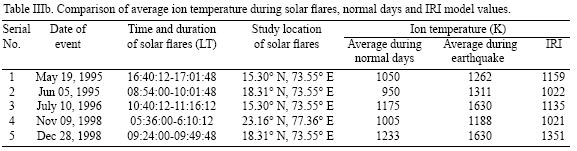
All temperature data recorded by SROSS–C2 satellite are within the error limit of ± 50 K for the temperatures range of 500–5000 K. Therefore, the variation in the electron and ion temperatures measured by SROSS–C2 satellite during the flare time can be interpreted as the ionospheric temperature response to the solar flares. These enhancements have been found on the dayside of the earth's ionosphere. To see the effect of solar flares on nightside earth's ionosphere we have also studied two events at Chennai (13.04° N, 80.17° E) and at Panji in India. At Chennai the SROSS–C2 data was available for the solar flare event of February 2, 1997 (18:57:41–21:20:41 LT) and at Panji on May 4, 1998 (21:44:12–22:24:12 LT). The local time for both solar flares over India was night hours. The temperature variation recorded for these events fall within the error limit of the normal temperatures. Hence it may be concluded that the solar flares do not show any measurable effect on the ionospheric temperature on the night side of earth's ionosphere. Afraimovich et al. (2001) also concluded that the solar flares do not have any effect on the night side earth's ionosphere. The enhancement in ionospheric temperature is mainly due to high energy X–rays and ultraviolet radiation produced during the solar flares (Donnelly, 1976; Charikov, 2000; Kocharov et al., 2000). These high–energy radiations reach to the earth's ionosphere and heat the plasma.
All the flares events selected for the present study fall in the category of subflare. The area covered by a great flare may be as large as 109 km2, and an area smaller than about 3 ×10⁸ km2 is known as subflare (Hanssen and Emslie, 1988). The events studied had nearly the same area, and brilliancy is faint on a three level scale. The intensity of a subflare is approximately 5sfu (solar flux unit).
4. Conclusions
The SROSS–C2 data have been analyzed to study the ionospheric electron and ion temperatures anomalies in F2 region due to thunderstorms, earthquakes and solar flares events. The above analysis shows that there is a consistent enhancement of ionospheric electron and ion temperatures recorded during active thunderstorms period. This enhancement was for the average electron temperature ranging from 1.2 to 1.7 times compared to the average normal day's temperature. However, for ion temperature this enhancement was from 1.1 to 1.5 times. It is worth mentioning here that in the above analysis the data were selected in such way that the effect of diurnal, seasonal, latitudinal, longitudinal and altitudinal effects were minimized. Thus the temperature anomalies are directly related to the thunderstorm events.
It has also been found that the average electron temperature is enhanced during the occurrence of earthquakes by 1.2 to 1.5 times and this enhancement was for ion temperature ranging from 1.1 to 1.3 times over the normal day's average temperatures. Similar enhancements of the ionospheric electron and ion temperatures have been recorded during solar flares. This enhancement for the average electron temperature varies from 1.3 to 1.9 times to the normal days average temperature. However, for ion temperature it ranged from 1.2 to 1.4 times the normal days average temperature. The data selection and analysis discussed in the previous section, shows that the enhancements of ionospheric electron and ion temperatures during the solar flares are the response to the solar flare. No measurable enhancement in electron and ion temperatures has been found during the night hours.
Acknowledgements
One of the Authors (DKS) is thankful to Prof. B. B. Bansal, Director–Principal, Manav Rachna College of Engineering, MRCE, Faridabad and Dr. Meenakashi, Head, Department of Applied Sciences and Humanities, MRCE, Faridabad for providing the necessary facilities. The authors are thankful to the United States Geological Survey (USGS) team for providing the information of seismic activity on Internet website and thanks also to NGDC, Boulder, Colorado, USA and IMD, Pune, India for providing the necessary data.
References
Afraimovich E. L., A. T. Altyntsev, E. A. Kosogorov, N. S. Larina and L. A. Leonovich, 2001. Ionospheric effects of the solar flares of September 23, 1998 and July 29, 1999 as deduced from GPS network data. J. Atm. Solar–Terr. Phys. 63, 1841. [ Links ]
Alekseev V. A. and N. G. Alekseeva, 1992. Investigation of metal transfer in the biosphere during gaseous emission in zones of tectonic activity using methods of nuclear physics. Nucl. Geophys. 6, 99. [ Links ]
Anastasiadis A., 1999. Electron acceleration in solar flares by spatially random DC electric fields. Phys. Chem. Earth (C), 24, 269. [ Links ]
Avakyan S. V., 2001. Some purposes and methods of the satellite measurements of the ignorospheric response on the solar flares. Phys. Chem. Earth (C), 26, 259. [ Links ]
Bell T. F., V. P. Pasko and U. S. Inan, 1995. Runaway electron as a source of red sprites in the mesosphere. Geophys Res. Lett. 22, 2127–2130. [ Links ]
Boyarchuk K.A., A. M. Lomonosov and S. A. Pulinets, 1997. Electrode effect–earthquakes precursor, BRAS Physics/Supplement Physics of Vibrations 61, 84. [ Links ]
Carrington R. C., 1860. Description of a singular appearance seen in the sun on September 1, 1859. Monthly Notice of the Royal Astronomical Society 20, 3. [ Links ]
Charikov Y. E., 2000. X–ray precursors in solar flares. Phys. Chem. Earth (C), 25, 407. [ Links ]
Datchenko E. A., V. I. Ulomov and C. P. Chernyshova, 1972. Electron density anomalies as the possible precursor of Tashkent earthquake. Dokl. Uzbck. Acad. Sci. 12, 30–32. [ Links ]
Depuev V. and T. Zelenova, 1996. Electron density profile changes in a pre–earthquake period. Adv. Space Res. 18, 115–118. [ Links ]
Donnelly R. F., 1976. Empirical models of solar flare X–rays and EUV emission for use in studying their E and F region effects. J. Geophys. Res. 81, 4745. [ Links ]
Eack K. B., D. M. Suszcynsky, H. B. William, R. A. Roussel–Dupre and E. M. D. Symbalisity, 2000. Gamma–ray emissions observed in a thunderstorm anvil. Geophys. Res. Lett. 2, 185–188. [ Links ]
Fujinawa Y. and K. Takahashi, 1998. Electromagnetic radiations associated with major earthquakes. Phys. Earth. Planet. In. 105, 249–259. [ Links ]
Garg S. C. and U. N. Das, 1995. Aeronomy experiment on SROSS–C2. J. Spacecraft Tech. 5, 11–15. [ Links ]
Gokhberg M. B., V. A. Morgounov, T. Yoshino and I. Tomizawa, 1982. Experimental measurement of electromagnetic emissions possible related to earthquakes in Japan. J. Geophys. Res. 87, 7884–7888. [ Links ]
Hanssen E. T. and A. G. Emslie, 1988. The physics of solar flares. Cambridge University Press, UK, pp 7–8. [ Links ]
Hayakawa M., R. Kawate, O.A. Molchanov and K. Yumoto, 1996. Results of ultra–low–frequency magnetic field measurements during the Guam earthquake of August 8, 1993. Geophys. Res. Lett. 23, 241–244. [ Links ]
Hayakawa M., 2004. Electromagnetic phenomena associated with earthquakes: A frontier in terrestrial electromagnetic noise environment. Recent Res. Devel. Geophys. 6, 81–112. [ Links ]
Hoppel W. A., 1967. Theory of electrode effect. J. Atm. Terr. Phys. 29, 709. [ Links ]
Inan, U. S., T. F. Bell and J. V. Rodríguez, 1991. Heating and ionization of the lower ionosphere by lightning, Geophys. Res. Lett. 18, 705–708. [ Links ]
Inan U. S., V. P. Pasko and T. F. Bell, 1996. Sustained heating of the ionosphere above thunderstorms as evidenced in "early/fast" VLF events. Geophys. Res. Lett. 23, 1067–1070. [ Links ]
Kanellakos D. P., K. L. Chan and O. G. Villard, 1962. On the altitude at which some solar flare induced ionization is released. J. Geophys. Res. 67, 5. [ Links ]
Kawate R., O.A. Molchanov and M. Hayakawa, 1998. Ultra–low–frequency magnetic fields during the Guam earthquake of 8 August 1993 and their interpretation. Phys. Earth Planet. In. 105, 229–238. [ Links ]
Kazimirovsky E., M. Herraiz and B. A. Delamoena, 2003. Effect on the ionosphere due to phenomena occurring below it. Surv. Geophys. 24, 139–184. [ Links ]
Kim V. P., V.V. Hegai and P.V. Illich–Svitych, 1994. On the possible precursor of earthquakes. Fizika Zemli, 3, 37. [ Links ]
Kocharov G. E., Y. E. Charikov, V. P. Lazutkov, G. A. Matveev, Y. N. Nitsora, M. I. Savchenko and D. V. Skorodumov, 2000. Soft X–rays in the 00:18 UT solar flare on April 22, 1994, Phys. Chem. Earth PT. (C) 25, 405. [ Links ]
Koshevaya S., R. Pérez–Enríquez and N. Y. Kotsarenko, 1997. The detection of electromagnetic processes in the ionosphere caused by the seismic activity. Geofís. Int. 36, 1–9. [ Links ]
Kudryashev G. S. and S. V. Avakyan, 2000. Ionization and excitation of the upper atmosphere during solar flares. Phys. Chem. Earth PT. (C) 25, 511. [ Links ]
Lehtinen N. G., M. Walt, U. S. Inan, T. F. Bell and V. P. Pasko, 1996. γ–ray emission produced by a relativistic beam of runaway electrons accelerated by quasi–electrostatic thundercloud fields. Geophys. Res. Lett. 23, 2645–2648. [ Links ]
Lehtinen N. G., U. S. Inan and T. F. Bell, 2000. Trapped energetic electron curtains produced by thunderstorm driven relativistic runaway electron. Geophys. Res. Lett. 27, 1095–1098. [ Links ]
Liu J. Y., Y. I. Chen, S.A. Pulinets, Y. B. Tsai and Y. J. Chuo, 2000. Seismo–ionospheric signatures prior to M > 6.0 Taiwan earthquakes. Geophys. Res. Lett., 27, 3113–3116. [ Links ]
Liu J. Y., Y. J. Chuo, S. J. Shan, Y. B. Tsai, Y. I. Chen, S. A. Pulinets and S. B. Yu, 2004. Pre–earthquake ionospheric anomalies registered by continuous GPS TEC measurements. Annales Geophysicae, 22, 1585–1593. [ Links ]
Mahajan K. K., V. K. Panday and V. C. Jain, 1983. Relationship between electron density and electron temperature as a function of solar activity. Adv. Space. Res. 2, 247. [ Links ]
Mendillo M., J. A. Klobuchar, R. B. Fritz, A. V. Darosa, L. Kersley, K. C. Yeh, B. J. Flaherty, S. Rangaswamy, J. R. Schmid, J. V. Evans, J. P. Schodel, D. A. Matsoukas, J. R. Koster, A. R. Webster and P. Chin, 1974. Behavior of the ionospheric F– region during the great solar flare of August 7, 1972. J. Geophys. Res. 79, 665. [ Links ]
Mitra A. P., 1974. Ionospheric effect of solar flares. D. Reidel, Norwell, MA, 249 pp. [ Links ]
Molchanov O.A. and M. Hayakawa, 1998. On the generation mechanism of ULF seismogenic electromagnetic emissions. Phys. Earth Planet. In. 105, 201–210. [ Links ]
Molchanov O. A., M. Hayakawa, T. Ondoh and E. Kawai, 1998. Precursory effects in the subionospheric VLF signals for the Kobe earthquake. Phys. Earth Planet. In. 105, 239–248. [ Links ]
Ondoh T., 1998. Ionospheric disturbances associated with great earthquake of Hokkaido southwest coast, Japan of July 12, 1993. Phys. Earth Planet. In. 105, 261–269. [ Links ]
Otsuyama T., Y. Hobara and M. Hayakawa, 1999. EM radiation associated with sprites. Proc. Book on 11th International Conference on Atmospheric Electricity held at Alabama (USA), 96–98. [ Links ]
Oyama K. I., S. Watanabe, Y. Su, T. Takahashi and K. Hirao, 1996. Season, local time and longitudinal variations of electron temperature at the height of ~600 km in the low latitude region. Adv. Space Res. 18, 269–278. [ Links ]
Pasko V. P., U.S. Inan, T. F. Bell and Y. N. Taranenko, 1995. Heating, ionization and upward discharges in the mesosphere due to intense quasi–electrostatic thundercloud fields. Geophys. Res. Lett. 22, 365–368. [ Links ]
Pasko V. P., U. S. Inan, T. F. Bell and Y. N. Taranenko, 1996. Sustained heating of the ionosphere above thunderstorms as evidenced in "early/fast" VLF events. Geophys. Res. Lett. 23, 1067–1070. [ Links ]
Pasko V. P., U. S. Inan, T. F. Bell and Y. N. Taranenko, 1997. Sprites produced by quasi–electrostatic heating and ionization in the lower ionosphere. J. Geophys. Res. 102, 4529–4561. [ Links ]
Priest E. R., 1992. Basic magnetic configuration and energy supply processes for an interacting flux model of eruptive solar flares. Lec. Notes Phys. 399, 15. [ Links ]
Pulinets S., 1998a. Strong earthquake prediction possibility with the help of topside sounding from satellites. Adv. Space Res. 21, 455–458. [ Links ]
Pulinets S. A., 1998b. Seismic activity as a source of ionospheric variability. Adv. Space Res. 22, 903–906. [ Links ]
Pulinets S. A., A. D. Legen'ka and T. I. Zelenova, 1998. Dependence of the seismo–ionospheric variations in the Flayer maximum on the local time. Geomagn. Aeronomy 38, 51. [ Links ]
Pulinets S. A., A. D. Legen'ka, T.V. Gaivoronskaya and V. Kh. Depuev, 2003. Main phenomenological features of ionospheric precursors of strong earthquakes. J. Atmos. Solar–Terr. Phys., 65, 1337–1347. [ Links ]
Pulinets S. A., 2004. Ionospheric precursors of earthquakes. Recent advances in theory and practical applications. Terr. Atm. Ocean Science 15, 413–435. [ Links ]
Pulinets S. A. and K. A. Boyarchuk, 2004. Ionospheric precursors of earthquakes. Springer, Berlin, Germany, 315 pp. [ Links ]
Rai J., M. Rao and B. A. P. Tantry, 1972. Bremsstrahlung as a possible source of UHF emission from lightning, Nature (Physical Science) 238, 59–60. [ Links ]
Richards P. G., 2001. Seasonal and solar cycle variations of the ionosphere peak electron density: Comparison of measurement and models. J. Geophys. Res. 106, 12803–12819. [ Links ]
Rikitake T., 1976. Earthquake prediction. Amsterdam, Elsevier, 357 pp. [ Links ]
Schunk R. W. and J. J. Sojka, 1996. Ionosphere–thermosphere space weather issue. J. Atmos. & Solar– Terr. Phys. 58, 1527–1574. [ Links ]
Sentman D. D. and E. M. Wescott, 1993. Video observation of upper atmosphere optical flashes recorded from an aircraft. Geophys. Res. Lett. 20, 2857–2860. [ Links ]
Sentman D. D., E. M. Wescott, D. L. Osborne, D. L. Hampton and M. J. Heavner, 1995. Preliminary results from the sprites 94 aircraft campaign: 1. Red sprites. Geophys. Res. Lett. 22, 1205–1208. [ Links ]
Shalimov S. and M. Gokhberg, 1998. Lithosphere–ionosphere coupling mechanism and its application to the earthquake in Iran on June 20, 1990. A review of ionosphere measurements and basic assumptions. Phys. Earth Planet. In. 105, 211–218. [ Links ]
Sharma D. K., J. Rai, M. Israil, and S. C. Garg, 2003a. The effect of lightning on ionospheric temperature determined by SROSS–C2 Satellite. Indian J. Radio Space 32, 93–97. [ Links ]
Sharma D. K., J. Rai, M. Israil, S. Priti, P. Subrahmanyam, P. Chopra and S. C. Garg, 2003b. Sunrise effect on ionospheric temperature as measured by SROSS–C2 satellite. J. Ind. Geophysical Union, 7, 117–123. [ Links ]
Sharma D. K., J. Rai, M. Israil, P. Subrahmanyam, P. Chopra and S. C. Garg, 2004a. Enhancement in ionospheric temperatures during thunderstorms. J. Atmos. Solar–Terr. Phys. 66, 51–56. [ Links ]
Sharma D. K., M. Israil, J. Rai and S. C. Garg, 2004b. Lightning induced heating of the ionosphere. Atmósfera. 17, 31–38. [ Links ]
Sharma D. K., J. Rai, M. Israil, P. Subrahmanyam, P. Chopra and S. C. Garg, 2004c. Enhancement in electron and ion temperatures due to solar flares as measured by SROSS–C2 satellite. Annales Geophysicae 22, 2047–2052. [ Links ]
Sharma D. K., J. Rai, M. Israil and P. Subrahmanyam, 2005. Diurnal, seasonal and latitudinal variation of ionospheric temperatures of the topside F region over Indian region during solar minimum year 1995–96. J. Atmos. Solar–Terr. Phys, 67, 269–274. [ Links ]
Silina A. S., E. V. Liperovskaya, V. A. Liperovsky and C.V. Meister, 2001. Ionospheric phenomena before strong earthquakes. Natural Hazards Earth Sys. Sci. 1, 113–118. [ Links ]
Singh R. P. and R. P. Patel, 2001. Lightning generated ELF, VLF, optical waves and their diagnostic features. Proc. National Workshop on Recent Developments in Atmospheric and Space Sciences, IIT Roorkee, 9–32. [ Links ]
Suhasini R., R. Raghavarov, H. G. Mayr, W. R. Hoegy and L. E. Wharton, 2001. Equatorial temperature anomaly during solar minimum. J. Geophys. Res. 106, 24777–24783. [ Links ]
Taranenko Y. N., U. S. Inan and T. F. Bell, 1992. Optical signature of lightning–induced heating of D–region. Geophys. Res. Lett. 19, 1815–1818. [ Links ]
Thome G. D. and L. S. Wagner, 1971. Electron density enhancements in the E and F regions of the ionosphere during solar flares. J. Geophys. Res. 76, 6883–6895. [ Links ]
Vershinin E. F., A.V. Buzevich, K. Yumoto and Y. Tanaka, 1997. Correlations of seismic activity with electromagnetic emissions and variations in Kamchatka region. International Workshop on Seismo Electromagnetics, Tokyo, University of Electro–Communications Publ., Tokyo, p. 23. [ Links ]
Wescott E. M., D. D. Sentman, D. Osborne, D. Hampton and M. Heavner, 1995. Preliminary results from the sprites 94 aircraft campaign: 2. Blue jets. Geophys. Res. Lett. 22, 1209–1212. [ Links ]
Wescott E. M., D. D. Sentman, M. J. Heavner, D. L. Hampton, D. L. Osborne and O. H. Vaughan Jr, 1996. Blue starters: Brief upward discharges from an intense Arkansas thunderstorm. Geophys Res Let., 23, 2153–2156. [ Links ]
Yamada I., K. Matsuda and H. Mizutani, 1989. Electromagnetic and acoustic emission associated with rock fracture. Phys. Earth Planet. In. 57, 157–168. [ Links ]
Yukhimuk V., R. A. Roussel–Dupre, and E. M. D. Symbalisty, 1998. Optical characteristics of blue jets produced by runaway air breakdown simulation results. Geophys Res Lett, 25, 3289–3292. [ Links ]
Zaslavski Y., M. Parrot and E. Blanc, 1998. Analysis of TEC measurements above active seismic regions. Phys. Earth Planet. In. 105, 219–228. [ Links ]

