


Servicios Personalizados
Revista
Articulo
 Inglés (pdf)
 Artículo en XML
 Referencias del artículo
 Enviar artículo por email
Indicadores
-
 Citado por SciELO
 -
 Accesos
Links relacionados
-
 Similares en
SciELO
Similares en
SciELO
Compartir

 Permalink
Atmósfera
versión impresa ISSN 0187-6236
Atmósfera vol.21 no.4 Ciudad de México oct. 2008
Universal multifractal description of an hourly rainfall time series from a location in southern Spain
A. P. GARCÍA–MARÍN
Departamento de Ingeniería Rural, Universidad de Córdoba,
Campus Rabanales, 14071 Córdoba, España
F. J. JIMÉNEZ–HORNERO
Departamento de Ingeniería Gráfica y Geomática,
Universidad de Córdoba, Edificio Gregor Mendel,
Campus Rabanales, 14071 Cordoba, España
Corresponding author; e–mail: fjhornero@uco.es
J. L. AYUSO–MUÑOZ
Departamento de Ingeniería Rural, Universidad de Córdoba,
Campus Rabanales, 14071 Córdoba, España
Received March 20, 2007; accepted June 2, 2008
RESUMEN
El formalismo multifractal de turbulencia ha sido usado para llevar a cabo el análisis de la estructura temporal, para escalas desde 1 hora hasta casi 6 meses, de la serie de datos de lluvia horaria registrada durante veinticuatro años en Córdoba, localidad situada en el sur de España. Los parámetros del modelo multifractal universal fueron estimados y se obtuvo la función teórica de los momentos estadísticos. Se encontró un buen ajuste a la función empírica para un intervalo de valores de momentos, demostrándose que el modelo multifractal universal resulta adecuado para describir estadísticamente la serie temporal de lluvia registrada en Córdoba.
ABSTRACT
Multifractal turbulence formalism has been used to perform an analysis for scales from 1 hour to almost 6 months of the time structure of the hourly rainfall series recorded during twenty–four years in Córdoba, a location in southern Spain. The parameters of the universal multifractal model were estimated and the theoretical moments scaling exponent function was obtained exhibiting an acceptable agreement with the empirical function for a range of moments. The universal multifractal model shown itself to be a suitable tool for describing the statistics of the rainfall series recorded in Córdoba.
Keywords: Rainfall, multifractal analysis, universal multifractal model.
1. Introduction
Rainfall is the main factor in many processes with a significant environmental impact such as floods, droughts, runoff, soil erosion or spread of pollutants. However, the great temporal (and spatial) non–linear variability of precipitation limits the use of many existing models to describe this process.
On certain space–time scales and, specifically, in very small catchments and in urban areas, rainfall intensities present larger fluctuations, and therefore higher values than on meteorological model scales. Thus, the reliability of a forecast provided by meteorological models also depends on the efficiency of downscaling models.
The invariance of properties in any process over a range of scales is called scaling. Scaling systems can be described by fractal and multifractal theories, the latter being an evolution of the former. Fractal theory (Mandelbrot, 1982) deals with simple scaling and can describe complex phenomena by using few parameters. However, multifractal theory deals with multiscaling that allows to generalize the scaling properties of a process (Grassberger, 1983; Hentschel and Procaccia, 1983; Deidda, 2000; Deidda et al., 2006).
The multifractal analysis of rainfall has been widely used to describe its temporal and spatial distribution (Schertzer and Lovejoy, 1987; Fraedrich and Larnder, 1993; Ladoy et al., 1993; Tessier et al., 1993, 1996; Over and Gupta, 1994; Svensson et al., 1996; de Lima and Grasman, 1999; Kiely and Ivanova, 1999; Sivakumar, 2001; Labat et al., 2002; Veneziano and Furcolo, 2002; Olsson and Burlando, 2002; Kantelhardt et al., 2006; Langousis and Veneziano, 2007). The universal multifractal model (UM) which uses the formalism of turbulence, was developed by Schertzer and Lovejoy (1987) to model the variability of rainfall by a multiplicative cascade process, in which the flux of water is transferred from larger to small regions (scales) of the atmosphere (Over and Gupta, 1994), in a similar way to what happens in turbulence models, where the transfer of energy from larger to smaller scales is assumed. This multifractal approach has been used to carry out multiple analyses of rainfall and related topics (Hubert et al., 1993; Ladoy et al., 1993; Tessier et al., 1993, 1996; Svensson et al., 1996; de Lima and Grassman, 1999; Lilley et al., 2006; Lovejoy and Schertzer, 2006; Lashermes and Foufoula–Georgiou, 2007).
The objective of the present work was to perform an analysis of the long–term hourly rainfall series recorded in Córdoba, a location in southern Spain, by using the multifractal turbulence formalism to check whether the results were consistent with those found in earlier studies for other locations. This was done as a contribution to the consolidation of the existing knowledge on the multifractal nature of precipitation, and to confirm the possible use of the universal multifractal model to generate synthetic rainfall data in the cited location.
2. Material and methods
2.1 Universal multifractals
To carry out a rainfall time structure analysis by applying multifractal turbulence formalism, the data series should be divided into non–overlapping intervals of a certain resolution. The ratio of the maximum scale of the field to this interval is termed "scale ratio", λ (Svensson et al., 1996). Considering ελ as the rainfall intensity on each time interval at the scale ratio λ divided by the average of the sample corresponding to the largest scale of interest (λ =1), the ensemble average qth moment <ελq > is related to the empirical moments scaling exponent function K(q) in such a way that (Schertzer and Lovejoy, 1987):

The scaling behaviour expressed by Eq. (1) can be investigated by plotting <ελq > as a function of λ in a log–log diagram for different values of q. The curves obtained will exhibit an approximately linear behaviour with slopes that are estimations of K(q) if Eq. (1) is valid. If K(q) versus q is a straight line, the data set is monofractal. However, if K(q) versus q is a convex function, the data set is multifractal (Parisi and Frisch, 1985).
The universal multifractal (UM) model was proposed by Schertzer and Lovejoy (1987) assuming that the generator of multifractals was a random variable with an exponentiated extremal Lévy distribution. Thus, the theoretical scaling exponent function K(q) for the moments q > 0 of a cascade process is obtained according to:

in which α  [0, 2] is the Lévy index and indicates the degree of multifractality (i.e. the deviation from monofractality). α = 0 and α = 2 correspond to the monofractal and log–normal cases, respectively.C1 [0, d], with dbeing the dimension of the support (d = 1 in this case), describes the sparseness or inhomogeneity of the mean of the process. Parameter H determines the deviation from conservation times (<ελq > = λ –H). For conserved processes, H = 0.
The estimation of the parameters C1 and a can be made by applying the double trace moment (DTM) technique (Lavallée et al., 1993). Thus, the intensity εΛ associated with the finest resolution Λ is first raised to the power η, degraded to the scale ratio λ and the qth power of the result averaged over the available data. The double moment exponent function K(q,η) is derived from:

by using log–log plots, as described for the K(q) function.
The parameter can be estimated as the slope of the linear regression fitted to the plot of |K(q, η)| versus log (η) for fixed q (Tessier et al., 1996). The estimation of C1 is derived by considering that K(q, 1) is the intercept of the linear regression with log (η) = 0. Alternatively, it can be obtained from the empirical moments scaling exponent function K(q), considering C1= [dK(q)/dq]q = 1
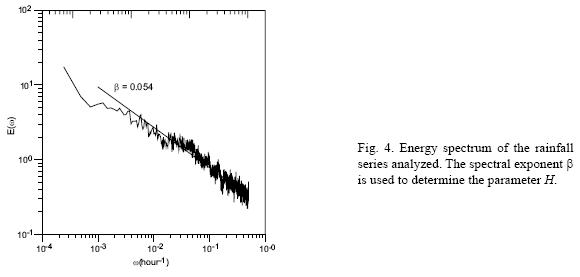
From the estimated values of a and C1 and taking the value of exponent β that characterizes the energy spectrum of the conserved process E(ω) ≈ ω–β, with w being the frequency, the parameter H is given by (Lavallée et al., 1993):

2.2. Rainfall data
The hourly rainfall data analyzed in this work were collected at Córdoba airport weather station (37.85° N, 4.85° W) from 1980 to 2003. The altitude is 117 m and the climate of this area can be defined as a mixture between Mediterranean characteristics and Continental effects. The mean annual temperature is 17.7 °C and the amplitude of the average temperatures is 19.6 °C. The annual average potential evaporation is 1500–2000 mm and the mean precipitation is around 600 mm. The rainy period mainly occurs from October to May with the highest amount of precipitation recorded during November–December and February. The general impression for the area is that it is semi–arid with hot, dry summers and relatively temperate winters.
The rainfall data were recorded using a Hellmann rain gauge (World Meteorological Organization standard), with a horizontal opening of 200 cm2 at a height of 1.2 m. The temporal resolution of this continuously–recorded rain gauge was 1 hour and its accuracy, expressed as the minimum amount of rain that it was able to record, was 0.1 mm.
3. Results
Following Eq. (1), a wide range of moments of the rainfall intensity ελ on the time scales from 1 hour (λ = 4096) to almost 6 months (λ = 1) have been calculated (Figs. 1a and 1b).
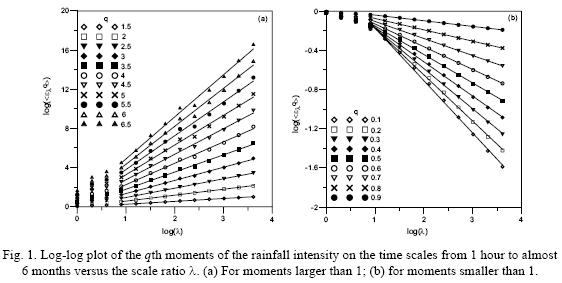
Straight lines in Figs. 1a and 1b can be fitted for all the qth moments, showing the scaling behavior from 1 hour to almost 21 days. The accuracy of the rain gauge (0.1 mm) and the value of large observations in the rainfall data set, affect the results obtained for the qth moments (de Lima and Grasman, 1999). This influence can be observed for small and high values of q, for which the experimental data (symbols in Figs 1a and 1b) are not aligned. This fact is a consequence of the limitations of the data set.
The scaling break at 21 days shown in Figures 1a and 1b is presumably a manifestation of the "synoptic maximum", which is the typical lifetime of planetary scale atmospheric structures (Kolesnikov and Monin, 1965). Different values of the "synoptic maximum" for the rainfall have been found between 11 (de Lima and Grasman, 1999) and 16 days (Ladoy et al., 1993; Tessier et al., 1996), and one month (Fraedrich and Larnder, 1993; Svensson et al., 1996).
Figure 2 shows the empirical exponent function K(q) that describes the scaling of the moments from 1 hour to 21 days. The shape of K(q) is mainly convex, meaning that the rainfall time series is multifractal. Nevertheless, this function exhibits a linear behaviour for q < qmin≈ 1.75 and q > qmax ≈ 2.9.
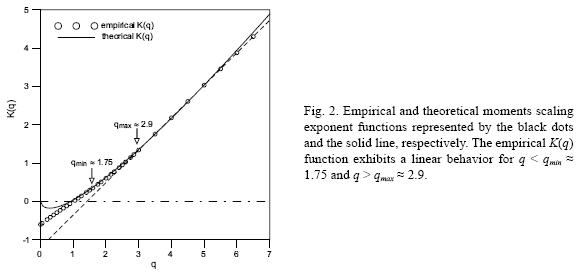
Fig. 3a shows the log–log plots of ((εΛη)λq) versus λ for q = 2, considering different values of η. The log–log linearity in these plots demonstrates the scaling nature of the rainfall series. The corresponding plots of log |K (q, η)| versus log (η), for η values of 10–1 to 10 at 100.05 increments, are shown in Figure 3b for some of the investigated q–moments, all of them within the range from qmax= 1 .75 up to qmax = 2.9; these values being those that delimit the scaling behavior (i.e. convex shape) in the empirical scaling exponent function K(q) described in Figure 2. The slope of the linear segments located at the middle parts of these curves permitted to obtain a value of α = 0.732 ± 0.011. According to the estimated value for a, the rainfall process belongs to the universality class with 1 < α < 0 (Lovejoy and Schertzer, 1990) that corresponds to (log) Lévy processes with bounded singularities, denominated as conditionally hard multifractals. This result is in agreement with those found by authors such as Tessier et al. (1993) for a global network of 1000 weather stations, Hubert et al. (1993) for Reunion Island (Indian Ocean), Ladoy et al. (1993) for Nimes (France) and de Lima and Grasman (1999) for Vale Formoso (Portugal).
From Figure 3b the value of C1 can be yielded, this being C1 = 0.434 ± 0.005. Working with the empirical scaling exponent function K(q) shown in Figure 2, a similar value is obtained, this being C1 = [dk (q)/dq]q = 1 = 0.458. Parameter C1 is the measurement of the sparseness of the data. The larger C1 the more the mean rainfall is inhomogeneous.
The estimation of H requires the spectral exponent β = 0.54 estimated from the log–log plot of the energy spectrum for the rainfall series analyzed (Fig. 4). The energy spectrum was calculated by using a Tukey–Hanning window of 4096 hours in length with a 50% overlap. Applying Eq. (4) and taking into account the value K(2) = 0.561, H = 0.04 was yielded. The theoretical scaling exponent function is then obtained by replacing in Eq. (2) the estimated parameters α, C1 and H (Fig. 2, solid line). The agreement between this function and the empirical K(q) is acceptable for a range of values limited by the small and very high orders of the moments. The disparity between both functions for the smaller orders of moments was a consequence of the presence of zeros in the time series analyzed, because the universal multifractal model implicitly assumes zero–free data.
4. Conclusions
The analysis of the 23–year long–term series of hourly rainfall recorded in Córdoba has shown that the multifractal framework is suitable for describing the temporal structure of the rainfall process at this location. Scales from 1 hour to almost 6 months have been explored in this work, and a scaling behaviour of rainfall has been detected for a range from 1 hour to almost 21 days. Although factors such as the accuracy of the rain gauge or the maximum data recorded may affect the results, the scale break interpreted as the synoptic maximum is comparable to values found in the literature for different places.
The theoretical moments scaling exponent function has been obtained by applying the universal multifractal model. It is very similar to the empirical function, with the exception of the small and very high moments. The good agreement between both functions suggests that universal multifractals can be used in generating synthetic hourly rainfall data in Córdoba.
References
de Lima M. I. P. and J. Grasman, 1999. Multifractal analysis of 15–min and daily rainfall from a semi–arid region in Portugal. J. Hydrol. 220, 1–31. [ Links ]
Deidda R., 2000. Rainfall downscaling in a space–time multifractal framework. Water Resour. Res.. 36, 1779–1794. [ Links ]
Deidda R., M. G. Badas and E. Piga, 2006. Space–time multifractality of remotely sensed rainfall fields. J. Hydrol. 322, 2–13. [ Links ]
Fraedrich K. and C. Larnder, 1993. Scaling regimes of composite rainfall time series. Tellus 45A, 289–298. [ Links ]
Grassberger P., 1983. Generalized dimensions of strange attractors. Phys. Lett. A 97, 227–230. [ Links ]
Hentschel H. G. E. and I. Procaccia, 1983. The infinite number of generalized dimensions of fractals and strange attractors. Physica D8, 435–444. [ Links ]
Hubert P., Y. Tessier, S. Lovejoy, D. Schertzer, P. Ladoy, J. P. Carbonnel and S. Violette, 1993. Multifractals and extreme rainfall events. Geophys. Res. Lett. 20, 931–934. [ Links ]
Kantelhardt J.W., E. Koscielny–Bunde, D. Rybski, P. Braun, A. Bunde and S. Havlin, 2006. Long–term persistence and multifractality of precipitation and river runoff records. J. Geoph. Research–Atmospheres 111 (D1): Art. No. D01106. [ Links ]
Kiely G. and K. Ivanova, 1999. Multifractal analysis of hourly precipitation. Physics and Chemistry of the Earth Part B–Hydrology Oceans and Atmosphere 24, 781–786. [ Links ]
Kolesnikov V. N. and A. S. Monin, 1965. Spectra of meteorological field fluctuations. Izv. Acad. Sci. USSR Atmos. Oceanic Phys. 1, 653–669. [ Links ]
Labat D., A. Mangin and R. Ababou, 2002. Rainfall–runoffs relations for karstic springs: multifractal analyses. J. Hydrol. 256, 176–195. [ Links ]
Ladoy P., F. Schmitt, D. Schertzer and S. Lovejoy, 1993. Variabilité temporelle multifractale des observations pluviométriques à Nîmes. Comptes Rendues Acad. des Sciences 317, 775–782. [ Links ]
Langousis A. and D. Veneziano, 2007. Intensity–duration–frequency curves from scaling representations of rainfall. Water Resour. Res. 43, doi: 10.1029/2006WR005245. [ Links ]
Lashermes B. and E. Foufoula–Georgiou, 2007. Area and width functions in river networks: new results on multifractal properties. Water Resour. Res. 43, doi. 10.1029/2006WR005329. [ Links ]
Lavallée D., S. Lovejoy, D. Schertzer and P. Ladoy, 1993. Nonlinear variability and landscape topography: analysis and simulation. In: Fractals in Geography (N. Lam and L. De Cola, Eds.) Prentice Hall, Englewood Cliffs, 158–192. [ Links ]
Lilley M., S. Lovejoy, N. Desaulniers–Soucy and D. Schertzer, 2006. Multifractal large number of drops limit in rain. J. Hydrol. 328, 20–37. [ Links ]
Lovejoy S. and D. Schertzer, 1990. Multifractals, universality classes, satellite and radar measurements of clouds and rain. J. Geophys. Res. 95, 2021–2034. [ Links ]
Lovejoy S. and D. Schertzer, 2006. Multifractals, cloud radiances and rain. J. Hydrol. 322, 59–88. [ Links ]
Mandelbrot B. B., 1982. The fractal geometry of nature. W. H. Freeman & Company, New York, 480 pp. [ Links ]
Olsson J. and P. Burlando, 2002. Reproduction of temporal scaling by rectangular pulses rainfall model. Hydrol. Proc. 16, 611–630. [ Links ]
Over T. M. and V. K. Gupta, 1994. Statistical analysis of mesoscale rainfall: dependence of a random cascade generator on large scaling forcing. J. Appl. Meteor. 33, 1526–1543. [ Links ]
Parisi G. and U. Frisch, 1985. A multifractal model of intermittency. In: Turbulence and predictability in geophysical fluid dynamics and climate dynamics. (M. Ghil, R. Benzi, and G. Parisi, Eds.). North–Holland, Amsterdam, 84–88. [ Links ]
Schertzer D. and S. Lovejoy, 1987. Physical modelling and analysis of rain and clouds by aniso–tropic scaling multiplicative processes. J. Geophys. Res. 92, 9693–9714. [ Links ]
Sivakumar B., 2001. Is a chaotic multi–fractal approach for rainfall possible? Hydrol. Processes 15, 943–955, (with a minor correction) in Hydrol. Processes 15, 2381–2382. [ Links ]
Svensson C., J. Olsson and R. Berndtsson, 1996. Multifractal properties of daily rainfall in two different climates. Water Resour. Res. 32, 2463–2472. [ Links ]
Tessier Y., S. Lovejoy and D. Schertzer, 1993. Universal multifractals in rain and clouds: theory and observations. J. Appl. Meteor. 32, 223–250. [ Links ]
Tessier Y., S. Lovejoy, P. Hubert, D. Schertzer and S. Pecknold, 1996. Multifractal analysis and modelling of rainfall and river flows and scaling, causal transfer functions. J. Geophys. Res. 101, 26427–26440. [ Links ]
Veneziano D. and P. Furcolo, 2002. Multifractality of rainfall and scaling of intensity–duration–frequency curves. Water Resour. Res. 38, doi: 10.1029/2001WR000372. [ Links ]

