


Serviços Personalizados
Journal
Artigo
 Inglês (pdf)
 Artigo em XML
 Referências do artigo
 Enviar este artigo por email
Indicadores
-
 Citado por SciELO
 -
 Acessos
Links relacionados
-
 Similares em
SciELO
Similares em
SciELO
Compartilhar

 Permalink
Atmósfera
versão impressa ISSN 0187-6236
Atmósfera vol.21 no.4 Ciudad de México Out. 2008
Temporal variations in sun photometer measured precipitable water in near IR band and its comparison with model estimates at a tropical Indian station
P. ERNEST RAJ, P. C. S. DEVARA, S. K. SAHA, S. M. SONBAWNE,
K. K. DANI, G. PANDITHURAI
Indian Institute of Tropical Meteorology, Pashan Road, Pune 411008, India
Corresponding author: P. Ernest Raj; email: ernest@tropmet.res.in
A. RAMANA MURTHY
Department of Physics, Andhra University, Visakhapatnam 530003, India
Received July 24, 2007; accepted April 21, 2008
RESUMEN
Para investigar las variaciones estacionales y temporales del contenido de agua precipitable (PWC, por sus siglas en inglés) se hicieron observaciones con un fotómetro solar multicanal en la banda del infrarrojo cercano en la estación tropical de Pune, en la India, durante el periodo de mayo 1998 a mayo 2006. Para la estación mencionada se compararon el agua precipitable estimada a partir de parámetros meteorológicos de superficie (temperatura y humedad relativa) y la obtenida del satélite MODIS. Existe una variación estacional bien definida del contenido de agua precipitable con un máximo durante los meses del monzón del suroeste (junio–septiembre) y un mínimo durante el mes de marzo. La variabilidad del PWC es mayor durante el post monzón y los meses de invierno (octubre–febrero) y menor durante los meses del pre monzón y monzón (marzo–septiembre). La media total del PWC estimada con el fotómetro solar en Pune es de 13.27 mm. El agua precipitable calculada con los parámetros meteorológicos y la obtenida de los datos de satélite es mayor en magnitud que las mediciones obtenidas con el fotómetro solar desde tierra. Sin embargo, las variaciones temporales en todas las escalas de tiempo concuerdan muy bien y se encuentran en fase. Un fotómetro solar portátil bien calibrado en las longitudes de onda del infrarrojo cercano puede proporcionar observaciones temporales muy buenas del agua precipitable en cualquier localidad.
ABSTRACT
Multi–channel sun photometer observations of precipitable water content (PWC) in the near–infrared band over a tropical Indian station, Pune, during the period May 1998–May 2006 have been used to investigate temporal and seasonal variations. Precipitable water estimated from surface meteorological parameters (temperature and relative humidity) and that obtained from MODIS satellite for the same station have been compared with those observations made by the sun photometer. There exists a well defined seasonal variation in precipitable water content with maximum during southwest monsoon months (June–September) and minimum during the month of March. Variability in PWC is higher during post–monsoon and winter months (October to February) and smaller during pre–monsoon and monsoon months (March to September). The overall mean PWC measured by sun photometer at Pune is 13.27 mm. Precipitable water estimated from surface meteorological parameters and that obtained from satellite retrieval are higher in magnitude compared to that from the ground–based sun photometer measurements. However, the temporal variations on all time scales agree very well and are in–phase. A well calibrated portable sun photometer operated at the near infrared wavelengths would give very good temporal observations of precipitable water at any location.
Keywords: Precipitable water, sun photometer, temporal variation.
1. Introduction
Earth's atmosphere typically contains 0–4% water vapor which is highly variable in both space and time. More than 50% of water vapor is concentrated below the 850 mb level, while more than 90% is confined to the layer below 500 mb (Peixoto and Oort, 1983). The water vapour density decreases more gradually with altitude at higher latitudes compared to that at lower latitudes (Parameswaran and Krishna Murthy, 1990). In the tropical region, there is more water vapor in the lower troposphere than that in the extra tropical regions. On a seasonal scale, maximum water vapor occurs during the month of August, while minimum occurs in February at almost all the latitudes. The capacity of the atmosphere to retain water vapor depends strongly on atmospheric temperature. The knowledge of total moisture present in the atmosphere is necessary for many purposes as it plays a significant role in the absorption and emission of radiative energy. The radiative characteristics of water vapor permit it to act as the principle agent of energy loss from the atmosphere. Absorption of solar radiation by water vapor is the major source of solar heating in the lower atmosphere. Atmospheric water vapor strongly absorbs both the incoming solar radiation and the long wave radiation emitted by the earth towards space.
The mean temperature vertical profile and the shape of the vertical distribution of the water vapor mass concentration are very useful in the analysis of satellite data, as well as in calculation of the radio wave atmospheric path corrections and more generally, in all studies dealing with cloud physics, meteorology and climatology. In an ideal case, it is desirable to know the full vertical distribution of water vapor in the atmosphere (Butler, 1998a; 1998b), but it is not always possible to obtain the altitude profile of the water vapor. It is relatively easy to measure water vapor content in a vertical column (precipitable water) of the atmosphere. Precipitable water (PW) is a measure of the total amount of water vapor content in a vertical column of air with unit area of horizontal cross–section and extending from the surface to the top of the atmosphere. This is the equivalent depth of water which would results if all the water vapor in the atmosphere were concentrated into a layer of liquid. Precipitable water is an important parameter currently being obtained from satellite and radiosonde measurements. Also it is a very important physical parameter for characterizing atmospheric aerosols, which affects aerosol optical characteristics which in turn influences global radiation budget and climate change. The most practical means of making these observations is by remote sensing, which can be either from the ground (looking in the skyward direction with a sun photometer) or from space (looking toward ground through atmosphere with imaging radiometer onboard satellites or high altitude aircraft) (Ichoku et al., 2002).
Water vapor absorption/transmission of solar radiation has been studied for almost a century. Fowle (1915) was the first to relate water content and transmission using spectrometer technique by measuring the transmission of light through a large tube containing a known amount of water. Solar radiation attenuation/extinction are a widely established technique used to measure background atmospheric turbidity (Flowers et al., 1969; Volz, 1969). Several workers have used this optical technique to determine total precipitable water content in the atmosphere (e.g. Tomasi and Guzzi, 1974; Volz, 1974; Pitts et al., 1977; Bird and Hulstrom, 1982; Reagan et al., 1987; Bruegge et al., 1992; Thome et al., 1992; Michalsky et al., 1995; Schmid et al., 1996; Halthore et al., 1997; Ingold et al., 2000; Morys et al., 2001). Studies have shown that horizontal moisture gradients and incipient clouds that are invisible to the naked eye can be detected by this optical technique (Pitts et al., 1977). Precipitable water measurements can be derived from radiosonde soundings, but only at 12–h intervals as per the synoptic hour (0000 and 1200 UTC) balloon ascents. It is known that precipitable water in the atmosphere changes at time scales shorter than this (Bruegge et al., 1992). Also, radiosonde measurements have a relative uncertainty of about 10% (Halthore et al., 1997). Thus a sun photometer allows one to monitor atmospheric precipitable water on a real–time basis.
Ground–based and satellite remote sensing of precipitable water has different but complementary characteristics. Such observations are vital for different situations as well as for cross validating each other. A number of currently available operational satellite sensors (MODIS) provide data for retrieving PWC (Ichoku et al., 2002).
Atmospheric aerosols and various gases interact in different ways with water vapor in the atmosphere, producing various effects. As the relative humidity increases, water vapor condenses on the particulates suspended in the atmosphere. This condensed water increases the size of the aerosols and changes their composition and their effective refractive index. The resulting effect of the aerosols on the absorption and scattering of the light will correspondingly be modified (Hanel, 1972; Shettle and Fenn, 1979). Therefore a continuous monitoring of aerosol and precipitable water content with good temporal and spatial resolution is essential for understanding various physical and dynamical processes taking place in different layers of the atmosphere. Such data and results are sparse in the low–latitude tropical monsoon region.
Latitudinally, precipitable water decreases from the equatorial regions, where it attains highest values, to the north and south poles. In general, the precipitable water is higher over the oceans than over the continents and over desert areas it is considerably smaller, mainly because of strong subsidence. It is also much reduced over high altitude mountain regions (Asnani, 1993). Precipitable water in the atmosphere over the oceans is a useful parameter which indicates the dynamic state of the atmospheric boundary layer. When low–level convergence is present in the atmosphere, a deep convective layer is formed resulting in a relatively large amount of precipitable water. On the other hand, when stable conditions prevail, such as those associated with low level inversions, a dry layer above the inversion is formed and the precipitable water in the atmosphere consequently is reduced. The vertical transport of the water vapor in the atmosphere plays an important role in the hydrological cycle, since it links the terrestrial and atmospheric branches (Asnani, 1993).
The tropical region has fairly regular daily cycle of weather. This cycle manifest itself in almost all meteorological elements like pressure, temperature, wind, relative humidity, and cloud type and cloud amount. In the tropical region the temperature gradient is weak. Here relative humidity contrasts and wind discontinuities are of primary importance for forecasting purposes. Thus precipitable water becomes an important atmospheric constituent.
Some details of the sun photometer used for the observations and the methodology followed by Butler (1998a; 1998b) in estimating the precipitable water from surface meteorological parameters are given in the following sub–sections.
1.1 Sun photometer
Several attempts have been made by researchers to construct an inexpensive portable sun photometer for atmospheric monitoring. In the past a major obstacle in producing accurate and repeatable results was the lack of stable, narrow band optical filters with adequate out–of–band rejection. Advances in thin film deposition techniques made it possible to produce filters of satisfactory quality. The Microtops II (Solar Light Inc., USA) is a 5–channel portable sun photometer measuring the direct solar radiation at three UV channels (300, 305.5, 312.5 nm) and two near–infrared (IR) channels (940 and 1020 nm). Based on measurements from this instrument it is possible to retrieve total ozone column and total water vapor (Morys et al., 2001) and since ozone is being monitored, this instrument is also called ozonometer or ozone monitor.
The instrument is equipped with five accurately aligned optical collimators, with a full field view of 2.5°. Internal baffles are also integrated into the device to eliminate internal reflections. Each channel is fitted with a narrow–band interference filter and aphotodiode suitable forthe particular wavelength range. A 'sun target and pointing' assembly is permanently attached to the optical block and laser–aligned to ensure accurate alignment with the optical channels. When the image of the sun is centered in the bull's–eye of the sun target, all optical channels are oriented directly at the solar disk. Radiation captured by the collimator and band pass filters, radiates onto the photodiodes, producing an electrical current that is proportional to the radiant power intercepted by the photodiodes. The water vapor measurement is based on a pair of radiometric measurements in the IRband. As mentioned above, the 940 nm filter (10 nm FWHM) is located in a strong water vapor absorption band, while the 1020 nm filter (10 nm FWHM) is affected only by aerosol scattering.
For accurate PWC determination, Microtops sun photometer needs to be pointed accurately to the sun, such that the image of the latter is centered correctly in the view window of the instrument. Otherwise, the determined PWC values may become much larger than true values. Regular calibration is essential to maintain high accuracy standard and for monitoring the up–to–date measurement characteristics of the sun photometer. The front quartz window through which the solar flux gets into the sun photometer needs to be cleaned regularly to prevent measurement errors.
1.2 Estimation of precipitable water by Butler method
Observations in the past clearly show a very strong relation of total column water vapor (precipitable water) with surface and tropospheric temperature. Given measurements of surface temperature and dew point, a rough estimate of the precipitable water can be made. Uncertainties in the actual profile of water vapor make this a truly rough estimate, but it is probably good to a few 10's of percent (Butler, 1998a). Assuming that the water vapor is exponentially distributed in the atmosphere above a given location, the amount of precipitable water has been derived from surface observations of temperature and relative humidity using an analytical expression by Butler (1998a; 1998b) and the amount of precipitable water is given by

where mw is the mass of each water molecule (mw = 18 amu), P0 is the water vapor partial pressure at the surface, H is the scale height of water vapor (assumed to be 1.5 km), ρ1 is the mass density of liquid water (ρ1 = 1000 kg/m3), k is the Boltzmann constant, and T0 is the surface temperature. Putting in the constants gives:

where h is in mm, P0 is in ubar, and T0 is in K. The surface water vapor partial pressure can be derived from the surface relative humidity (Liebe, 1989) via:
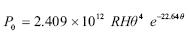
Where the value of RH is in percent, θ is inverse temperature (θ = 3 00/T0, T0 in K), and the resultant water vapor partial pressure is in µbar.
2. Data and method of analysis
The multi–channel sun photometer (Microtops–II) with the two near–IR wavelength channels, described above, has been in operation since May 1998 at Institute Campus in Pune (18°32'N, 73°5 1'E, 559 m above mean sea level), India on the terrace of a 13–meter tall building to get clear view of the sky/sun from sunrise to sunset. Sun photometric observations have been made on all clear sky days at time intervals ranging from 5 to 30 minutes. Observations collected on partially cloudy sky days is also considered for analysis only if the field of view (FOV) is clear of any visible cloud or hazy layer in spite of the cloud patches being scattered around in other parts of the sky. Aerosol optical depth (AOD) obtained at six wavelengths using a pair of sun photometers simultaneously with precipitable water content observations is also checked to see if abnormal high values of AOD, deviating abruptly from previous observations or from long–term mean value, occur. Any such values contaminated due to loud hindrance are ignored from computation of averages. The main idea of including PWC observations during partly cloudy sky conditions or with scattered cloud patches but with a clear FOV is to investigate possible build up of water vapor in the atmosphere with time due to convection or advection of moisture and before local cloud formation process. The general observation at this station is that during pre–monsoon season (March–May) and also during some days in the south–west monsoon months (June–September), sky is clear with bright sunshine and moderate to low aerosol optical depths in the forenoon hours. By noon time clouds start forming in the sky, growing in size. As long as the FOV is clear, sun photometric observations can be carried out but values of AOD have to be taken with caution under such cases. As mentioned in the previous section, since the precipitable water estimations made by sun photometer are at two closely spaced near–IR wavelengths (940 and 1020 nm), any errors due to aerosol scattering or cloud particle scattering are minimized due to the fact that differential absorption of solar light at two close wavelengths is considered for computation of water vapor content. This is one of the main advantages of the optical method of retrieving precipitable water or any atmospheric gas constituent from differential absorption of solar/light radiation at two wavelengths, one having maximum absorption cross–section and the second having minimum absorption cross–section for the constituent being measured.
Daily 20 to 25 values of PWC are available during the period 07:30–18:00 h local time depending on the season and sky conditions. Data collected at Pune continuously for the six–year period, May 1998 to May 2004, has been analyzed here to compute daily and monthly means to investigate temporal, seasonal variations and for comparison with those PWC values retrieved from other techniques. Some preliminary results of sun photometer derived precipitable water over this station have been reported recently in an earlier publication of the authors (Ernest Raj et al., 2004). To study short term temporal variations in PWC within a day and how they relate to surface meteorological parameters, sun photometric data collected in the daytime during the month of May 2006 have been used and presented as case study and discussed. Simultaneous observations of surface temperature and relative humidity have also been collected during May 2006 using a hand–held thermo–hygrometer.
Daily surface meteorological data (surface temperature and relative humidity) of Pune station at three hourly intervals (00:00, 03:00, 06:00, 09:00, 12:00, 15:00, 18:00, 21:00 h LT) for the period January 1998–May 2004 has been collected from the National Data Center, India Meteorological Department (IMD), Pune. Since sun photometer data is for daytime, the surface data available at only the four instances i.e., 09:00, 12:00, 15:00 and 18:00 hours has been considered to represent the daytime values. Using the aforementioned analytical expression of Butler (1998b), precipitable water at individual hours is computed. Daily and monthly means have also been obtained for further investigations. PWC obtained by this analytical method from surface observations of temperature and relative humidity is subsequently called 'PWC by Butler method' for comparison with PWC retrieved from the optical sun photometer method.
Monthly mean water vapor content in the clear sky near–IR band retrieved from MODIS satellite available from NASA, USA web site for the period April 2000–May 2004 has been also used in the study for comparison.
3. Results and discussion
3.1 Seasonal variation
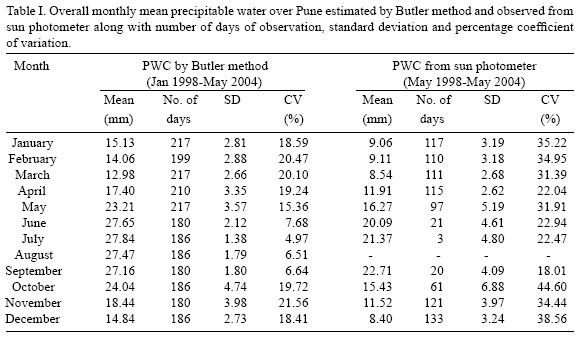
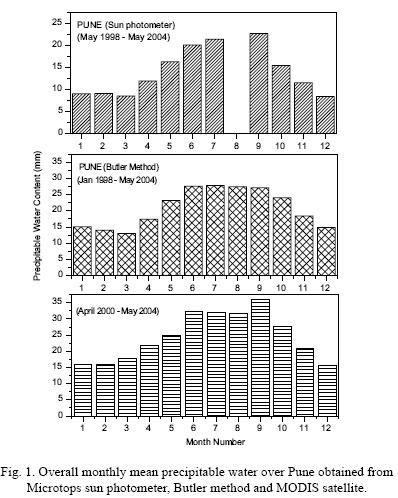
As mentioned in the previous section, sun photometer (Microtops–II) has been in near–continuous operation during daytime at Pune since May 1998. Daily 20–25 observations of precipitable water content (PWC in mm) in the near–IR band (940 and 1020 nm) have been collected and archived. On some clear days as many as 30 values are collected at time interval ranging from 5–30 minutes. From this data, daily averages were computed for those days when at least a few observations are available in both forenoon and afternoon hours. Therefore, because of cloudy sky conditions and lack of adequate data during afternoon hours, daily mean data was not available for the month of August and very few days data is available for other SW monsoon months of June, July and September. To investigate the overall seasons variations in precipitable water, monthly mean PWC for the entire six years period from May 1998 to May 2004 has been obtained. Table I shows the overall monthly mean PWC obtained from sun photometer along with the number of days of observations in each month, standard deviation and percentage coefficient of variation. PWC computed from surface meteorological parameters by Butler method, as described in the previous section, has been taken and similar overall monthly means for the period January 1998–May 2004 have been computed and shown in Table I along with number of days of observation, standard deviation and coefficient of variation. Mean PWC for Pune obtained from sun photometer is 13.27 mm and that estimated by Butler method is 20.56 mm. Thus mean PWC value estimated from surface meteorological parameters (temperature and relative humidity) by Butler method is about 7 mm higher compared to that obtained from the optical method (sun photometer). Butler (1998a) assumes a water vapor scale height of 1.5 km in deriving his analytical expression which may be chiefly applicable for mid latitudes. If the scale height is assumed to be 1.0 km and PWC is re–estimated from the Pune surface meteorological data, the mean value of PWC for the period January 1998–May 2004 becomes 13.71 mm which is nearly identical to the mean value (13.27 mm) obtained from sun photometer observations. Thus it is appropriate to first assign the proper water vapor scale height for the particular location and estimate PWC using the Butler method. However in this study PWC estimations were carried out retaining the original water vapor scale height (1.5 km) since the aim was to compare the seasonal and temporal variations in PWC. It is also noticed from Table I that the variability in PWC is higher with the optical method. Both sun photometric observation and Butler method show that variability in PWC is smaller during pre–monsoon and monsoon months (March to September) and it is higher during post–monsoon and winter months (October–February). Figure 1 shows bar diagram of month–to–month variation in overall average PWC obtained from sun photometer, Butler method and MODIS satellite data. It is seen that minimum PWC occurs in the month of March and starts increasing till June and remains high during southwest monsoon months (June–September). PWC starts decreasing soon after monsoon season ends from the month of October and then a secondary minimum occurs during the month of December. Satellite (MODIS) derived precipitable water content also shows a similar seasonal variation. However, MODIS derived PWC values are higher in magnitude by almost 10 mm from that obtained by sun photometer method. The mean monthly difference in PWC between sun photometer and Butler method varies from 3 to 8 mm.
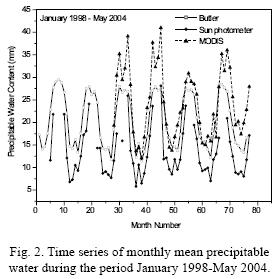
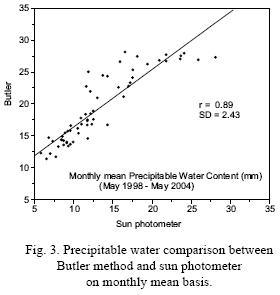
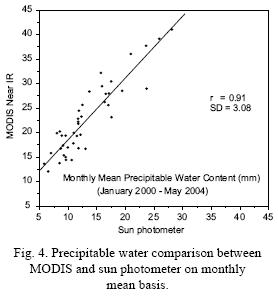
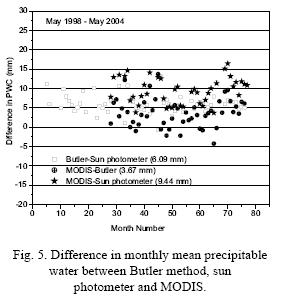
To investigate month–to–month variation in PWC, time series of individual monthly mean precipitable water obtained from sun photometer, Butler method and from MODIS for the available data during the period starting from January 1998 to May 2004 has been plotted in Figure 2. It is observed that the month–to–month variations in all three data series are in phase with each other. A predominant seasonal oscillation can be clearly seen in all the three data sets. However PWC values during the southwest monsoon months (June–September) obtained from the MODIS satellite are higher. The reason for this large difference needs to be investigated in detail. The scatter plot of monthly mean precipitable water content between that obtained by Butler method and by sun photometer is shown in Figure 3, and that for MODIS and sun photometer is shown in Figure 4. The solid line in both figures shows the linear best fit. The correlation coefficient is about 0.89 in the case of Butler method and sun photometer, which is quite significant. The correlation coefficient is even better (0.91) between MODIS and sun photometer. Thus on a month–to–month basis there is very good agreement between the PWC values from the two techniques. The difference in magnitude could be due to various reasons including difference in retrieval techniques, experimental errors and assumptions. Such inter–comparisons would help to reassess the various retrieval techniques. The difference in PWC observed in each month between Butler method and sun photometer (Microtops), MODIS and Butler method, and MODIS and sun photometer is calculated and shown plotted in Figure 5 for all the corresponding available data. MODIS and Butler method of estimation show a very close agreement with mean difference of 3.7 mm. MODIS and sun photometer show the largest mean difference of about 9.4 mm. The difference between Butler and sun photometer shows a moderate mean value of 6 mm. Thus it appears that MODIS overestimates that PWC obtained from both Butler method and sun photometer method, and PWC values obtained by sun photometer are the smallest mean values among all the three.
3.2 Day–to–day variations
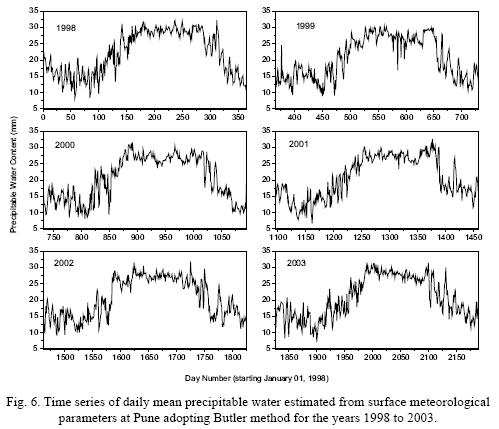
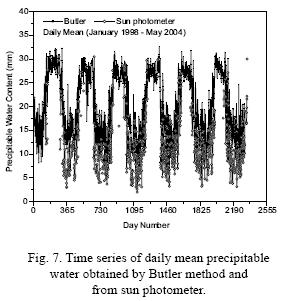
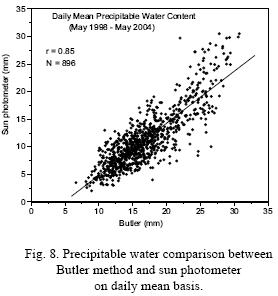
Daily mean daytime (09:00 to 18:00 h LT) values of precipitable water content estimated from Butler method for the 6 years (1998–2003) for all the 365 days in individual years is shown plotted in Figure 6. The annual/seasonal oscillation is almost similar in all the years with higher values of PWC in SW monsoon months and smaller values during winter. But on a closer observation it can be seen that there are year to year differences in magnitude of the seasonal oscillation, especially during pre–monsoon and southwest monsoon months. Larger fine structure in temporal variation (variability) on day–to–day scale can be seen mainly during winter and pre–monsoon months. This could be due to the fact that surface meteorological conditions vary considerably from day to day during these seasons and PWC estimated from Butler method is solely dependant on surface temperature and relative humidity. Daily mean time series of precipitable water obtained from Butler method (solid line) and that from sun photometer observations (open circles) are plotted in Figure 7. Daily mean simultaneous PWC values are available for about 896 days during period May 1998–May 2004. A scatter plot between sun photometer–derived PWC and those estimated by Butler method is shown in Figure 8. There is very good agreement between sun photometer–derived and Butler estimated values of PWC on a daily scale also with a correlation coefficient of 0.85. However, scatter of points is wider at higher values of PWC, beyond about 25 mm. The X–intercept in the plot shows an over estimate of about 5 mm by Butler method.
3.3 Short–term temporal variations
Sun photometric observations of precipitable water content at Pune are generally made at 10–15 minute interval during daytime between 08:00 hrs to 18:00 hrs. On some days during May 2006 as special case study, data has been collected at 5–minute intervals throughout the daytime to study short–term variations, if any, in PWC. Simultaneously, surface temperature and relative humidity values have also been recorded from a hand held digital thermo–hygrometer placed in the close vicinity of the sun photometer. Adopting Butler method described above, precipitable water estimations have been done with the surface meteorological data to compare with those PWC values retrieved from sun photometer. Some typical days of observations made during the month of May 2006 have been presented in this paper to investigate in detail the temporal variations in PWC obtained from sun photometer and that estimated from surface meteorological parameters, during the transition phase of pre–monsoon summer and monsoon conditions at this tropical station. The results obtained are presented case by case and discussed.
On 5 May 2006 the sky was mostly clear in the forenoon hours and small patches of clouds started appearing in the afternoon around 14:00 h LT. Simultaneous observations of sun photometer and surface meteorological parameters are available from 10:45 until 17:00 h. Figure 9 shows temporal variation in PWC obtained from sun photometer and that estimated by Butler method. It is broadly seen that there is a very good agreement between the two observations. After 14:00 h when scattered cloud patches started appearing in the sky, both observations showed a significant increase in PWC. Precipitable water derived from sun photometer varied from 16 to about 24 mm by evening. The magnitude of PWC values is rather high and is typical of pre–monsoon/monsoon conditions. It is to be noted here that on this day, PWC values from sun photometer are higher compared to that estimated from surface parameters, unlike in the long–term averages described earlier, where Butler method estimations were almost always higher than those PWC retrieved from Microtops sun photometer.
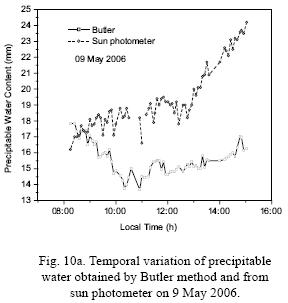
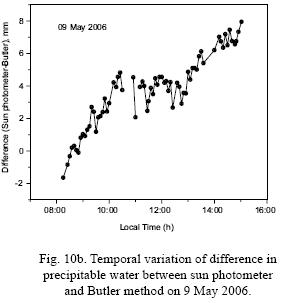
Simultaneous observations were collected at 5 minute intervals on 9 May 2006 between 08:00 and 15:00 h. Sky was clear till 10:00 h and then scattered clouds appeared from 10:25 till 12:00 h. During later part of the day the sky was clear again. Figure 10a shows temporal variation of PWC by both the methods. On this day also Microtops overestimated Butler estimations. Initially PWC from sun photometer increased very slowly till 10:00 h, whereas that estimated by Butler method showed a gradual decrease. But from around 12:00 h, both observations showed increase in PWC but sun photometer showed a more rapid increase in PWC. This is more evident when the difference in PWC by these two techniques is taken and plotted (Fig. 10b). It is seen that the difference (sun photometer–Butler) increased steadily from 08:00 to 15:00 h. One reason for this could be that additional layers of water vapor may be forming at cloud height levels in the post noontime hours, either due to convective activity or advection, which could be sensed by the sun photometer which measures extinction of ground reaching solar light in the near–IR wavelengths. Butler method of estimations takes into consideration only the surface meteorological parameters and assumes an exponential decay in moisture content. So any water vapor layers formed aloft may not be getting included in computation of total PWC by Butler method. Further, it is seen from Figure 10a that short term fluctuations are more significant in the time series of PWC obtained from sun photometer. Twelve May 2006 was an unusually clear sky day during the pre–monsoon month, with bright sunshine throughout the day. Therefore simultaneous observations were possible at 5 minute intervals from 7:25 to 18:15 h on this day. Temporal variation of PWC by the two techniques is shown plotted in Figure 11. Here it is seen that sun photometer derived values of PWC are smaller compared to the Butler estimations almost at all times of observation, as opposed to the previous two cases of observations. Both temporal variations showed a slight decrease in PWC until 10:00 h and then PWC remained more or less constant with time, especially that obtained by Butler method. Sun photometer derived PWC showed an abrupt increase for about 30 minutes around 16:30 h. It was noted that there was no cloud formation in the sky at that time but winds were strong during this period. Otherwise surface winds were light to moderate throughout the day. Some local meteorological changes or transport of water vapor due to winds could have caused this short duration increase in PWC, which was sensed only by the optical extinction method. Being a clear sky day, sun photometer derived PWC was low and between 10 and 13 mm throughout the day as compared to the PWC values observed on 5 and 9 May, which were cloudy sky days.
Observations were made between 08:15 and 18:00 h LT on 13 May 2006. Sky was clear in the forenoon hours. Clouds started appearing by 15:00 h and sky was again clear by 17:00 h. These changes in sky conditions are very much reflected in the temporal variations in PWC as observed by both the techniques (Fig. 12). PWC was low around 10 to 12 mm in the forenoon hours and there is an abrupt increase especially in sun photometer observations from 15:00 to 17:00 h when PWC increased by almost 6 mm. Temporal variations were nearly the same (in–phase) in both the observations and PWC values from sun photometer were smaller during clear sky conditions which is consistent with the results described above.
4. Summary
Precipitable water content observations made at a tropical urban station, Pune, using sun photometer for the period May 1998–May 2004, that estimated from surface meteorological parameters (temperature and relative humidity) by analytical method for the period January 1998–May 2004, and measurements of MODIS satellite for the period January 2000–May 2004, have been analyzed. The study showed the following results:
• Overall mean precipitable water content (PWC) at Pune measured by sun photometer is 13.27 mm and that estimated by Butler method from surface meteorological parameters is 20.56 mm. Thus mean PWC value estimated by Butler method is about 7 mm higher compared to that obtained from the optical method. This is mainly because of the assumptions involved in Butler method. PWC values from MODIS satellite are higher than those obtained from these two techniques.
• Day–to–day and month–to–month variations in PWC by all the three techniques are in–phase and agree very well within computational and experimental limits.
• There exists a well defined seasonal variation in PWC with maximum during SW monsoon months and minimum during winter months.
• Short term temporal variations in PWC by sun photometer and Butler method also agree very well. However sun photometer derived values are higher in magnitude during cloudy sky conditions and are lower during clear sky conditions compared to those estimated from surface meteorological parameters. Thus, good temporal resolution observations of precipitable water can be made using a well calibrated portable sun photometer operated at near–IR wavelengths during clear sky conditions.
Acknowledgements
Authors are grateful to the Director, IITM for his constant encouragement and support. Surface meteorological data for Pune station has been provided by India Meteorological Department, Pune and the same is gratefully acknowledged. Thanks are also due to Dr. R. S. Maheskumar, Dr. Y. K. Tiwari and Ms. R. Bhawar who have rendered help in making the sun photometric observations at Pune over the years.
References
Asnani A. S., 1993. Tropical meteorology. Indian Institute of Tropical Meteorology, Vol. 1, Pune, India, 1140 pp. [ Links ]
Bird R. E. and R. L. Hulstrom, 1982. Precipitable water measurements with sun photometers. J. Appl. Meteor. 21, 1196–1201. [ Links ]
Bruegge C. J., J. E. Conel, R. O. Green, J. S. Margolis, R. G. Holm and G. Toon, 1992. Water vapor column abundance retrievals during FIFE. J. Geophys. Res. 97, 18759–18768. [ Links ]
Butler B., 1998a. Precipitable Water at VLA 1990–1998. MMA Memo. No. 237. [ Links ]
Butler B., 1998b. Precipitable Water at KP 1993–1998. MMA Memo. No. 238. [ Links ]
Ernest Raj P., P. C. S. Devara, R. S. Maheskumar, G. Pandithurai, K. K. Dani, S. K. Saha, S. M. Sonbawne and Y. K. Tiwari, 2004. Results of sun photometer derived precipitable water over a tropical Indian station. J. Appl. Meteorol. 43, 1452–1459. [ Links ]
Flowers E. L., R. A. McCormick and K. R. Kurfis, 1969. Atmospheric turbidity over the United States, 1961–1966. J. Appl. Meteor. 8, 955–962. [ Links ]
Fowle F. E., 1915. The transparency of aqueous vapor. Astrophys. J. 42, 394–411. [ Links ]
Halthore R. N., T. F. Eck, B. N. Holben and B. L. Markham, 1997. Sun photometric measurements of atmospheric water vapor column abundances in the 940 nm band. J. Geophys. Res. 102, 4343–4352. [ Links ]
Hanel G., 1972. Computation of the extinction of visible radiation by atmospheric aerosol particles as a function of the relative humidity, based upon measured properties. J. Aerosol Sci. 3, 377–386. [ Links ]
Ichoku C., R. Levy, Y. J. Kaufman, L. A. Remer, L. Rong–Rong, V. J. Martins, B. N. Holben, N. Abuhassan, I. Slutsker, T. F. Eck and C. Pietras, 2002. Analysis of the performance characteristics of the five–channel Microtops II sun photometer for measuring aerosol optical thickness and precipitable water. J. Geophys. Res. 107, D13, 10.1029/2001JD001302, 2002. [ Links ]
Ingold T., B. Schmid, C. Matzler, P. Demoulin and N. Kampfer, 2000. Modeled and empirical approaches for retrieving columnar water vapor from solar transmittance measurements in the 0.72, 0.82 and 0.94 mm absorption bands. J. Geophys. Res. 105, 24327–24343. [ Links ]
Liebe H. J., 1989. MPM – an atmospheric millimeter wave propagation model. Int. J. Infr. Mill. Waves 10, 631–650. [ Links ]
Michalsky J. J., J. C. Liljegren and L. C. Harrison, 1995. A comparison of sun photometer derivations of total column water vapor and ozone to standard measures of same at the Southern Great Plains Atmospheric Radiation Measurement site. J. Geophys. Res. 100, 25995–26003. [ Links ]
Morys M., F. M. Mims III, S. Hagerup, S. E. Anderson, A. Baker, J. Kia and T. Walkup, 2001. Design, calibration, and performance of Microtops II handheld ozone monitor and sun photometer. J. Geophys. Res. 106, 14573–14582. [ Links ]
Parameswaran K. and B. V. Krishna Murthy, 1990. Altitude profiles of tropospheric water vapour at low latitudes. J. Appl. Meteorol. 29, 665–679. [ Links ]
Peixoto J. P. and A. H. Oort, 1983. The atmospheric branch of the hydrological cycle and climate. In: Variations in the global water. (A. Budget, M. Street–Perrott, M. Beran and R. Ratcliff, Eds.). D. Reidel Publ. Co., Dordrecht, Holland, 5–65. [ Links ]
Pitts D. E., W. E. McAllum, M. Heidt, K. Jeske, J. T. Lee, D. DeMonbrun, A. Morgan and J. Potter, 1977. Temporal variations in atmospheric water vapor and aerosol optical depth determined by remote sensing. J. Appl. Meteor. 16, 1312–1321. [ Links ]
Reagan J. A., K. Thome, B. Herman and R. Gall, 1987. Water vapor measurements in the 0.94 micron absorption band. Calibration, measurements and data applications, Proc. Int. Geoscience and Remote Sensing Symp. IGRSS, Ann Arbor, MI, 63–67. [ Links ]
Schmid B., K. J. Thome, P. Demoulin, R. Peter, C. Matzler and J. Sekler, 1996. Comparison of modeled and empirical approaches for retrieving columnar water vapor from solar transmittance measurements in the 0.94 mm region. J. Geophys. Res. 101, 9345–9358. [ Links ]
Shettle E. P. and R.W. Fenn, 1979. Models for the aerosols of the lower atmosphere and the effects of humidity variations on their optical properties. Air Force Geophysical Laboratory Tech. Rep. AFGL–TR–79–0214, 94 pp. [ Links ]
Thome K. J., B. M. Herman and J. A. Reagan, 1992. Determination of precipitable water from solar transmission. J. Appl. Meteor. 31, 157–165. [ Links ]
Tomasi C. and R. Guzzi, 1974. High precision atmospheric hygrometer using the solar infrared spectrum. J. Phys. E: Sci. Instrum. 7, 647–649. [ Links ]
Volz F. E., 1969. Some results of turbidity networks. Tellus 21, 626–629. [ Links ]
Volz F. E., 1974. Economical multispectral sun photometer for measurements of aerosol extinction from 0.44 µm to 1.6 µm and precipitable water. Appl. Opt. 13, 1732–1733. [ Links ]

