


Serviços Personalizados
Journal

Artigo
 Inglês (pdf)
 Artigo em XML
 Referências do artigo
 Enviar este artigo por email
Indicadores
 Citado por SciELO
 Links relacionados
-
 Similares em
SciELO
Similares em
SciELO
Compartilhar

 Permalink
Atmósfera
versão impressa ISSN 0187-6236
Atmósfera vol.21 no.3 Ciudad de México Jul. 2008
Temporal and spatial behavior of temperature and precipitation during the canícula (midsummer drought) under El Niño conditions in central México
A. R. PERALTA–HERNÁNDEZ, L. R. BARBA–MARTÍNEZ
Centro de Ciencias Agropecuarias, Universidad Autónoma de Aguascalientes,
Jesús María, Aguascalientes, México
Corresponding author: A. R. Peralta–Hernández; e–mail: arperal@correo.uaa.mx.
V. O. MAGAÑA–RUEDA
Centro de Ciencias de la Atmósfera, Universidad Nacional Autónoma de Mexico,
Circuito Exterior, Ciudad Universitaria, México, D. F., 04510 México
A. D. MATTHIAS
Department of Soil, Water and Environmental Science, The University of Arizona,
Tucson, Arizona, USA
J. J. LUNA–RUÍZ
Centro de Ciencias Agropecuarias, Universidad Autónoma de Aguascalientes,
Jesús María, Aguascalientes, México
RESUMEN
Relativamente pocos estudios se han realizado en relación al inicio, duración e intensidad de la canícula (sequía de medio verano) en respuesta a los eventos de El Niño Oscilación del Sur (ENOS) en el centro de México. El objetivo de nuestra investigación es evaluar el impacto de ENOS durante la fase de El Niño (EN) sobre la temperatura del aire (T), precipitación (PP) y el índice de sequía (IS = PP/T) durante el período de la canícula. Para lo anterior, se promediaron los datos diarios de temperatura y precipitación de estaciones climatológicas localizadas en el centro de México, durante ocho periodos consecutivos de 10 (u 11) días en los veranos de 1960 a 1998. Los datos se agruparon en siete regiones climáticas de acuerdo a un criterio de precipitación. Las comparaciones estadísticas entre años EN y N para las siete regiones se hacen con los promedios de T, PP e IS durante el verano. Los resultados indican que la fase de EN incrementa significativamente la temperatura del aire en las regiones más húmedas. EN también aumenta la precipitación durante el verano en cinco de las regiones, aunque no significativamente. La precipitación de verano durante EN no reduce el índice de sequía, con la excepción de breves intervalos dentro de las regiones más húmedas. En general, durante los años EN y N la canícula inicia alrededor del 11 de julio y termina el 31 de agosto.
ABSTRACT
Relatively few studies have been performed about the onset, duration, and intensity of the canícula (midsummer drought) within central México in response to El Niño/Southern Oscillation (ENSO) events. The objective of our research is to assess the impact of the El Niño (EN) phase of ENSO upon air temperature (T), precipitation (PP), and drought index (DI = PP/T) during the canícula period. Daily air temperature and precipitation data from weather stations throughout central México are averaged for eight consecutive 10 (or 11)–day periods during the summers of 1960 through 1998. The data are grouped into seven climate regions according to specific precipitation criteria. Statistical comparisons between EN and neutral (N) years for the seven regions are made with pooled average T, PP and DI values from the summer. Results indicate that the EN phase significantly increases air temperatures within the wetter climate regions. The El Niño phase also increases summer precipitation within five of the regions, though not significantly. The added summer rainfall during El Niño phase does not reduce drought intensity with the exception of brief intervals within the wetter regions. Roughly, during EN and N years the canicula begins on July 11 and ends on August 31.
Keywords: Canícula, midsummer drought, El Niño, precipitation, temperature, drought index.
1. Introduction
The El Niño/Southern Oscillation (ENSO) phenomenon is a natural part of the global climate system and results from large scale ocean–atmosphere interactions that mainly occur in the tropical eastern Pacific (Allan et al., 1996). The most direct climatic variations and environmental impacts are observed in countries around the Indo–Pacific sector of the planet (Ropelewski and Halpert, 1987, 1989; Halpert and Ropelewski, 1992; Allan et al., 1996).
The eastern Pacific Ocean region, known as Niño–3.4 (4° N – 4° S latitude and 150 – 90° W longitude), corresponds to a locus where atmospheric teleconnections begin as quasi stationary waves that span into the western coast of both North and South America (Magaña and Ambrizzi, 2005). The ENSO is an irregular and aperiodic phenomenon that tends to occur every two to seven years and is characterized by a warm phase named El Niño (EN) and a cold phase named La Niña (LN). Once it begins, the average event lasts 18 to 24 months and shows features of being strongly associated with the seasonal cycle (Philander, 1985, 1989; Yasunari, 1985; Allan et al., 1996). Years between El Niño and La Niña are named neutral (N). According to Rasmusson (1985), Gray (1993), Glantz (1998), Barry and Chorley (1998) and Magaña (1998), El Niño builds up when there is an abnormal warming of the waters in the eastern tropical Pacific Ocean. This process is characterized by the change of direction of the easterly winds, which weaken or even become westerly winds. These conditions cause atmospheric instability off the South America coast, producing intense precipitation and flooding over the coast of Perú and Ecuador. However, in other regions such as Australia or Indonesia, extreme hot and dry conditions are experienced.
In central México, the summer rainy season, along with hurricanes and easterly waves begins by late May or early June (Magaña et al., 2003). It presents a bimodal distribution of precipitation with maxima in June and September, and a relative minimum in July and August, known as canícula or midsummer drought (Mosiño and García, 1966; Coen, 1973; Magaña, 1998). The canícula onset appears to vary according to the region where it is detected. In central México the canícula occurs from roughly the third week of July through the third or fourth week of August. According to farmers' anecdotal observations, the canícula begins on 14 July and ends on 24 August. Rain fed agricultural production and water resource management are especially sensitive to year–to–year climate variations during the canícula, which has important socio–economic implications for the region.
Magaña et al. (1999, 2003) proposed that air–sea interactions in the northeast Pacific warm pool control sea surface temperature (SST) fluctuations, which in turn modulate tropical convective activity over the Intertropical Convergence Zone (ITCZ) region. According to Magaña et al. (2003) during EN years, the meridional thermal contrast between the cold tongue area and the warm pool off the coast of México weakens; the ITCZ remains closer to the abnormally warm waters off South America and subsidence inhibits convective activity over México. The trade winds over the Caribbean are more intense, favoring anticyclonic circulations over México and thus, less rainfall inland. In neutral years the SST contrasts between the cold tongue off the Peruvian coast and the warm pool in the Pacific Ocean produce a meridional flow that converges over the ITCZ bringing moisture off the Mexican coast.
Prior to the onset of the summer rainy season (late May) sea surface temperatures in the NE Pacific reach a maximum around 30 °C. During June, SST slightly cool down (< 28 °C) due to a reduction in solar radiation caused by increased cloud cover. These processes result in less favorable conditions for convective activity and a relative minimum in precipitation off and along the Pacific coast of Mesoamerica. During July and August, due to fewer clouds and more solar radiation reaching the surface, SST tends to raise above 28 °C, and, by September a second maximum in convective activity and precipitation occurs.
Scientific studies on El Niño canícula relationships in México are relatively scarce. Pereyra et al. (1994) found that during El Niño, precipitation in Veracruz State increases causing the mid–summer drought to diminish or disappear in the central highlands. According to Tiscareño et al. (1998), Tiscareño et al. (2003) negative precipitation anomalies are present during El Niño years in most parts of México, resulting in a relatively less clear canícula signal. In contrast, Alcalá et al. (2005) found that during El Niño years the canícula in Jalisco is longer and drier than in non–El Niño years. According to these authors, atmospheric observations made during August and September showed that northerly winds are blocked during El Niño years, causing a high–pressure system over the American continent with subsidence of dry and warm air.
The main focus of this study is on improving our understanding of the intensity and behavior of the canícula during El Niño and neutral years. Weather conditions during the summer months are critically important because it is then that rain fed crops, representing 80% of farming land in central México, are in full development. Relative drought during that time can cause yield loss or crop failure. In order for farmers to better manage their crops in central México, it is important to know how the canícula intensity and duration varies during the above periods.
2. Methodology
2.1 Study area
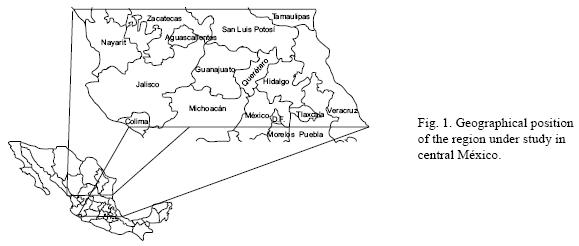
The study area in central México is located between 19 and 23° N latitude and between 98° and 106° W, and 105 and 94° W longitude (Figs. 1 and 2). This area is surrounded by two major mountain ranges, the Sierra Madre Oriental and the Sierra Madre Occidental. The former is a mountain range in eastern México, spanning 1200 km long, 150 km average width, and 1500 m average altitude. The latter is an imposing mountain range in western México, spanning 1250 km long, 150 km average width, and 2000 m average altitude (Sánchez, 1991). These geographic features greatly influence the spatial and temporal patterns of precipitation and temperature within central México, mainly due to the blocking for the entrance of moisture from both oceans: the Pacific and the Gulf of México. Most of the inner states in this study area are located in the Meridional plateau with an average altitude of ~2000 m; other states are on the opposite side of the mountains closer to the oceans and have lower elevations.

Because the weather stations used in this study are distributed across a wide range of climates and orographic features, it is difficult to classify them into geographic subregions. However, in subregions following the annual march of precipitation, Cavazos and Hastenrath (1990) and Peralta (2001) were able to examine the ENSO effects on precipitation and temperature patterns in central México.
2.2 El Niño and neutral years classification
Monthly sea surface temperature data from the Climate Prediction Center (CPC, 2003) were used to classify El Niño and neutral years during the period 1960 to 1998. According to the Japan Meteorological Agency (JMA, 2003) an El Niño event occurs when the 5–month running mean (from October to February) of the spatially averaged tropical Pacific sea surface temperature anomaly (SSTA) satisfies the criterion: 0.5 < SSTA < 2 °C. A neutral year occurs when –0.5 < SSTA < 0.5 °C (Izaurralde et al., 1999) and a La Niña year occurs when SSTA < –0.5 °C. Overall, 14 of the years from 1960 to 1998 were classified as El Niño and 13 were classified as neutral years (Fig. 3). The remaining years, such as 1964–1965 and 1967–1968, were thus classed as La Niña years. To classify El Niño and neutral years we followed the JMA (2003) criteria to characterize the 5–month study from October through February, and used the SST indices derived from spatially–averaged SST anomalies over the tropical Pacific from the Climate Prediction Center (CPC, 2003).

2.3 Temperature and precipitation data
The daily air temperature and precipitation data from 116 weather stations were obtained from the ERIC II (quick extractor of climatic information) dataset from the Instituto Mexicano de Tecnología del Agua (IMTA, 2000). To ease analysis and interpretation, the daily data were grouped into 36 periods of 10 (or 11) days throughout the calendar year for the El Niño and neutral years. The focus of this analysis, however, was on the eight 10 (or 11) day periods of the summer (periods 18 to 25; Table I). Even though the canícula extends roughly 40 days during July and August, the analysis covered 82 days of the summer season ranging from the last 10–day period of June to the first 10–day period of September. This was done in order to designate the onsets of the rainy season and the canícula. A Student–t test, with statistical significance (p < 0.05) was performed on the temperature and precipitation averages during the canícula in order to determine if significant differences occurred between El Niño and neutral years.

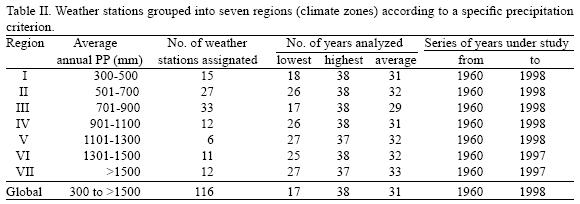
The study area has diverse climates ranging from tropical and subtropical to arid and semiarid, so that the stations were grouped into seven regions following precipitation criteria (200 mm increments). Table II shows the number of weather stations along with the range and average of number of years of data analyzed. It also shows the series of the years under study for each region and the precipitation range criterion. Weather stations with 30% or more of daily missing data were eliminated from the data set and stations with continuous gaps of three or more years of data were discarded.
2.4 Data analysis during El Niño versus neutral years
The effects of El Niño on the canícula's intensity were independently analyzed for each of the seven regions. The analysis included the periods shown in Table I, which covers 82 days from June 21 to September 10.
An arbitrary Drought Index (DI) was used to evaluate canícula severity during El Niño and neutral years. This index is based upon work by De Martonne (1926) and Koeppen (1948) who used the ratio of annual average air temperature and accumulated precipitation to assess drought. In the present work the index was adopted for shorter timescales, i.e. over 10 (or 11)–day periods.
DI = PP/T
PP = accumulated precipitation (mm)
T = average air temperature (°C)
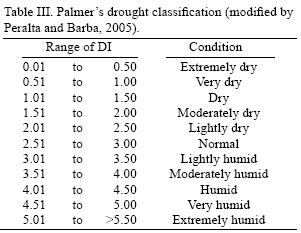
To assess the severity of the relative drought during the canícula (e.g. extremely dry to extremely humid) we used the DI classification of Peralta and Barba (2005), as shown in Table III. Also, to classify the drought index for each period, the corresponding mean DI composites for El Niño and neutral years in each region were compared for each period for the same region and the differences were tested for statistical significance. Index values equal or lower than the mean were classified as dry periods; values higher than the mean were classified as wet periods.
3. Results
Averages of air temperature, accumulated precipitation, and drought index for the summer season and their statistical comparisons between El Niño and neutral years are given in Tables IV, V–A, V–B, and V–C for each region (I to VII). The averages in Table IV were calculated from 112 values for El Niño conditions and 104 values for neutral conditions. Temperature averages in Tables V–A to V–C [VA, VB and VC], were calculated from daily values of maximum (Tmax) and minimum (Tmin) temperatures for each 10 (or11)–day period. The results of statistical comparisons (Tables V–A to V–C) [VA, VB and VC] were made for the overall averages of the pooled values for all years of either El Niño (14 years) or neutral (13 years) conditions in each region.

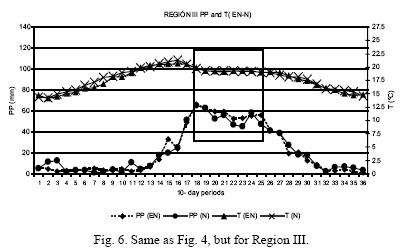
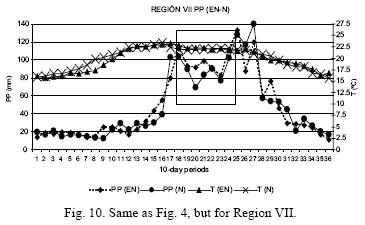
Figures 4 to 10 (Figures 4, 5, 6, 7, 8, 9, and 10) illustrate how the average temperature and accumulated precipitation values varied throughout the calendar year for each climate region and for El Niño versus neutral years. Also shown for reference in each figure is the period of time studied for analysis of the canícula behavior (periods 18 to 25). Note that the canícula extends from about period 20 through 24. Overall, there were no statistically significant differences in temperature, precipitation and drought index between El Niño and neutral years (p < 0.05) (Tables V–A to V–C). There were, however, significant differences between El Niño and neutral years in individual periods for each region as summarized within the following sections.
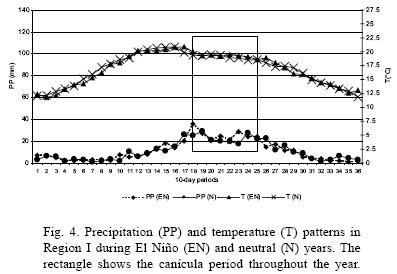


3.1 Precipitation patterns
In all regions the driest periods were the 20 through the 24 (from July 11 to August 31), which coincided closely with the canícula duration originally proposed in Section 1. The precipitation patterns are similar within each of the following three groups of regions: regions I and II (Figs. 4 and 5); regions III and IV (Figs. 6 and 7); and regions V, VI and VII (Figs. 8, 9 and 10). In regions I and II, the rainfall is relatively constant with time during the canícula. In regions III and IV, period 18 is wettest, followed by a gradual decline in rainfall. In regions V, VI and VII, period 18 is relatively the driest with precipitation thereafter increasing to periods 24 and 25.
Figures 11 and 12 show the isohyets of summer precipitation (May–October). Weather stations in the driest climate regions (I and II) were mainly in the Mexican plateau between the two major mountain ranges. Regions III and IV comprise stations located in both the southern part of the central plateau and coastal areas. The wettest regions V–VII comprise stations along coastal areas.


3.2 Temperature patterns
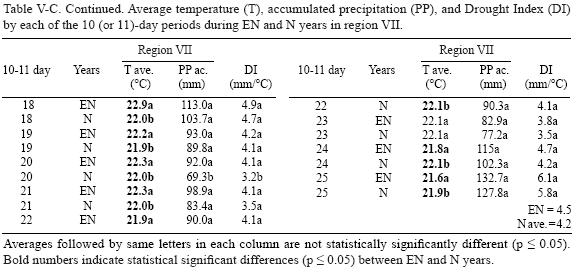
Results from the dry regions (I–III) in region I (Figs. 4–6 [4, 5 and 6] and Table V–A) indicate that El Niño had almost no impact upon air temperature during summer months except for periods 18 and 22. In region II, the temperature was significantly (p < 0.05) cooler during El Niño years in periods 21 and 23. Similarly, in region III, El Niño affected temperatures during periods 21, 24 and 25 where it was either significantly warmer or cooler than neutral years. However, for the wet regions (IV–VII) El Niño years were significantly (p < 0.05) warmer in nearly all of the periods during the canícula (Figs. 7–10 [7, 8, 9 and 10] and Tables V–B and V–C).
3.3 Drought behavior
The average drought index showed significant difference in region I and period 23 (Table V–A) where it decreased from relatively "dry" conditions (DI = 1.5 mm/°C) during El Niño years to "very dry" conditions (DI = 0.9 mm/°C) during neutral years. The difference of average precipitation between El Niño and neutral years was only 11.1 mm, which may, however, significantly reduce yields in some crops.
The average drought index showed significant difference in region VI for period 23 (Table V–B) where it decreased from "relatively humid conditions" (4.4 mm/°C) during El Niño years to "lightly humid" (3.4 mm/°C) conditions during neutral years. The precipitation difference was 27.6 mm. The drought index also showed statistical difference in region VII for period 20 (Table V–C), where it decreased from "humid" (4.1 mm/°C) during El Niño years to "lightly humid" (3.2 mm/°C) during neutral years. The precipitation difference was 22.7 mm. Regions II–V did not show any significant difference in drought index.
4. Discussion and conclusions
Previous sections show that El Niño did not markedly affect the precipitation patterns during the canícula within the seven regions under study. Temperature was a more sensitive parameter significantly affected by El Niño conditions in portions of the study area. In general, El Niño proved warmer than neutral years mainly in the wetter regions (IV–VII). Although not statistically significant, El Niño years provided more rainfall than neutral years.
Our findings are similar to those of Magaña et al. (1999, 2003) who found that the signal of the canícula is weak during El Niño years in central and northern México, where the precipitation pattern shows a unique summer peak, characteristic of the Mexican monsoon.
Our findings are also in agreement with those of Pereyra et al. (1994) who found that during El Niño years, the canícula effect decreases or even disappear for most of Veracruz State. Even though our results for regions VI and VII (Tables V–B and V–C) where Veracruz is located do not show significant differences except for the period 23 in Region VI and period 20 in Region VII for El Niño and neutral years. This fact suggests that more rain occurs more during El Niño years than during neutral years.
Even though the average air temperature showed statistical difference between El Niño and neutral years for most of the regions, it did not significantly alter the overall drought index. This implies that the drought index is primarily affected by precipitation in central México.
Crop damage caused by a decrease in precipitation during the canícula varies mainly with geographical location, crop species and planting date. Thus, it is important to advise farmers before they begin seeding about the risks associated with canícula behavior in central México; they should try to accommodate their field–related activities to fit more adequately within a new planting schedule, if necessary.
References
Alcalá J. B., E. García, O. H. Ramírez, A. R. Meulenert and M. García. 2005. Sequía de medio verano (canícula) durante la presencia de "El Niño/Oscilación del Sur" (ENOS) en el estado de Jalisco. XI Congreso Latinoamericano e Ibérico de Meteorología. Memoria en CD. Cancún, Quintana Roo, México. [ Links ]
Allan R. J, J. A. Lindesay and D. E. Parker, 2000. ENSO and climate variability in the past 150 years. In: El Niño and the southern oscillation, Multiscale Variability and Global and Regional Impacts. (H. F. Díaz and V. Markgraf, Eds.). Cambridge, UK, 3–56. [ Links ]
Barry R. G. and R. J. Chorley, 1998. Atmosphere, Weather and Climate. 7th ed. Routledge, Great Britain, 409 pp. [ Links ]
Cavazos T. and S. Hastenrath, 1990. Convection and rainfall over México and their modulation by the southern oscillation. Int. J. Climatol. 10, 377–386. [ Links ]
CPC, 2003. Monthly atmospheric and SST indices. Climate Prediction Center (ftp://ftp.cpc.ncep.noaa.gov/wd52dg/data/indices/sstoi.indices). Consulted on May, 2003. [ Links ]
Coen E., 1973. El folklore costarricense relativo al clima. Rev. Univ. Costa Rica 35, 135–145. [ Links ]
De Martonne E., 1926. L'indice d'aridite. Comptes Rengues de l'Academie des Sciences. Paris, 186 pp. [ Links ]
Glantz, M. H., 1998: Corrientes de Cambio: El Impacto de "El Niño" sobre el Clima y la Sociedad. Translation of "Currents of Change" by Rodrigo H. Nuñez, published by Servicio Hidrográfico y Oceanográfico de la Armada de Chile. Limited copies available free of charge. Write to M. H. Glantz, PO Box 3000, Boulder, CO 80307; email: glantz@ucar.edu [ Links ]
Gray W. M., 1993. Forecast of Atlantic seasonal hurricane activity for 1993. Fort Collins, CO. Department of Atmospheric Sciences, Colorado State University. [ Links ]
Halpert M. S. and C. F. Ropelewski, 1992. Surface temperature patterns associated with the southern oscillation. J. Climate 5, 577–593. [ Links ]
IMTA, 2000. ERIC II: Extractor rápido de información climatológica versión 2.0. Instituto Mexicano de Tecnología del Agua, México. [ Links ]
Izaurralde R. C., N. J. Rosenberg, R. A. Brown, D. M. Legler, M. Tiscareño–L. and R. Srinivasan, 1999. Modeled effects of moderate and strong "Los Niños" on crop productivity in North America. Agric. Forest Meteorol. 94, 259–268. [ Links ]
JMA, 2003. Japan Meteorological Agency. http://ddb.kishou.go.jp/climate/ElNino/elmonout.html. Consulted on April, 2003. [ Links ]
Koeppen, 1948. W. Climatología. Fondo de Cultura Económica. México, 213 pp. [ Links ]
Magaña V. O., 1998. Climatología de México. En: Los impactos de El Niño en México (V. Magaña, Ed.). Centro de Ciencias de la Atmósfera, UNAM. México, 228 pp. [ Links ]
Magaña V. O., J. A. Amador and S. Medina. 1999. The midsummer drought over México and Central America. J. Climate 2, 1577–1588. [ Links ]
Magaña V. O., J. L. Vázquez, J. L. Pérez and J. B. Pérez. 2003. Impact of El Niño on precipitation in México. Geofís. Int. 42, 313–330. [ Links ]
Magaña V. O. and T. Ambrizzi, 2005. Dynamics of subtropical vertical motions over the Americas during El Niño boreal winters. Atmósfera 18, 211–234. [ Links ]
Mosiño A. P. and E. García, 1966. Evaluación de la sequía intraestival en la República Mexicana. Conferencia Regional Latinoamericana, Unión Geográfica Internacional, 3, 500–516. Ciudad de México, 9–15 de agosto. [ Links ]
Peralta–H. A. R., 2001. El Niño southern oscillation (ENSO) effects on hydroecological parameters in Central México. Ph. D. Dissertation. The University of Arizona, 157 pp. [ Links ]
Peralta–H. A. R. and L. R. Barba–M., 2005. Efecto de El Niño Oscilación del Sur (ENOS) en la actividad de ciclones y variación climática en la franja central de México. Universidad Autónoma de Aguascalientes. México, 56 pp. [ Links ]
Pereyra D. D., A. C. Córdova and B. Palma, 1994. Effect of ENSO on the mid–summer drought in Veracruz, State, México. Atmósfera 7, 211–219. [ Links ]
Philander S. G. H., 1985. El Niño and La Niña. J. Atmos. Sci. 42: 2652–2662. ENSO and Climate Variability in the past 150 years. In: El Niño and the Southern Oscillation, 2000. (H. F. Diaz and V. Markgraf, Eds.). Cambridge, UK, 496 pp. [ Links ]
Philander S. G. H., 1989. El Niño and La Niña. American Scientist 77, 451–459. [ Links ]
Rasmusson E. M. 1985. El Niño and variations in climate. American Scientist 73, 168–177. [ Links ]
Ropelewski C. F. and M. S. Halpert, 1987. Global and regional scale precipitation patterns associated with El Niño/southern oscillation. In: El Niño and the Southern Oscillation, multiscale variability and global and regional impacts, 2000. (H. F. Diaz and V. Markgraf, Eds.). Cambridge University Press, UK, 496 pp. [ Links ]
Ropelewski C. F. and M. S. Halpert, 1989. Precipitation patterns associated with the high index phase of Southern Oscillation. J. Climate 2, 268–284. [ Links ]
Sánchez M. A., 1991. Síntesis geográfica de México. 1a. reimpresión. Trillas. México, 265 pp. [ Links ]
Tiscareño–L. M., N. J. Rosenberg, D. M. Legler, A. Ruíz, R. Shrinivasan, R. A. Brown, G. García, M. A. Velázquez and R. C. Izaurralde, 1998. Algunos efectos del fenómeno climático El Niño en la agricultura mexicana. Ciencia y Desarrollo XXIV, 5–12. [ Links ]
Tiscareño–L. M., C. Izaurralde, N. J. Rosenberg, A. D. Báez and J. Salinas, 2003. Modeling El Niño southern oscillation climate impact on Mexican agriculture. Geofís. Int. 42, 331–339. [ Links ]
Yasunari T., 1985. Zonally propagating modes of the global east–west circulation associated with the southern oscillation. J. Meteorol. Soc. Japan 65, 67–80. [ Links ]

