


Services on Demand
Journal
Article
 English (pdf)
 Article in xml format
 Article references
 Send this article by e-mail
Indicators
-
 Cited by SciELO
 -
 Access statistics
Related links
-
 Similars in
SciELO
Similars in
SciELO
Share

 Permalink
Atmósfera
Print version ISSN 0187-6236
Atmósfera vol.21 n.1 Ciudad de México Jan. 2008
Impact of the use of segregated streets in the elemental carbon concentrations in Santiago de Chile
E. GRAMSCH
Departamento de Física, Universidad de Santiago,
Avda. Ecuador 3493, Santiago, Chile
Corresponding author; e–mail: egramsch@lauca.usach.cl
P. OYOLA
Centro Mario Molina Chile, Avda. del Valle 662, Santiago, Chile
D. VON BAER
Departamento de Química, Universidad de Concepción,
Concepción, Chile
I. ORMEÑO
Departamento de Física, Universidad de Santiago
Avda. Ecuador 3493, Santiago, Chile
Received December 23, 2006; accepted September 10, 2007
RESUMEN
Las altas concentraciones de material particulado que se observan en Santiago de Chile durante el invierno han impulsado al gobierno a implementar varias medidas para reducir la contaminación. Una de las estrategias fue cambiar las direcciones de tránsito, y los privilegios en varias calles. La avenida principal (Alameda) con cinco líneas por lado, fue segregada de tal manera que en tres de ellas, sólo pueden circular buses públicos y las otras dos pueden ser utilizadas por los demás vehículos. Al circular los buses más libremente, pueden reducir sus emisiones. Durante el invierno del 2001, se han determinado las concentraciones de carbono elemental (CE) en la Alameda y varias otras calles con un equipo que mide la absorción óptica del aire construido en la Universidad de Santiago. El pico de la hora punta de la mañana puede verse claramente todos los meses del año, indicando que la influencia del tráfico es alta. La concentración de CE durante la hora punta representa en promedio un 25% de la concentración total. Además, el promedio de concentraciones de carbono elemental en las vías sin tráfico segregado durante la hora punta es más alto que el aumento en las vías segregadas. Sin embargo, la gran variabilidad en los datos no nos permite concluir con significancia estadística que hay una reducción en la contaminación por CE durante la hora punta. Se han determinado las concentraciones de CE en cuatro estaciones, y dos de ellas tienen concentraciones más altas, las otras dos tienen valores menores que dependen de la ubicación dentro de la ciudad. Estos resultados permiten dibujar los límites aproximados de un sector con altas concentraciones de carbono elemental.
ABSTRACT
The high particle concentrations that are observed in Santiago de Chile during winter have prompted the government to pursue several approaches to reduce the contamination. One of these strategies was to change the traffic direction, and privileges in several streets. The main avenue (Alameda), which has 5 lanes each way, was segregated such that in three of them, only public buses can circulate and the other two lanes can be used by other vehicles. The objective is that the buses can circulate more freely, thus reducing emissions. During winter of 2001, we have measured the elemental carbon (EC) concentration along Alameda Avenue and several other streets with a light–absorption coefficient equipment built at the University of Santiago. The morning rush hour peak can be seen for all months indicating that the influence of traffic in this area is high. The EC concentration during rush hour represents an average of 25% of the total concentration. In addition, the average in EC concentration (for all months) due to rush hour traffic is higher in the street with no segregated traffic than the other two stations that have segregated traffic. However, the large variability in the data does not allow concluding with statistical significance that there is a reduction in EC pollution during rush hour. The average values of the elemental carbon concentration in 4 stations have been measured, and two of them show high values, the other two show lower values that depend on the location across the city. These results, allow drawing approximately the limits of an area with high elemental carbon concentration.
Keywords: Traffic, diesel emissions, elemental carbon, light absorption coefficient.
1. Introduction
Santiago de Chile has severe air pollution problems during winter, partly due to strong temperature inversions and low wind speeds, and partly due to the rapid growth of the city. Santiago has about 5 million inhabitants and it is located in a valley surrounded by the Andes mountains on the east side and several high hills on the west and north sides. As a consequence of the activities of the city and its topography, particle concentration levels are one of the highest in South America (Kavouras et al., 1999; Artaxo et al., 1999). The coarse particulate matter can reach up to 500 |a,g/m3 on days with strong inversion (CONAMA, 2003). Fine particle (PM2.5), elemental (EC) and organic carbon (OC), and carbon monoxide (CO) levels are also quite high (Gramsch et al., 2006). The health problems associated with high pollution levels are also well known. In Santiago, increases in respiratory deseases in children a few days after high pollution episodes are common (Ilabaca et al., 1999; Lee et al., 2000). There are also several studies relating the effects of pollution on daily mortality in Santiago (Sanhueza et al., 1999; Ostro et al., 1999; Cifuentes, 2000). The seriousness of the problem prompted the authority to enact a Plan for Prevention and Decontamination of the Metropolitan Area in Santiago (PPDA). Under this plan, that began in 1996, several control strategies have been implemented: A gradual replacement of the old fleet of buses, most industries in the Metropolitan Region had to reduce their emission and are permanently monitored, most wood stoves can not be used, restriction to circulate one day per week (not including weekends) from March to December for all passenger vehicles without catalytic converted was implemented, many streets were paved, biomass burning in farms was restricted in an extended area around the metropolitan area, etc. To monitor the effectiveness of theses control strategies, a city wide monitoring network was laid down in 1997 (Macam Network). The network has eight stations that monitor PM10, CO, SO2 and O3 with one hour intervals. Some stations also measure elemental and organic carbon, NOx and PM2.5. At the same time, the Chilean legislature through the Comisión Nacional del Medio Ambiente (CONAMA) established a program to forecast PM10 concentrations and to inform the public of impending health impact. This model is currently being used during the winter period (April to September) to establish restrictions to traffic, linked to the severity of the forecasted PM10 levels. During days with high pollution levels additional restrictions apply, according to the last digit in the license plate.
In April of 2001, sulphur levels in the diesel fuel was reduced from a maximum of 1200 to 300 ppm, and the maximum level of lead in diesel fuel was also reduced from 300 to less than 5 ppm. This change is very important because a large fraction of the elemental carbon and fine particle pollution in Santiago is due to the buses for public transportation, which use diesel fuel. A study conducted by the CONAMA indicated that approximately 21% of the fine particle concentration is due to public transportation (Jorquera et al., 1998). Another control measurement recently established is the change in the traffic direction of several streets according to the time of day and strength of the vehicular flux. In Santiago there are a large number of people going to work from the periphery to downtown. Therefore, several two–way streets have direction towards downtown in the morning (7:30–10:00 h) and towards the periphery in the afternoon (17:00–21:00 h). The most important street in Santiago, Avenida Libertador Bernardo O'Higgins (Alameda avenue) was segregated such that three lanes are exclusive for use by public transportation buses and the rest of vehicles can use the other two lanes. The uses of other streets were changed such that only public transportation can circulate during the morning rush hour (7:30–10:00 h). The objective of this change in direction and segregation was to reduce congestion and improve the average driving speed of vehicles. This fact reduces the emission levels because greater particulate mass emission occurs during acceleration. The segregation of the lanes in Alameda was aimed at improving the average driving speed of public buses that run exclusively on diesel fuel. Because a large fraction of the fine particle mass (PM2.5) in Santiago comes from this source (Kavouras et al., 1999), improving driving speeds should reduce it. A large fraction of the fine particles emitted by diesel buses corresponds to elemental carbon, which in turn is the component that has the largest light absorption coefficient (σa ) in the aerosol (Horvath, 1993). Thus a good tracer for the emission from the diesel buses is the light absorption coefficient.
In order to get a better understanding of the dynamics of pollution in downtown Santiago, we have performed a study integrating several instruments to measure the effect of traffic restrictions in the local particle mass concentration. The Macam Network has three stations near downtown that provide measurements of PM10, PM2.5 and organic and elemental carbon. The network has been complemented with 5 instruments that measure the light absorption coefficient, placed close to the streets with modified traffic conditions. By integrating results from all these instruments, we expect to determine the impact of the implementation of segregated streets and the change in traffic direction on the emission pattern and quantity in Santiago.
2. Experimental methods
2.1 Instrumentation
The study was performed using instruments that belong to the citywide monitoring network (Macam Network) and several low–cost light absorption coefficient systems (Simca) built at the University of Santiago (Usach) (Gramsch et al., 2000). AllstationsarelocatedinopenspacesandAll stations are located in open spaces and the meteorological parameters were measured at a height of 3 m from the ground.
Coarse particle mass PM10 and fine particle mass PM2.5 were measured with Tapered Element Oscillating Microbalance (TEOM) monitors available at the Macam Network stations. These instruments utilize an oscillating hollow tube with the free end attached to a filter element. As the filter mass changes due to accumulation of particles, the oscillating frequency changes providing a measurement of the mass. The tapered tube, filter and sampled air are kept at 50 °C and the sampling interval is set to 15 min. Carbon concentration was measured with an Ambient Carbon Particulate Monitor 5400 from Rupprecht & Patashnick Co. The last instrument allows a direct measurement of carbon through detection of the CO2 produced by high temperature oxidation of the carbon species present in the sample. A separation of the higher volatility organic carbon from the lower volatility elemental (black) carbon is achieved by thermal separation. A temperature of 340 °C is used as the separation point. Hence, the organic component is defined as the material that volatilizes from the sample below this temperature. The remaining carbon fraction corresponds to elemental carbon along with low vapor pressure, highly polymerized carbon material.
One of the strategies of the authority to reduce pollution from vehicles was to set up streets with traffic restrictions. To monitor the efficacy of this approach, we placed several instruments close the streets with restrictions. These devices measure the light absorption coefficient σa , which is very sensitive to the amount of black carbon present in airborne particles (Lin et al., 1973). Because diesel vehicles emit large amounts of black carbon, the absorption coefficient is a good tracer for pollution coming from these vehicles (Gramsch et al., 2000).
We have used an instrument built at Usach that uses a variation of the integrating plate method (Gramsch et al., 2000; Lin et al., 1973) to measure σa. The system to measure the absorption coefficient (Simca) has been described previously (Gramsch et al., 2004), but a brief account is given below. It is made up of a head containing a filter, lamp, two photodetectors and a pump. A computer controls the pump and reads the photodetectors through an interface box. The design of the head is a variation of the integrating plate method (Lin et al., 1973), which has been used to measure the absorption coefficient, σa. In our instrument, air is pumped for 1 min through a 25 mm diameter nuclepore filter (pore diameter 0.2 um) that collects particles present in the air and the intensity of light passing through the filter is measured. This process is repeated every 20 min for 2 to 5 days. In this way, we obtain one value of the absorption coefficient every 20 min. using the same filter. The hourly data are obtained by averaging three points per hour. The filter is changed when the intensity of the light reaches about 50% of the intensity with a clean filter, in order to avoid too much carbon accumulation. There is a second detector placed on the side of the filter that monitors the intensity of the lamp. The output from this detector is used to correct for changes in the lamp or gain in the amplifier due to temperature, or other effects.
2.2 Site description
The study was carried out at downtown Santiago, because this is an area with high population density and very high PM10 concentration during winter. Previous studies have shown that a considerable fraction of this pollution is due to transportation (Gramsch et al, 2000). The city has a fleet of about 7000 diesel buses for public transportation, and most of them have a route passing through downtown. These buses are not always well maintained and their emissions are high. Data from the Macam Network has been used to obtain overall pollution trends (PM10 and PM2.5) and help define sites that have a strong traffic influence. The map in Figure 1 shows the location of the stations of the Macam Network (black dots) and the location of the light absorption coefficient monitors (Simca) are shown with black crosses. All Simcas were placed near downtown in the vicinity of streets with traffic restrictions.
For policy makers, the street that is relevant to study is Alameda, because it has the highest traffic density and crosses the city from east to west. The flux in this street (both ways) in a location near the University of Santiago (Usach) station is 79200 ± 2700 vehicles per day (the average has been calculated over one week, not including Saturday or Sunday). The street has 5 lanes each way and it was segregated such that in three lanes only public buses can circulate and other types of vehicles can use the other two lanes. This restriction applies during all day. Three Simca monitors were placed along Alameda: Usach, Alameda and Providencia stations.
Usach is a station located at the Physics Department of the University of Santiago, about 100 m north from the main street (Alameda), and about 20 m from a smaller street with about 9800 ± 390 vehicles per day. Previous studies conducted at this site show that it is heavily affected by traffic (Gramsch et al, 2000). Alameda has the highest flux of buses in the city. There is a lot of commercial activity, retail and some light industries around this site. At this point, the lanes in Alameda are segregated (three lanes for buses and two for vehicles in each direction). The altitude of this site over sea level is 530 m. Simca–A was placed at this site.
Alameda station is located about 30 m north from Alameda avenue, about 2.5 km east from Usach, it is located about 1 km west of downtown Santiago. This site has less commercial activity, but it has many office buildings, the vehicular flux is the same as Usach. The segregation at this point is the same as in the Usach site. The altitude of this site over sea level is 550 m. Simca–G was placed at this site.
Providencia station is located about 20 m south from Providencia avenue, about 3 km east from Alameda station and 2 km from downtown. This street is the continuation of Alameda and has slightly less vehicular flux. The street is not segregated at this point. This site represents a mix of business activity (mostly offices) and residential area. The altitude of this site over sea level is 600 m. Simca–D was placed at this site.
San Diego is a street south of downtown also for use exclusively by buses from 7:30–10:00 h, with traffic direction from south to north (towards downtown). During the rest of the day any vehicle can use the street. The station is located about 20 m west of San Diego street, and about 1.2 km south of downtown. The street has a lot of commercial activity, retail and some light industries around. The site is surrounded by medium size buildings (10 stories) that may prevent good ventilation. The vehicular flux is 21300 ± 700 per day. The altitude of this site over sea level is 540 m. Simca–F was placed at this site.
Recoleta is a two–way street located north of downtown with a flux of 19300 ± 740 vehicles per day. However, during rush hour, it is an "exclusive street" for use only by public buses (7:30 –10:00 h), and with traffic direction going from north to south. During the remainder of the day, any vehicle in both ways can use the street. The detector is located inside a school about 50 m from the street and about 200 m from another busy street. The area has a lot of commercial activity and there are several hospitals nearby. The altitude of this site over sea level is about 560 m. Simca–E was placed at this station.
3. Results and discussion
3.1 Instrument calibration
In order to use the data from the Simcas to determine the efficacy of the traffic restrictions, simultaneous measurements between the Simca, a Teom monitor with a 2.5 µm cut point and a carbon monitor (model 5400 from Rupprecht & Patachnick) were done in winter of 2000 (Gramsch et al., 2004). The results allowed finding a relationship between the light absorption coefficient σa and the concentration of elemental carbon of the type:
σa[1/km] = α EC [µg/m3] (1)
where EC is the concentration of elemental carbon, and a is the mass absorption coefficient for Santiago. In this equation, we have assumed that most of the light absorption in the atmosphere is due to EC. Gases like ozone and NO2 can absorb light, but the absorption coefficient of 100 ppb of ozone (Gast, 1960; Hodkinson, 1966) at 550 nm is about 0.001 [1/km], for 50 ppb of NO2 is 0.01 [1/km], while for particles (Horvath, 1993), is 0.1 [1/km]. Thus, the absorption by these gases is negligible. For particles, previous measurements by Conama (2003), have found that about 8% of the particle mass (PM10) corresponds to EC, 9% to organic carbon, 48 to natural and city dust, 7 to chlorine, 8 to sulphate, 11 to nitrate, 8 to ammonium and 3% to others. From these components, only EC and organic carbon (OC) can absorb light, the others either scatter light or are transparent. Most organic carbon components absorb in the IR par of the spectrum, but some heavy hydrocarbons also absorb in the visible region. A study performed by Rappengluck et al. (2000) in 1996 in Santiago indicate that the concentration of these components is less than 0.5 |a,g/m3, which is much less than the EC concentration.
A relationship like eq. (1) is useful if one wants to obtain elemental carbon concentration with the instrument described in the instrumentation section. The conversion coefficient for EC is a = 4.46 m2/g ±0.1. This value was used to calculate the EC concentrations shown in the figures below from the measured light absorption coefficient.
Before placing the instruments in the sites, simultaneous measurements were performed at the Usach site in order to verify that the absorption coefficient obtained was similar. These measurements were performed from February 23 to March 4,2001. All Simcas show similar features, in particular, the traffic dependence of the absorption coefficient was seen, with a pronounced peak at 8:00 h, and a more extended peak between 19:00 and 22:00 h.
3.2 Particulate matter concentration in the center and the western part of Santiago
A recent study (Gramsch et al., 2006) using data from the Macam Network (Conama) indicates that the sectors with largest PM10 concentrations in winter are downtown (Parque O'Higgins) and the west of the city (Pudahuel). These areas are indicated in the map of Figure 1. Pudahuel is an important monitoring site because it has the highest levels during winter, and is the station that triggers most of the "exception events" (days with traffic restrictions). The monthly average PM10 levels for these stations are shown in Figure 2. The highest PM10 levels in the year 2001 are seen during May and June, which are cold months with little rain. During July and August, the hourly peak levels may also be high, but the average is generally lower because there is more rain that brings down the particle concentration.
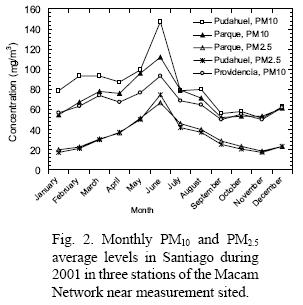
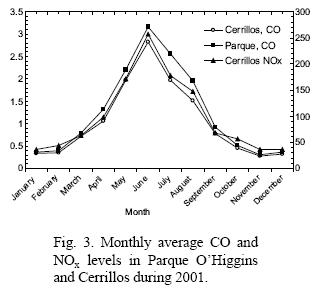
An interesting feature seen in Figure 2, is that Pudahuel has higher PM10 levels than Parque O'Higgins in the first part of the year (January–June), but their levels are similar during the second part of the year (July–December). In contrast, PM2.5 average levels are similar for both stations for most of the year. The difference seems to be the source of particles. Most of the rain in Santiago falls between June and July, therefore vegetation grows in unpaved areas of the city and its surroundings and the soil remains wet for several months. Because of these factors, there is less natural dust in the air during winter and spring (July–December). During summer and fall (January–May) there is very little rain and hot whether, the vegetation dries out and the natural dust is easily resuspended. Because higher PM10 is not seen in the downtown station (Parque), probably most of the dust comes from outside the city and the vicinity of Pudahuel station. This increase is not seen for PM2.5, indicating that the resuspendend dust corresponds to coarse particles. A similar pattern (not shown) for PM10 and PM2.5 has also been observed in the year 2000. Carbon monoxide and NOx are contaminants that are emitted mostly from motor vehicles, and constitute good tracer gases for transportation in a polluted city. In Figure 3 we have plotted CO concentration in two of the stations of the Macam Network and NOx in one of the stations (Parque O'Higgins and Cerrillos). Cerrillos is the only station close to downtown that monitors NOx and it is located about 2 km south of the point indicated in the map of Figure 1. Figures 2 and 3 show that CO, NOx and PM2.5 concentrations have very similar shape. The correlation between CO and NOx in Cerrillos is 0.997, the correlation between CO and PM2.5 in Parque is 0.973. This fact indicates that most of PM2.5 could be associated to vehicular emissions.
3.3 Dependence of the EC concentration with wind direction
Since the monitors were located at a certain distance from traffic roads there might be a dependence of the concentration with the wind direction. To study this effect, we have calculated frequency and concentration wind roses in the Parque O'Higgins station. There is no wind speed or direction data for the sites where the Simca monitors are located, but because all the stations are located near downtown, less than 6 km from Parque O'Higgins, we expect the wind pattern to be similar and the conclusions to apply to all Simca sites.
The Parque O'Higgins site is located about 300 m west of a highway and 300 m south of a street with about 22000 ± 820 vehicles per day. The wind roses for Parque O'Higgins are shown in Figure 4 for different times of the day for the months of April through July. During the afternoon (14:00–18:00 h), there is a clear direction of the wind coming from the southwest direction (the convention used is: south wind means that the wind comes from the south and goes towards the north, etc.). More than 80% of the time the wind blows in this direction ( 180–270°). However, at night (22:00–5:00 h) the main component of the wind comes from the southeast direction (110°), i.e. from the center of the city towards the west, but here is still a small southwest component of the wind. During the morning rush hour (6:00–11:00 h) the wind pattern is very similar to the night wind pattern with an average speed around 0.7 m/s, as seen in Figure 5. The wind speed in Parque O'Higgins has a pronounced dependence with the time of the day, with stronger wind occurring during the afternoon (speeds up to 3 m/s) and lower wind speeds during the rest of the day (Fig. 5). The standard deviation of the hourly average is very large indicating that the variability of the wind speed is high. In the Parque O'Higgins station it is possible to see a typical valley–mountain wind pattern (Fig. 4); that is, during the day the wind blows from the valley towards the mountain, and at night the direction reverses. At Pudahuel, which is further away from the mountain, this pattern cannot be seen.
The concentration rose for EC in Parque O'Higgins is shown in Figure 6. During the morning hours (6:00–11:00 h) the concentration shows little dependence with the wind direction. Because the wind speed is very low, the vehicular emissions tend to diffuse in all directions. In the morning there is some influence from the largest streets, which are located towards the east (highway) and towards the north (Blanco street). During the afternoon (14:00–18:00 h) the lowest concentration occurs when the wind comes from the southwest direction (180–240°), this wind brings clean air from the coast. When the wind blows from the other directions, higher concentration is observed. When the wind points in the southwest direction (180–240°), there is a lower EC concentration, because the air from this direction is cleaner. The concentration rose for the morning hours (6:00–11:00 h) shows that the EC concentration measured by the Simca monitor is not going to be strongly influenced by the location of the monitor with respect to the street.
The EC concentration at night (22:00–5:00 h) also has some dependence with wind direction. The concentration is higher in the ~80° to 150° direction, i.e. when the wind comes from the highway. However, it is not clear that the highway is the cause of the higher EC concentration, because the same effect is not seen when the wind comes from the north, where another large street is located (Blanco). Instead, the higher concentrations may be due to the many sources located in the center and east of the city. It seems that in Parque O'Higgins, the influence of the nearby streets on the EC concentration at night is not high.
3.4 Temporal variation of the EC concentration
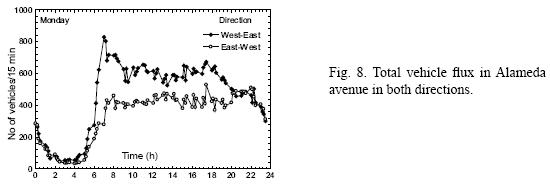
The EC concentration depends on many variables –according to the time of day– and it also varies with the day of the week and the season of the year (Gramsch et al., 2000). During weekdays the traffic has a stronger influence on the rush hour concentrations; during Saturdays, the rush hour occurs two hours later than weekdays; on Sunday there is no morning rush hour. Because the influence of traffic is higher during weekdays, our analysis will be done using data only from weekdays. Figure 7 shows the normalized EC concentration (EC/EC0, with EC0 the average for the month) at three sites, for all months measured. During cold months (April–July), the low average wind speed and the reduced height of the mixing layer are responsible for higher EC concentration than in warm months. This pattern has been observed previously in Santiago (Rutland and Garreaud, 1995; Gramsch et al., 2000). The daily pattern of the EC concentration can be associated to different sources and meteorological conditions. There is a pronounced peak at 8:00 h that can be associated almost exclusively with traffic because is well correlated with an increase in vehicular flux. The traffic pattern in Alameda (near Alameda monitoring site) shown in Figure 8, indicates that there is an increase in vehicular flux around 6:00–7:00 h that decreases around 9:00–10:00 h and remains relatively constant during the rest of the day. The increase in EC concentration around 8:00 am can be attributed to the rush hour traffic.
During the afternoon, there is a decrease in EC concentration (12:00–18:00 h), which to a small extent can be related to a decrease in traffic, but mostly is due to an increase in the wind speed. Because there are no measurements of wind speed or direction in the Usach or Alameda sites, the data for Parque O'Higgins (Fig. 5) is going to be used. The Usach site is about 2.5 km away from Parque, and Alameda is only 1.3 km from Parque, so the wind speed is similar in all three sites. As seen in Figures 5 and 6, the wind increase in the afternoon (12:00–18:00 h) explains the low EC levels seen in this part of Santiago.
There is a large variability in the EC concentration, as can be evidenced by the error bars in Figure 7. This variability is also seen in the PM10 measurements from other monitoring stations. As an example, the average standard deviation in PM10 during April in Parque O'Higgins divided by the average PM10 is 0.64. The average standard deviation in EC during April in Providencia divided by the average PM10 is 0.56. The similarity of these numbers, indicate that the variability is related to changes in concentration and not to problems in the monitors. One variable that has high variability and is highly related to the EC or PM10 concentration is the wind speed. The variability of the wind speed can be seen in Figure 5, and the average standard deviation in wind speed during April in Parque O'Higgins divided by the average wind speed is 0.48, so most of the variability in the concentration data can be explained by the variability in the wind speed.
The peak in EC concentration during the evening and night (18:00–20:00 h) can be attributed to the traffic (evening rush hour), but also to an accumulation of pollution due to a reduction in the height of the inversion layer (Rutland and Garreaud, 1995) and a decrease in the wind speed. At this time, during winter, there is also a lot of wood and kerosene burning for heating that can be a large source of elemental carbon, which increases the EC concentration levels.
The morning rush hour peak (8:00 h) can be seen in the EC curves for all months (Fig. 7), indicating that the influence of traffic in the downtown area is high. The daily average EC concentration has been calculated for March through July. It has to be noted that the area under the peak from 6:00 to 11:00 h represents 29% of the total area in March. This fraction decreases in the colder months, being 27.3% in April, 22.1 in May, 23.6 in June and 20.7% in July. The average for these months is 24.5%. Although in colder months this fraction decreases, the data indicate the importance of the vehicular emission on the elemental carbon budget for Santiago.
3.5 Influence of the segregated lanes on the EC concentration
As mentioned before, Alameda has three segregated lanes that can be used only by public transportation buses and two lanes used by all other vehicles. Providencia, while also having 5 lanes, is not segregated. Both avenues have similar traffic characteristics, i.e. a mixture of buses, private vehicles and light trucks, heavy trucks are not allowed. Medium size buildings surround both avenues. The meteorological conditions (wind speed and direction, temperature and relative humidity) are very similar because the three sites are close to each other (Fig. 1). Alameda and Providencia are parts of a long avenue that crosses the city from east to west, and this is the most important avenue in the city with the highest density of buses and private vehicles.
As seen in Figure 1, the Usach and Alameda sites are not far from Parque O'Higgins (Usach is 2.5 km from Parque, and Alameda is only 1.3 km from Parque) thus it can be assumed that the average levels of PM10, PM2.5 measured in Parque O'Higgins are representative for Usach and Alameda. From Figure 2, it can be seen that PM10 in Providencia is, on average, lower than in Parque O'Higgins. Thus, the PM10, PM2.5 and EC levels in Providencia are on average always lower than Alameda or Usach, and a possible reduction in the emission during rush hour cannot be seen by a direct comparison of the data from these stations. For example, the EC concentration, measured with the Simca monitor in April was 29% lower in Providencia than in Usach and 23% lower than in Alameda, and for the other months the percentages are similar. The lower concentration is partly because Providencia district has less traffic and is about 70 m higher than the other sites. Because the average concentration levels are different and the traffic density is different, a direct comparison of the EC levels in these streets cannot be made. Thus a comparison of the normalized EC concentration for the rush hour period (7:00–9:00 h) will be done. We are assuming that if there were no segregation of the streets, then the normalized rush hour averages would be similar for these three sites.
In order to compare the concentration levels from the stations along Alameda/Providencia, we have calculated the hourly average normalized by the monthly average (E0) of each station. The data, for the months of April–July, are shown in Figure 7. It can be seen that Providencia has the same or slightly higher normalized EC concentration (EC/EC0) than the other two stations during the morning rush hour (7:00–9:00 h) for all months. In addition, the increase in EC concentration during the rush hour is also larger for the Providencia station. The increase was calculated as:
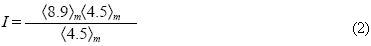
where <8.9>m is the average of the EC concentration at 8:00 and 9:00 AM for the month, etc. This increase is caused largely by the rush hour traffic. Table I presents the average increase, the standard deviation, number of data points, and maximum and minimum for each month. The large error is indicative of the large variability in the EC concentration from one day to another; this is to be expected because the meteorological conditions have large changes over short periods of time.
To evaluate if the increase during rush hour in Providencia is higher than the other two sites, the t–Student test was applied to the mean increase of the stations (Eq. 2). Providencia with Alameda and Providencia with Usach were compared to assess if the means of these stations are significantly different. A difference between two means is significant (at the given probability level) if the calculated t value is greater than a value given by the t–test table. For a 95% probability (p = 0.05) that the two means are different, a t value of 2.02 is needed.
The calculated t–values for pairs of stations are shown in Table II. It can be seen that for most months, the t–value is lower than 2.02 which is the maximum t –value allowed for a 95% confidence that the means are different. The t–value is greater than 2.02 only during June. Although the mean increase in Providencia is higher than Alameda or Usach, the calculation indicates that we can not conclude with statistical significance that the mean values are different. The large variability in the data does not allow resolving with statistical significance if there is a reduction in the emission from segregated streets.
A possible reason that the segregation of the streets has only a small effect in the reduction of EC concentration is that the buses may accelerate harder because they have more space. When there is less congestion the buses may try to reach the next stop in less time with harder acceleration that generates more emissions. This issue may be investigated by measuring the speed of buses in a segregated and not segregated street. Another reason may be that the congestion in the lanes with passenger vehicles (because they have only two lanes available) results in increased emissions.
The effect of the location of the monitoring station with respect to the street was also investigated. Providencia station is located south of the street, while Alameda and Usach are located north. If the wind blows in the north–south direction there may be a stronger impact in Providencia station. Measurements of wind direction and speed have been taken in Pudahuel and Parque O'Higgins, but the latest station is representative for downtown Santiago, because Pudahuel is farthest east. Wind frequency roses for Parque are plotted in Figure 4 and they indicate that during the rush hour (7:00–9:00 h) the prevalent wind direction is east–west and west–east. In addition, the wind speed is very low: 0.6–0.8 m/s as shown in Figure 5, so the location of the stations does not influence the concentrations during these hours.
Because of the restrictions to passenger vehicles in Alameda, the congestion in nearby streets is probably higher, and its effect should be investigated. Using the data from the Macam network (Conama, 2003), we have found no evidence of a reduction or increase in pollution (PM10 or PM2.5) in other sectors of the city.
A comparison of normalized EC concentration during rush hour between Alameda and the other streets (San Diego or Recoleta) was not performed because they have different traffic pattern. In the morning only buses can use these streets, while all types of vehicles use Alameda. In addition, the wind direction during the morning hours (6:00–11:00 h, Fig. 4) is perpendicular to Recoleta and San Diego, which have a north–south direction. Alameda has the same direction as the wind speed during these hours. San Diego is a street surrounded by several medium size buildings, and Recoleta is more open. It is deemed that these characteristics of Recoleta and San Diego (direction, size, number and type of vehicles, etc.) make difficult to perform a comparison with Alameda or among them.
3.6 High EC levels in San Diego street
When the absolute EC concentration is analyzed, it is found that San Diego station has very high EC concentration during rush hour. San Diego is a one–way street with a north–south direction, in which the vehicular flux was changed such that only public transportation buses could circulate in the morning rush hour (7:30–10:00 h). It is located in a busy district with several mid size buildings (10 stories), a lot of commercial activity and some light industries around. The Simca was located in the eastern part of the street in the 5th floor of a building. A plot of the hourly average EC concentration measured in San Diego, Alameda and Recoleta is shown in Figure 9. This plot allows to make a comparison of the EC concentration between these stations and to visualize the traffic pattern in these streets. The highest value of the EC concentration occurs in San Diego at 10:00 h, while in Alameda and Recoleta it occurs at 9:00 h. It also can be seen that for April and June, the San Diego monitoring site has the highest rush hour peak compared to the other streets. May and July are not shown but they have similar features. The EC concentration from 7:00 to 11:00 h can be calculated and the results are that in April, San Diego is 20% higher than Alameda and 18% higher than Recoleta. In May, it is 2% lower than Alameda but 9% higher than Recoleta, in June it is 46% higher than Alameda and 76% higher than Recoleta, and in July it is 30% higher than Alameda and 3 % higher than Recoleta. These high concentrations are probably due to the buildings that surround the street and prevent good ventilation. In addition, in the morning the wind direction in this area is perpendicular to the street (Fig. 4), which also contributes to poor ventilation. The rush hour peak is even higher than the evening peak during the cold months (June and July). All these features of the data indicate that operation of exclusive lanes for public transportation does not have an effect in this street.
3.7 Extent of an area with high EC pollution
The monthly average EC concentration in four monitoring sites (Usach, Alameda, Recoleta and Providencia) allows determining whether there is an area with higher concentration in Santiago. The monthly average shows that Recoleta, while having slightly higher EC levels than Providencia, it is still lower than Alameda and Usach. It is also clear that stations located towards the east have lower EC concentration. The difference between the sites can be seen more clearly if we plot the variation of EC along the day, because the influence from the local sources can be distinguished more clearly. Figure 10 shows a comparison of the hourly EC average for April and June. It can be seen that in the early morning (1:00 to 6:00 h) and during the evening (18:00–24:00 h) there is a clear difference between the stations in the west (Alameda and Usach) and the east (Providencia and Recoleta). The EC concentration during these hours is not influenced by traffic, but it can be attributed to heating sources and to the reduced height of the inversion layer. During these hours, Providencia and Recoleta have always lower levels than Usach and Alameda. The reason for this behavior may be that these two stations are located towards the east in a slightly higher part of the city. Most of the business in this section of the city corresponds to offices and retail stores, while around the Usach and Alameda sites there are more small industries, as well as offices and retail. The EC concentration during rush hour does not show a clear difference between the eastern and western stations, because the concentration during these hours is determined by the local traffic. The data shown in Figure 10 allow us to divide the sector in two parts: one with higher EC concentration than the other, as shown in Figure 11. Towards the east of the lines, the elemental carbon concentration decreases, and towards the west (arrow direction) it increases. In addition, because elemental carbon is highly correlated with PM2.5, we can also expect a similar behavior for this pollutant.
4. Conclusions
Five semi–automatic systems built at the University of Santiago have been used to monitor the elemental carbon concentration (by measuring the light absorption coefficient) during winter of 2001. This monitoring campaign was carried out to assess the effectiveness of the segregation of the main avenue (Alameda). Three monitoring stations were placed along Alameda/Providencia avenues, one towards the north and one towards the south of Alameda. The location of the monitoring station with respect to the street does not affect the concentrations because the wind speed is very low during these hours. The data indicate that the morning rush hour peak can be seen for all months showing that the influence of traffic in this area is high. The EC concentration during rush hour represents an average of 25% of the total concentration. The EC data from weekdays from April to July of 2001 (winter) in Alameda/Providencia indicate that there may be a reduction in the rush hour EC concentration levels in Alameda (street that has segregated lanes) as compared with Providencia that has no segregated lanes. However, it is not possible to conclude with statistical significance that the mean value in Providencia is higher than Alameda or Usach. It was also found that one street that has exclusive lanes during the morning (San Diego), has higher EC levels than the other streets. This is probably due to the buildings that surround the street and prevent good ventilation, evidencing that in this street the operation of exclusive lanes for public transportation does not have a noticeable effect.
When the EC levels from the different monitoring sites are compared, it can be deduced that part of the city hat has lower average elemental carbon concentration levels. The district with lower EC levels has slightly higher altitude and fewer small industries.
Acknowledgements
This work was supported by Comisión Nacional del Medio Ambiente, Conama RM, under contract BIP: 20127600–2 and by Fondecyt Project No. 1040170.
References
Artaxo P., P. Oyola and R. Martínez, 1999. Aerosol composition and source apportionment in Santiago de Chile. Nucl. Instrum. Meth. 150, 409–416. [ Links ]
Cifuentes L. A., J. Vega, K. Kopfer and L. B. Lava, 2000. Effect of the fine fraction of particulate matter versus the coarse mass and other pollutants on daily mortality in Santiago, Chile. J. Air Waste Manag. Assoc. 50, 1287–1298. [ Links ]
CONAMA, 2003. Evolution of the air quality in Santiago, 1997–2003. Comisión Nacional del Medio Ambiente, Conama RM, Santiago, Chile. [ Links ]
Gast P. R., 1960. Thermal radiation. Handbook of Geophyics. Macmillan, New York, 1621 pp. [ Links ]
Gramsch E., L. Catalán, I. Ormeño and G. Palma, 2000. Traffic and seasonal dependence of the light absorption coefficient in Santiago de Chile. Appl. Optics. 39, 4895–4901. [ Links ]
Gramsch E., F. Cereceda–Balic, I. Ormeño, G. Palma and P.Oyola, 2004.Use of the light absorption coefficient to monitor elemental carbon and PM2.5 Example of Santiago de Chile Example of Santiago de Chile J. Air Waste Manag. Assoc. 54, 799–808. [ Links ]
Gramsch E., F. Cereceda–Balic, P. Oyola and D. Von Baer, 2006. Examination of pollution trends in Santiago de Chile with cluster analysis of PM10 and ozone data. Atmos. Environ. 40, 5464–5475. [ Links ]
Hodkinson R. J., 1966. Calculation of the color and visibility of in urban atmospheres polluted by gaseous NO2. Int. J. Air Water Pollut. 10, 137–144. [ Links ]
Horvath H., 1993. Atmospheric light absorption – A review. Atmos. Environ. 27, 293–317. [ Links ]
Horvath H., L. Catalán and A. Trier, 1997. A study of the aerosol of Santiago de Chile III: Light absorption measurements. Atmos. Environ. 31, 3737–3744. [ Links ]
Ilabaca M., I. Olaeta, E. Campos, J. Villaire, M. M. Tellez–Rojo and I. Romieu, 1999. Association between levels of fine particulate and emergency visits for pneumonia and other respiratory illnesses among children in Santiago, Chile. J. Air Waste Manag. Assoc. 49, 154–163. [ Links ]
Jorquera H., R. Pérez, A. Cipriano, A. Espejo, M. V. Letelier and G. Acuña, 1998. Forecasting daily maximum levels at Santiago, Chile. Atmos. Environ. 32, 3415–3424. [ Links ]
Kavouras I. G., J. Lawrence, P. Koutrakis, E. G. Stephanou and P. Oyola, 1999. Measurement of particulate aliphatic and polynuclear aromatic hydrocarbons in Santiago de Chile: Source reconciliation and evaluation of sampling artifacts. Atmos. Environ. 33, 4977–4986. [ Links ]
Lee S. A., T. Hastie, P. F. Mancilla, P. O. Astudillo and W. G. Kuschner, 2000. Fine particulate air pollution (PM2.5) and medical visits for lower respiratory tract illnesses among children in Santiago, Chile. J. Invest. Med. 48, 524. [ Links ]
Lin C. I., M. B. Baker and R. J. Charlson, 1973. Absorption coefficient of the atmospheric aerosol: a method for measuring. Appl. Optics 12, 1356–1363. [ Links ]
Ostro B. D., G. S. Eskeland, J. M. Sánchez and T. Feyzioglu, 1999. Air pollution and health effects: A study of medical visits among children in Santiago, Chile. Environ. Health Persp. 107, 69–73. [ Links ]
Rappengluck B., P. Oyola, I. Olaeta and P. Fabian, 2000. The evolution of photochemical smog in the metropolitan area of Santiago de Chile. J. Appl. Meteor. 39, 275–290. [ Links ]
Rutland J. and R. Garreaud, 1995. Meteorological air–pollution potential for Santiago, Chile–Towards an objective episode forecasting. Environ. Monit. Asses. 34, 223–244. [ Links ]
Sanhueza P., C. Vargas and J. Jiménez, 1999. Daily mortality in Santiago and its relationship with air pollution. Rev. Med. 127, 235–242. [ Links ]

