


Services on Demand
Journal
Article
 English (pdf)
 Article in xml format
 Article references
 Send this article by e-mail
Indicators
-
 Cited by SciELO
 -
 Access statistics
Related links
-
 Similars in
SciELO
Similars in
SciELO
Share

 Permalink
Atmósfera
Print version ISSN 0187-6236
Atmósfera vol.21 n.1 Ciudad de México Jan. 2008
Sensitivity of main downdraft features to vertical wind shear and ice–phase in a microburst–producing thunderstorm
M. TORRES BRIZUELA and M. NICOLINI
Centro de Investigaciones del Mar y la Atmósfera
Consejo Nacional de Investigaciones Científicas y Tecnológicas CONICET/UBA,
Departamento de Ciencias de la Atmósfera, Universidad de Buenos Aires
Buenos Aires, Argentina
Corresponding author: M. Torres Brizuela; e–mail: brizuela@at.fcen.uba.ar
RESUMEN
En este trabajo se presentan los resultados de simulaciones numéricas de una tormenta severa generadora de una ráfaga descendente de pequeña escala, usando un modelo convectivo. Se realizaron diferentes experimentos numéricos a fin de comprender el papel de la cortante vertical del viento en el entorno y la fase hielo en organizar la dinámica de la nube y la intensidad de la ráfaga. También se analizan tres tipos de descendentes (la de niveles medios, la penetrativa y la descendente asociada con la precipitación) y su relación con la microfísica de la nube y la cortante vertical del viento en el entorno. Con el fin de cumplimentar este objetivo se utiliza como caso de estudio una tormenta extensamente documentada ocurrida el 20 de julio de 1986 sobre el norte de Alabama (EUA). Esta elección ha sido motivada por la similitud que presentan las condiciones en el entorno previas a dicha tormenta, respecto a las que favorecen la ocurrencia de tormentas generadoras de ráfagas severas en la región noreste de Argentina. En el experimento de control, los resultados del modelo mostraron una correcta representación de los rasgos principales de la tormenta durante su ciclo de vida. Las simulaciones numéricas confirman el papel de la cortante vertical del viento, a pesar de ser débil, en la génesis y mantenimiento de la descendente de niveles medios. La inclusión de la fase hielo provee un empuje adicional que promueve el crecimiento vertical y reduce la contribución de la carga de hidrometeoros, vinculada a las gotas de lluvia sobreenfriadas, a la descendente de niveles medios. La fusión provee un enfriamiento adicional que refuerza tanto la descendente asociada con la precipitación como la diferencia de velocidades en el flujo saliente divergente en la ráfaga.
ABSTRACT
This paper presents results from numerical simulations of a severe storm producing a microburst, using a convective numerical model. The numerical experiments are done in order to understand the role of the environmental vertical wind profile and/or the ice phase in organizing cloud dynamics and the strength of the microburst. Three particular downdraft types (the mid level, the penetrative and the precipitation related) and their relationship with cloud microphysics and the environmental wind profile are analyzed. To accomplish this objective, a well documented storm developed on 20 July 1986 over northern Alabama (USA), is used as case study. Similar environmental conditions to those that characterize this event have been observed prior to thunderstorms that produce severe low–level winds over northeastern Argentina. Model results show a good representation of the observed main storm features during the different cloud stages for the control its weak magnitude, in the genesis and support of the mid–level downdraft. The inclusion of the ice phase provides additional buoyancy that promotes a stronger updraft and vertical growth and reduces the loading contribution related to supercooled raindrops to the mid–level downdraft. Melting provides an additional cooling that reinforces both the low–level precipitation related downdraft and the divergent outflow velocity differential in the microburst.
Keywords: Convective downdrafts, numerical modelling, sensitivity tests, environmental wind shear, ice phase.
1. Introduction
Convective downdraft motions and related outflow winds have been recognized in the literature as an eventual source of severe damage. The terms "downburst" and "microburst" were defined to describe very intense, small–scale and short in time divergent outflows resulting from the dissipation stage in deep convection (Fujita, 1981;FujitaandWakimoto, 1983;Fujita, 1985). Since Fujita definitions, limited attempts mainly based on Doppler radar observations and/or modeling simulations have been conducted to study these phenomena (Srivastava, 1985, 1987; Kessinger et al., 1986; Proctor, 1988, 1989; Hjelmfelt et al., 1989; Orville et al., 1989; Tuttle et al., 1989, Straka and Anderson, 1993). Recently, a comprehensive summary of convective downdrafts has been presented by Wakimoto (2001) with emphasis in severe events.
Although previous studies related to convective downdrafts were mainly focused on the relationship between downdraft strength and precipitation properties (Betts and Silva Dias, 1979; Srivastava, 1985, 1987), the few studies addressing dynamics of the different observed and/or modeled downdrafts and their forcings within a cloud, were those conducted by Knupp and Cotton (1985), Trípoli and Cotton (1986), Knupp (1987, 1989), Orville et al. (1989), Parsons and Weisman (1993), among others. Knupp and Cotton (1985), based on a composite of observational and numerical studies, presented a scheme of four downdrafts that can be defined within or near convective clouds: the "precipitation–related" downdraft (PRD), supported at low levels by precipitation loading and associated with the dissipation stage of the clouds, the penetrative non–precipitating downdraft (P) in the upper regions of precipitating clouds that emerges when subsaturated enviromental upper–air is entrained or mixed through the cloud top, the regional compensating (R) that is ussually outside active cloudy regions and the cloud/updraft edge, also called, mid–level downdraft (MLD). Knupp (1987) presents an insigth on the MLD and associates its dynamics with the development of a horizontal pressure perturbation couplet, characterized by high pressure on the upshear side and low pressure on the downshear side. This pattern, explained by Rotunno and Klemp (1982) applying linear theory to convection in a sheared environment, forces asymmetrical entrainment of drier and cooler environmental air into the downshear flank of a storm.
A severe microburst–producing thunderstorm developed over northern Alabama (USA) on 20 July 1986 during the development of the MIST (Microburst and Severe Thunderstorm) Project (Dodge et al., 1986). This case presented a pre–storm environment similar to some of the events included in the sample obtained by Nicolini and Torres Brizuela (1997) over northeastern Argentina, where Doppler radar observations are not available. The Alabama storm was well–documented (Wakimoto and Bringi, 1988; Kingsmill and Wakimoto, 1991; hereafter referred to as: WB88 and KW91, respectively) and extensively used as a case study to test the performance of different numerical models (Tuttle et al., 1989; Proctor, 1989;Nicolini, 1993; Straka and Anderson, 1993). Three of the previously mentioned downdrafts: the MLD, the PRD and the P were well captured by the Doppler–radar and described in WB88 and KW91. The complete documentation, particularly concerning downdrafts and the earlier research on this storm make this event appropriate as a case study to explore dynamical features.
This study is mainly focused on understanding the role of the environmental vertical wind shear and the inclusion of the ice phase in controlling the development and strength of the PRD and the resulting microburst. It is also of interest to evaluate an eventual reinforcement of the PRD by the MLD in the Alabama storm. In order to achieve this goal different numerical experiments are performed using the Advanced Regional Prediction System (ARPS) model.
In the following section, the convective model characteristics are briefly described and some environmental and internal Alabama storm features are summarized. In section 3, results from the control numerical experiment (ice phase + environmental winds) are briefly presented in order to evaluate the model performance. In section 4, results from three other experiments are shown in order to recognize the role of the environmental wind shear and the ice phase in organizing the main downdrafts. A summary and a discussion of the findings are presented in section 5.
2. Numerical simulations methodology and brief overview of the observed storm characteristics
2.1 Model description and initialization
The ARPS numerical model (Xue et al., 2000) is a three dimensional non–hydrostatic mesoscale model based on the fully compressible Navier–Stokes equations. In the present version it includes different alternative parameterizations for turbulence and microphysics. The following is a brief description of the cloud model details:
• Coriolis effect is neglected in the momentum equations.
• A bulk water, mixed–phase cloud microphysics, following Lin et al. (1983) is used including six categories of water substance (water vapor, cloud water, cloud ice, rain water, snow and graupel/hail).
• A 1.5 order prognostic turbulent kinetic energy equation option is used for subgrid scale turbulence parameterization.
• Model reflectivity field is estimated from model hydrometeors including rain water, snow and hail, according to the semi–empirical formula from Rogers and Yau (1989).
• Model boundary conditions specify a rigid lid at the top and bottom boundaries, activate a Rayleigh friction absorption layer near the top, and follow Klemp and Wilhemson (1987) along open lateral boundaries.
• Constant 0.6 km horizontal grid spacing and 0.45 km vertical grid spacing are used, which produces a 47.1 by 47.1 km horizontal domain and a 17 km height vertical domain. The specified resolution makes feasible a comparison with observed fields as spacing used by KW91 to interpolate synthesized Doppler radar 3D wind field is 0.4 km in the horizontal and 0.5 km in the vertical.
• The model simulated 1:30 hours of the cloud evolution using one second for the "small" time step (to solve the acoustic terms in the equations) and 3 s for the "big" one (to solve the remaining terms).
The model is initialized with an horizontally homogeneous environment given by the Redstone (Alabama) 18:00 UTC radiosounding (shown in Fig. 1) launched around one hour before the storm started to develop and located 20 km S–SE from the center of the microburst damage location.
In order to force the convection, an ellipsoidal bubble perturbation in potential temperature with a maximum strenght of only 0.5 K was imposed near the lower boundary (lowest 1.5 km) and centered in the middle of the domain.
2.2 Numerical experiments design and methodology for the analysis of the numerical model performance
Stein and Albert (1993) developed a methodology to compute the interactions among different factors influencing a predicted field produced from a given atmospheric numerical model. The mathematical basis for n factors shows that 2n simulations are required for the separation of the contributions and their possible interactions, so in this case 22 simulations are required to perform the algorithms proposed by the authors. So that, four identically initialized simulations are designed as follows: A1 includes the environmental vertical wind profile and the ice–phase parameterization (control simulation), A2 includes the ice–phase and assumes the absence of environmental winds while experiment A3 includes the environmental vertical wind profile but excludes the ice–phase and the last experiment, A4 supress both the ice phase and the environmental wind shear. According to Stein and Albert (1993) proposal, four different algorithms are also calculated as follows:
E1 = A4, represents the contribution to downdrafts, independent of the vertical wind shear and the ice phase
E2 = (A2 –A4), gives the effect of the ice phase on the descending motion.
E3 = (A3 – A4) isolates the descending motion induced by the vertical wind shear.
E4 = ((A1 – (A2+A3)) + A4), represents the interactive effect due to vertical wind shear and ice phase.
The model performance is examined based on comparisons between the observed and simulated storm characteristics: elapsed time of the cloud stages, strength of the updraft, intensity of radar reflectivities, cloud top height, water specific humidity magnitudes, strength and size of downdrafts, and intensity of surface outflows.
Three cell convective stages were defined according to KW91 criterion: the cumulus (Cu) stage, during which the updraft prevails throughout the dominant cell, the mature (Ma) stage that initializes when the radar–detected precipitation core begins its descent, whereas the dissipating (Di) stage starts when the first sign of radar surface divergence is detected. The main storm motion is obtained following KW91 criterion (following the 30dBZ contour at 2 km above ground level) and the relative storm motion was obtained substracting the mean storm motion from the wind field.
Primary forcing mechanisms for enhancing or retarding downdrafts are computed from the terms in the inviscid vertical momentum equation.
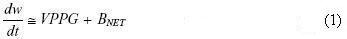
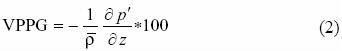
where the vertical perturbation pressure gradient (VPPG) and net buoyancy (BNET) are defined as
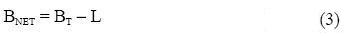
BT and L denote the thermal buoyancy and the loading, calculated as follows
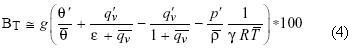
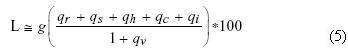
where p , q v and  represent the deviations of the pressure, water vapor specific humidity and potential temperature from the base state values, denoted by the bars. Rain water, snow and graupel/ hail, cloud ice and cloud water specific humidities are denoted by qr, qs, qh, qi and qc , respectively. Gravity is denoted by g, p the base state density and 8 is a constant value equal to 0.61.
2.3 Brief description of the Alabama storm
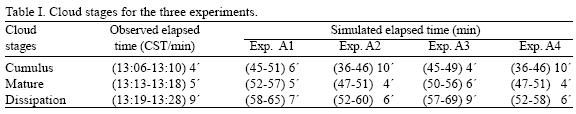
WB88 and KW91 studied in detail the Alabama storm classifying it as an air–mass convective event that evolved without a strong synoptic scale forcing. A convective available potential energy (CAPE) value of around 3572 m2 s–1 suggests an intense deep convection, the vertical wind shear ( 2.7 ms–1 over the lowest 6 km) was relatively weak and the Richardson number (600) classifies correctly this storm as an ordinary one according to Weisman and Klemp (1982). The elapsed time of the entire storm was around 22–24 minutes covering the three stages: cumulus (13:06–13:10 CST), mature (13:13–13:18 CST) and dissipation (13:19–13:28 CST) (Table I).
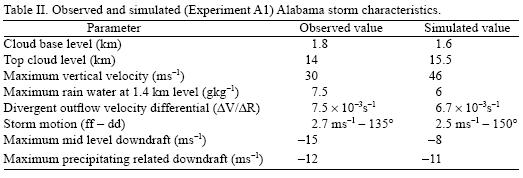
Main storm characteristics obtained with a combination of multiple–Doppler radar and retrieved dynamic and thermodynamic data have been reported by WB88 and KW91 and summarized in Table II where the corresponding simulated outputs have been also included as a reference for the next section.
3. Numerical results of control experiment
Table I includes the simulated elapsed time in the three cloud stages. The elapsed time since the cell started its rapid vertical development up to the strongest microburst at surface is sligthly longer in the observations (according to WB88 from around 13:07 to 13:25 CST) than in the simulated convection (from 45 to 60 min of integration time).
During the cumulus stage, the reflectivity core moves upward from 3.8 to 5.6 km in 4 min and intensifies from 50 to 65 dBZ. At 50 min of simulation time, corresponding to the time of vigorous growth (13:06–13:09 CST accordingly KW91), the position, the intensity of the reflectivity core (Fig. 2a) jointly with the presence of graupel/hail (11.5 gkg–1) and rain (peak value of 11.8 gkg–1) suggest that glaciation and growth by accretion started in the upper part of the cloud (according to results of WB88 and KW91). At the same time, BT, which drives the rising motion, attains the largest value of the simulated storm life cycle in response to the fast glaciation (as WB88 show from their differential reflectivity ZDR fields). The magnitude of the peak precipitation loading at the height of the reflectivity core (5km) is overcompensated by the corresponding value of BT (Fig. 2b). The perturbation pressure field inside the cloud is mostly explained at this stage by the BT vertical gradient (Fig. 2a and 2b).
The mature stage starts at 52 min of integration time (13:13–13:18 CST accordingly KW91) when the reflectivity and loading–related core start their descent (Fig. 3a and b) coherently with the begining of the precipitation–related downdraft (–2 ms–1 at 4.25 km height level). The BT pattern shows a persistent trend to a division in the maximum core (Fig. 3b). This feature has been called the "constriction", evident in the convergence field (Fig. 3c) and also related with the glaciation by KW91. The asymmetry in the negative perturbation pressure pattern is presumably related to the dynamical mechanism between updraft and vertical wind shear explained by Rotunno and Klemp (1982), active despite the weakness of the vertical shear. In turn, the asymmetry in the BT pattern at around 7 km is related to entrainment, mostly driven by convergence in the "constriction" level and enhanced in the downshear flank.
One minute later the peak in the ascending motion occurs (overestimated by the model, see Table II) followed by a decrease due to precipitation loading. During the mature stage, the cloud top increases its average rising velocity (17 ms–1) faster than the real cloud top (12 ms–1) attaining a maximum height of 15.5 km whereas the descending motion of the reflectivity core is comparatively slower than the observed value (Table II).
The PRD at 54 minutes around the 4.2 km height level attains a value of around –3 ms–1 (not shown) within a zone of negative Bnet where the dominant effect is the loading L with a weak counteracting contribution from BT (Fig. 4a).
Regarding the MLD, the non precipitating–related downdraft, extensively analyzed by KW91 (first sign at 13:13 CST), the model resolution is capable to simulate the genesis of a weak downdraft ( —3 ms–1) at around 6.5 km height level and located in the downshear (eastern side) accordingly with the observational results of KW91. The upper part of the MLD is collocated with a negative Bnet zone, mostly driven by BT and not coincident with the loading core (Fig. 4a). The MLD core is positioned in the downshear sector of a ring of negative potential temperature perturbations that encircles the warm updraft (Fig. 4b). There is an asymmetrical pattern of pressure perturbation along the shear, a positive core upshear and a transitional area to negative values where the MLD is located (Fig. 4b). This region of wake entrainment accelerates subsaturated environmental air within the cloud, effecting evaporational cooling in the downshear side, which in turn favours the formation of the negative BNET zone (Fig. 4a). These results are in agreement with those obtained by Knupp (1987, 1989).
In the area where the MLD is positioned, the vertical deceleration may be explained by the terms in the inviscid vertical momentum, equation (1): the vertical perturbation pressure gradient (VPPG) and the net buoyancy (Bnet).
Figure 4c displays the VPPG and Bnet fields and the main downdraft area (identified with the –1 ms–1 contour) in a vertical subdomain that contains the MLD core. Within this downdraft area, the VPPG magnitudes present opposite signs in two overlapping layers delimited by the 4.5 km height level. In the upper layer, where the MLD dominates, VPPG and BNET collaborate to decelerate the vertical motion, with maxima values of –2.4 x 10⁻² and –3 x 10⁻² ms–2, respectively. The negative BT contribution to BNET is around twice the effect of the loading. In contrast, in the lower layer, where the PRD is present, the downdraft is enhanced by BNET (–3 x 10⁻² ms–2) mainly driven by L and this effect is counteracted by VPPG.
Lately, at the beginning of the dissipation stage (58 minutes of simulation time and 13:24 CST accordingly KW91), both the first signal of divergence at the surface and a well defined pressure dome at lower levels are clearly noticeable in Figure 5a. At this time, the vertical extension of positive BT values within the cloud is increasingly reduced, and in the upper levels in the anvil zone, the cloud becomes dominated by negative values associated with the P (Fig. 5b). It is worth to mention that this downdraft P was not discussed by KW91, although it is partially documented in the wind field of the observed storm, presumably because the retrieval from the Doppler radar was impeded by the absence of precipitation in the upper levels of the cloud. At this time, the three simulated downdrafts P, MLD and PRD are clearly distinguishable at different levels (Fig. 5c). The MLD depicted in Figure 5c, is more intense (–8 ms–1), deeper ( 6 km thick layer) and the minimum is located higher than in the previous time, in agreement with the time of maximum in the observations. The core of the MLD is coincident with the level of the maximum ascent where the interaction with the vertical shear maximizes as well as the asymmetry in the pressure perturbation pattern. As displayed in Fig. 5c, the L effect in the MLD area is still weak and Bnet values are reduced by a BT pattern that evolved to neutral under the subsidence warming effect. Therefore, the accelerated MLD is mostly driven by the VPPG (field not shown). The model is not capable to reproduce the weak reflectivity echo trench related to the MLD and addressed by KW91.
At this time, the PRD attains its maximum strength (–11.2 ms–1 at 1.6 km in Fig. 5c) and it is mainly driven by the cooling related to evaporation of rain below 2 km (as BT attains values equivalent to –1 K at the cloud base and –3 K near the surface, obtained as a difference field from Fig. 5b) and also by loading (see the L field in Fig. 5b) and melting of graupel/hail at higher levels (Fig. 5c) that contributes to negative values of BT above cloud base and below the melting level.
The time of 60 minutes (13:26 CST accordingly KW91) is coincident with the occurrence of the microburst at the surface. The model satisfactorily reproduces the surface–level wind divergence (simulated maximum value is 6.7 x 10⁻³ s–1, Figure 6a, versus the observed one of 7.5 x 10⁻³ s–1, see Table II). The model captures the typical domed structure in the perturbation pressure field (peak value 2.7 hPa, not shown).
It is remarkable, at this time, the presence of a unique and continuous downdraft at mid/upper levels identified with the penetrating downdraft P that maximizes (around –11 ms–1) at 11 km within the downshear flank of the cloud, where both contributing terms on (1) are in the same sense (BNET and VPPG) after merging with the upper part of the MLD in the downshear flank (Fig. 6b). Cotton and Anthes (1989) have discussed the possible feedback between penetrative downdrafts and dynamical wake entrainment (identified in this case as a forcing of the MLD).
As to the PRD core, it remains at the same location and with similar strength as 2 min earlier (compare Fig. 5c with Fig. 6b). Both the PRD and the horizontal outflow at the surface are mainly driven by cooling (extreme negative potential temperature perturbation values –5.7 K at the ground and negative values of Bnet, Fig. 6c) related to melting of graupel/hail above the cloud base (Fig. 6b) and to the evaporation of rain within the neutrally stable subcloud layer, respectively.
Table II presents a summary of the simulated and observed values forthe relevant storm parameters. It shows that the agreement between the control experiment and the observed storm is quite satisfactory in terms of cloud motion and dimensions, precipitation related parameters and microburst simulation. However, the model overestimates the maximum vertical velocity in 50% and apparently underestimates the magnitude of the MLD. Given the limitations in the data set collected during MIST to depict the complete downdraft field at upper levels, it is not definitively clear if the observed value of–15 ms–1 is not a result of a possible merging of the MLD with a penetrative downdraft P, as occurs in the simulation.
4. Analysis of the tested factors effects through algorithms E1, E2, E3 and E4
The method described in section 2.2 is used to isolate and compare the relative magnitudes of contributions to the main downdrafts induced by warm microphysics processes (E1), induced by the presence of the ice–phase (E2), the contribution due to vertical wind shear (E3) and the synergistic effect between these two factors (E4). These algorithms have been computed for the particular Alabama thunderstorm case, at representative times and height levels.
As the E1 and E2 fields (not shown) are driven, according to the definitions, by the experiments A4 and A2 that switch off the environmental wind field, the storm initiates and remains centered in the middle of the domain during its whole life, being within the dissipation stage at 54 min when the PRD maximizes in these two experiments.
The ice effect field given by E2 exhibits a contribution of–3 ms–1 (Fig. 7a) to the total magnitude of–9 ms–1 attained in the A2 experiment (Fig. 7b). According to results in the experiment A2, this downward motion is mainly forced by the collective effects of precipitation loading, melting of graupel/hail (switch off in A4) and the evaporational cooling. Concerning the P downdraft in the experiments without environmental wind shear, it is reproduced in A2 (Fig. 7b), where the upper part of the cloud presents its larger horizontal extent, whereas is not present in the already extremely narrow cloud in A4 (not shown). In A4 there is only a pair of downdrafts to the side of the cloud which corresponds to the compensating motions in the environment.
Regarding the beginning of the MLD the sensitivity analysis starts at 54 minutes. This time exhibits an early MLD with a minimum value of –3 ms–1 (Fig. 4b) at 6.525 km height level for the control experiment. Vertical motion fields at this level for the difference algorithms E3 and E4 and for the control experiment are displayed in Figures 8a–c. Both algorithms (E1 and E2), exhibit a null contribution to the MLD, consistent with the absence of a vertical wind shear. On the contrary, under the presence of the observed environmental wind profile, the simulated storm in A1 and A3, evolves in the SE sector of the model domain. Therefore, the MLD is entirely explained by the E3 (coincident with A3 in this case) and E4 (coincident with A1–A3) effects, both in the SE region. Coherently, the E3 field (Fig. 8a) shows the position of the cloud, displaced towards the SE respect to its position in A4. Also, the absence of vertical motion in the central area of the domain in the A1 experiment requires a compensation of the effects E1 to E4 in this particular area.
The role of the environmental wind shear in terms of organizing the MLD, is also clearly revealed in the A3 experiment which suppresses the ice phase. A3 exhibits a weaker intensity in the main updraft and shallower cloud depth during the cloud life cycle respect to A1 because the absence of freezing and related latent heating release inhibit the stronger development and vertical growth attained in A1. However, at mid levels and at 54 min, a weak dipole in the horizontal pressure perturbation pattern (high–low) is present (not shown) as in A1, also favoring the entrainment and related cloud–edge evaporative cooling in the downshear side of the cloud at mid levels depicted in the negative values of BT (Fig. 9). The dynamical and thermodynamic forcings of the MLD in its upper part in A3 are acting in the downshear side of the cloud as in A1. However, relative contributions to downward motion by L, BT and VPPG in the core of the MLD are different respect to those obtained in experiment A1. In the present case, L is the main responsible of negative BNET values and the VPPG effect (not shown) is negligible, whereas in the control experiment this last contribution is significant and both L and BT equally contribute to the negative BNET pattern. Although the vertical wind shear is weak, the location of the MLD in the eastern portion of the cloud (value of–2 ms–1 in Fig. 8a) is coherent with the dominant eastward component of the shear in the first 7 km height.
The effect of the joint two factors contribution in E4 is reduced to the effect of the ice in the presence of wind shear and is relatively weaker than the effect when the only condensated phase present is liquid water. The ice–phase provides an additional enhancement of the MLD (–1 ms–1) in the northeastern area of the cloud that adds to the A3 field to determine the MLD value of–3 ms–1 inA1 (Fig. 8c).
In what follows, a similar analysis is presented at 58 minutes and at levels height of 7.875 and 1.575 km, time and levels representative of the vigorous MLD and PRD, respectively, in the control experiment. A horizontal slice at the level of the developing MLD (7.875 km) for the resulting fields provided by the algorithms E1 and E2, shows a similar behavior to the previous time as they do not contribute to the MLD and PRD.
The effect E3 in the MLD at this time is shown in Figure 10a, characterized by a similar vertical motion pattern as the one obtained at 54 minutes. Nevertheless, the visualization of the L and BT fields in relationship with the MLD at 7.875 km height level (Fig. 11) allows to recognize the differences with the previous time. The MLD is weakened by a downward motion (warming effect) in clear air, which is over–compensated by L and a negligible effect of the VPPG (not shown). The "pure" MLD has gradually lost its initial non–precipitating character and evolved into an elevated PRD outside the cloud. In relationship to the ice phase effect in a wind shear environment (E4) the field at 58 minutes differs completely respect to the previous time. The L core is still elevated in A3 and consequently it has a greater contribution to the MLD (around –9 ms–1 ) which translates in the positive center in the E4 field (Fig. 10b); this effect is reflected in a weaker MLD (around –7 ms–1) inA1 (Fig. 10c).
The PRD position at 58 minutes has been previously identified in Figures 5a and 11 for the experiments A1 and A3, respectively. The effects E3 and E4 on the PRD at 1.575 km height are depicted in Figures 10d and 10e. The PRD forcing related to the evaporative cooling in the A3 experiment (E3 effect, evident in Fig. 10d) and to the ice melting (E4 effect, depicted in Fig. 10e) contribute with similar magnitudes to the intensity of the PRD in the control experiment (Fig. 10f), although the E4 effect slightly dominates over the E3 effect. This last result is coherent with KW91 and WB88 findings, where the ice phase melting was recognized as the main process to generate the microburst.
Figure 12 depicts the position of the penetrative downdraft (P) at 60 minutes in the A3 experiment which corresponds to the time of its maximum intensity in the control experiment (Fig. 6b). It is quite evident from Figure 12 the negative buoyancy center related to evaporation due to the entrainment of clear air above the cloud into the cloud–top, which was already effective in evaporating and separating the top from the cloud volume. This evaporative cooling reflects in the E3 field, distinguishable in Figure 13a, where the descending motion is mostly located outside the cloud, whereas the presence of the ice phase in the control experiment produces BNET > 0 (Fig. 6c) at height levels where the wind vector has an eastward component, which locates the updraft in the western sector of the cloud. The ice effect in a vertical shear environment E4 (Figure 13b) shows a positive vertical motion core coincident with the core of total ice mixing ratio, located within an area of downward motion for the E3 field (compare Fig. 13a with 13b). A strong horizontal gradient of the total ice phase mixing ratio toward the east zone of the cloud in E4, allows descending motion in phase with E3, and both contribute to intensify the P at this position in the control case (Fig. 13c).
5. Discussion
As summarized in Table II, the analysis of the control experiment shows a fairly good representation of the main internal Alabama storm features during the different stages in its life cycle. The convective growth, the constriction and the intensity of the divergent outflow velocity differential in the microburst are coherently simulated.
The general results in this study are similar to those found in previous work, in terms of the identification of different forcings of main convective downdrafts (Srivastava, 1985 and 1987; Knupp and Cotton, 1985; Knupp, 1987 and 1989) but the present study emphasizes the dynamic role of enviromental wind shear and ice phase in a case study of a strong microburst.
Even if the methodology of factor's separation (Stein and Albert, 1993) has been strictly applied it was not possible to achieve a clear separation of the effects of the tested factors in this particular problem of convection. While in the experiments conducted without environmental shear the cloud forms in the center of the domain, in the other two cases the cloud is displaced southeasterly leading to non collocated clouds in the two pair of experiments. Also, as the existence of the MLD is closely bound to the presence of a vertical wind shear, this feature can only be compared in the experiments where this factor is present.
Alternatively, instead of simulating convection in the absence of vertical shear using a calm environment as was done in A2 and A4, a test was performed (not shown) simulating a symmetric cloud in an environment with a horizontal wind constant with height. This procedure forces the cloud to be in the same location in the four experiments. However, a temporal lag in the cloud life simulation was found (as expected and coherent with the results already found) in the experiments with respect to those without environmental wind shear, that dominates the difference fields instead of isolating the effect of the factors in the P and PRD.
Even if these results preclude to apply the Stein and Albert's (1993) methodology to properly compute all the Ei algorithms, it proved to be useful to analyze the effect of the ice in the three main downdrafts in the presence of wind shear (analyzing A3 and E4 fields) at the time and level where they maximize in experiments A1 and A3, and to isolate the ice effect in the PRD and P in the absence of wind shear (analyzing E2 difference fields) at the time and level at which these two downdrafts maximize in the A2 and A4 experiments.
The primary findings from the sensitivity analysis of factors are as follows:
• The results confirm the role of the interaction between the environmental vertical wind shear and the updraft, in the MLD genesis. Consistently, the absence of vertical wind shear in experiments A2 and A4, inhibits the MLD formation. But, the presence of a shear, even a weak one, as in the Alabama case, is still able to develop a strong MLD (cases A1 and A3).
• Although the beginning of the MLD in both experiments A1 and A3 is mainly explained by the same mechanism and attains the same intensity, the lack of the ice phase can modify the cloud evolution resulting in a different relative contribution of the different forcings. Meanwhile the MLD in A1 is largely driven by VPPG, in A3 is dominated by the loading. This may be partially explained by the presence of the graupel–hail category in A1 that replaces the slowly falling supercooled raindrops that substantially contribute to loading at the levels where the MLD is located.
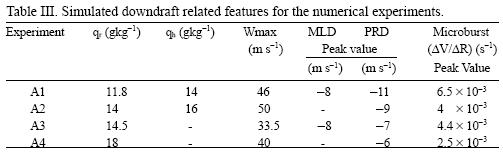
• There is an earlier and more vigorous growth in the experiment A2 without the inhibiting shear effect compared to A1 (see maximum values of updraft velocity and specific humidity for the precipitating species in Table III). A symmetric P downdraft is apparent at the top of the cloud, earlier respect to A1, and evolves in the compensatory motions that gradually become stronger mostly inside the cloud at upper levels (Fig. 7b).
• Both, weaker PRD and outflow divergent wind at the surface develop in the sensitivity experiments A2 and A4 compared to the one simulated in A1 (Table III). This result may be associated with the longer duration and relatively better organization of this last case (Table I), enabled by the presence of a vertical wind shear that guarantees the simultaneous maintenance of the two branches of the circulation in different locations of the storm: the inflow to the updraft and the PRD and its outflow (Fig. 5). The gradual erosion of the cloud base in A2 is due to the vertical alignment of the updraft and the PRD.
• Maximum descending motion within the PRD core and maximum outflow divergent wind at the surface attain lower peak values in A3 than in A1 (Table III), consistent with the absence of the dominant cooling effect of melting, also supported by previous research (Srivastava, 1987).
• In agreement with Yuter and Houze (1995) the PRD and the MLD form separately. Only when they become aligned in the vertical (as in A1 at 54 min, see Fig. 4c) a unique draft is apparent with its core alternatively located at low or at mid levels, depending on which of the two drafts is the dominant one at a given time in the storm life. A similar connection between the P and the MLD is also reproduced but only when the ice phase is included. This last result emphasizes the complex relationship between microphysics and dynamics in deep convective clouds.
• Although the model correctly reproduces most of the storm features, the maximum updraft is actually overestimated. In order to analyze if the model is capable to reproduce smaller maximum updraft values different sensitivity experiments have been performed varying the turbulence parameterization: turn off the turbulence treatment, use different parameterizations available in ARPS or else use the same parameterizations as in A1, but modifying the horizontal resolution in order to modify the mixing length which is numerical resolution dependent. The updraft intensity is dependent on the turbulence treatment and it diminishes as the turbulence is increased. The model proves to be highly sensitive to these tests. On the contrary, maximum reflectivity magnitude remains around 65–69dBZ in all cases. The presence of graupel/hail in the location of maximum Ze explains the highest values. Values of these parameters (updraft and reflectivity) closer to the observed in the Alabama storm have been attained in one of the experiments. As the model spatial resolution was specified keeping in mind the available radar data resolution (section 2.1), the main focus in is the sensitivity studies and Ze is obtained by a semi–empirical relationship, no strict model validation is considered realistic and accordingly no tuning to the observations has been pursued for this parameter.
As these numerical results provide a useful insigth into the primary downdraft forcings, the ARPS model has been used in our country (northeastern Argentina) in severe downdraft events (Torres Brizuela, 2005). The simulation of the release of large conditional instability in deep convective clouds under conditions of extremely high low–level equivalent potential temperatures (exceeding 365 K) leaded to similar life cycle evolution, downdraft structure and wet downbursts to those simulated in the present case.
Acknowledgements
This work was partially supported by: ANPCyT grant PICT 2003 N° 07–14420, the University of Buenos Aires grant UBACYT X266, and by the grant IAI CRN–055. First author was finantially supported with a postdoctoral fellowship under the IAI CRN–055 grant.
References
Betts A. K. and M. F. Silva Días, 1979. Unsaturated downdraft thermodynamics in cumulonimbus. J. Atmos. Sci. 36, 1061–1071. [ Links ]
Cotton W. R. and R. A. Anthes, 1989. Storm and cloud dynamics. Academic Press, USA, 883 pp. [ Links ]
Dodge J., J. Arnold, G. Wilson, J. Evans and T. T. Fujita, 1986. The Cooperative Huntsville Meteorological Experiment (COHMEX). B. Am. Meteorol. Soc. 67, 417–419. [ Links ]
Fujita T. T., 1981. Tornadoes and downbursts in the context of generalized planetary scales. J. Atmos. Sci. 38, 1512–1534. [ Links ]
Fujita T. T. and R. M. Wakimoto, 1983. Microbursts in JAWS depicted by Doppler radars, PAM, and aerial photographs. Preprints, 21st Conference on Radar Meteorology, Edmonton, Canada, American Meteorological Society, Boston, 638–645. [ Links ]
Fujita T.T., 1985. The downburst–microburst and macroburst. Reports of projects NIMROD and JAWS, SMRP, University of Chicago, Chicago, 122 pp. [ Links ]
Hjelmfelt M. R., H. D. Orville, R. D. Roberts, J. P. Chen and F. J. Kopp, 1989. Observational and numerical study of a microburst–line producing storm. J. Atmos. Sci. 46, 2731–2743. [ Links ]
Kessinger C. J., R. D. Roberts and K. L. Elmore, 1986. A summary of microburst characteristics from low–reflectivity storms. Preprints, 23rd Conf. On Radar Meteorology, Edmonton, American Meteorological society, Boston, J105–J108. [ Links ]
Kingsmill D. E. and R. M Wakimoto, 1991. Kinematic, dynamic, and thermodynamic analysis of a weakly sheared severe thunderstorm over northern Alabama. Mon. Wea. Rev. 119, 262–297. [ Links ]
Klemp J. B. and R. B. Wilhelmson, 1987. The simulation of a three dimensional convective storm dynamics. J. Atmos. Sci. 35, 1070–1096. [ Links ]
Knupp K. R. and W. R. Cotton, 1985. Precipitating convective cloud downdraft structure: An interpretative survey. Rev. Geophys. 23, 183–215. [ Links ]
Knupp K. R., 1987. Downdrafts within high plains cumulonimbi. Part I. General kinematic structure. J. Atmos. Sci. 44, 987–1008. [ Links ]
Knupp K. R., 1989. Numerical simulation of low–level downdraft initiation within precipitating cumulonimbi: Some preliminary results. J. Atmos. Sci. 117, 1517–1529. [ Links ]
Lin Y. L., R. D. Farley and H.D. Orville, 1983. Bulk parameterization of the snow field in a cloud model. J. Clim. Appl. Meteorol. 22, 2192–2210. [ Links ]
Nicolini M. and M. Torres Brizuela, 1997. Convective strong winds statistics at Ezeiza and Resistencia and a numerical study of forcings in a real case. Meteorologica 22, 9–35. [ Links ]
Orville H. D., R. D. Farley, Y–C. Chi and F. J. Kopp, 1989. The primary cloud physics mechanisms of microburst formation. Atmos. Res. 24, 343–357. [ Links ]
Parsons D. B. and M. L. Weisman, 1993. A numerical study of a rotating downburst. J. Atmos. Sci. 50, 2369–2385, [ Links ]
Proctor F. H., 1988. Numerical simulations of an isolated microburst. Part I: Dynamics and structure. J. Atmos. Sci. 46, 3137–3160. [ Links ]
Proctor F. H., 1989. Numerical simulations of an isolated microburst. Part II: Sensitivity experiments. J. Atmos. Sci. 45, 2143–2165. [ Links ]
Rogers R. R. and M. K. Yau, 1989. A short course in cloud physics. Pergamon Press., Oxford, 293 pp. [ Links ]
Rotunno R. and J. B. Klemp, 1982. The influence of shear–induced pressure gradient on thunderstorm motion. Mon. Wea. Rev. 110, 136–151. [ Links ]
Srivastava R. C., 1985. A simple model of evaporatively driven downdraft application to microburst downdraft. J. Atmos. Sci. 42, 1004–1023. [ Links ]
Srivastava R. C., 1987. A model of intense downdrafts driven by the melting and evaporation of precipitation. J. Atmos. Sci. 44, 1752–1773. [ Links ]
Stein U. and P. Albert, 1993. Factor separation in numerical simulations. J. Atmos. Sci. 50, 2107–2115. [ Links ]
Straka J. M. and J. R. Anderson, 1993. Numerical simulation of a microburst–producing storms: Some results from storms observed during COHMEX. J. Atmos. Sci. 50, 1329–1348. [ Links ]
Torres Brizuela M. M., 2005. Simulación de tormentas convectivas severas en el entorno de Resistencia con un modelo numérico. Doctoral thesis, Departamento de Ciencias Atmosféricas, Universidad de Buenos Aires, Argentina, 242 pp. [ Links ]
Trípoli G. J. and W. R. Cotton, 1986. An intense, quasi–steady thunderstorm over mountainous terrain. Part IV: Three–dimensional numerical simulations. J. Atmos. Sci. 43, 894–912. [ Links ]
Tuttle J. D., V. N. Bringi, H. D. Orville and F. J. Kopp, 1989. Multiparameter radar study of a microburst: Comparisons with model results. J. Atmos. Sci. 46, 601–620. [ Links ]
Wakimoto R. M. and V. N. Bringi, 1988. Dual–polarization observations of microbursts associated with intense convection: The 20 July storm during the MIST Project. Mon. Wea. Rev. 116, 1521–1538. [ Links ]
Wakimoto R. M., 2001. Convectively driven high wind events. Meteorological Monograph. Vol. 28, N°50, Chapter 7. (III Doswell, Ed.) AMS, Boston, 255–298. [ Links ]
Weisman M. L. and J. B. Klemp, 1982. The dependence of numerically simulated convective storms on wind shear and buoyancy. Mon. Wea. Rev. 112, 2479–2498. [ Links ]
Xue M., K. Droegermeir and V. Wong, 2000. The Advanced Regional Prediction System (ARPS) – A multiscale non–hydrostatic atmospheric simulation and prediction tool. Part I: Model dynamics and verification. Meteorol. Atmos. Phys. 75, 161–193. [ Links ]
Yuter S. E and R. A Houze Jr., 1995. Three–dimensional and microphysical evolution of Florida cumulonimbus. Part I: Spatial distribution of updrfats, downdrafts, and precipitation. Mon. Wea. Rev. 123, 1921–1940. [ Links ]

