


Servicios Personalizados
Revista

Articulo
 Inglés (pdf)
 Artículo en XML
 Referencias del artículo
 Enviar artículo por email
Indicadores
 Citado por SciELO
 Links relacionados
-
 Similares en
SciELO
Similares en
SciELO
Compartir

 Permalink
Atmósfera
versión impresa ISSN 0187-6236
Atmósfera vol.20 no.3 Ciudad de México jul. 2007
Human thermal comfort over three different land surfaces during summer in the city of Erzurum, Turkey
S. YILMAZ
Department of Landscape Architecture, Faculty of Agriculture, Ataturk University
25240, Erzurum, Turkey
Correponding author; e–mail: syilmaz_68@hotmail.com
S. TOY
Landscape Architect, Meteorological Institute of Erzurum, Turkey
H. YILMAZ
Department of Landscape Architecture, Faculty of Agriculture, Ataturk University
25240, Erzurum, Turkey
Received March 23, 2006; accepted November 16, 2006
RESUMEN
En este estudio se compararon las diferencias biochmatológicas humanas en tres diferentes superficies, concreto asfáltico, suelo y pasto, 2 m sobre el nivel del suelo en la ciudad de Erzurum, Turquía. Se utilizó una serie de datos obtenidos durante 15 días claros y en calma en agosto de 2005 y un índice bioclimatológico adecuado, el índice termohigrométrico (THI). En relación con la comodidad térmica humana, se encontró que el suelo fue la superficie con más ventajas, pero para los valores promedio del THI el pasto exhibió características más favorables, mientras que la superficie menos favorable fue el concreto asfáltico.
ABSTRACT
In the present study an attempt has been made to compare the differences in human bioclimatological conditions 2 m above the ground between three different land surfaces: asphalt concrete, soil and grass surfaces, using a data set obtained on 15 clear and calm days in August 2005, and an appropriate bioclimatological index, the thermohygrometric index (THI) in the city of Erzurum, Turkey. In the respect of human thermal comfort, soil surface was found to be the most advantageous surface but for the mean THI values grass surface exhibits more favourable features while the least favourable features were presented by the asphalt concrete surface.
Keywords: Asphalt concrete surface, soil surface, grass surface, thermohygrometric index (THI), thermal comfort.
1. Introduction
The temperature of the air near the ground, which directly affects humans, is dependent on the absorption of sunlight by solid surfaces (Gedzelman, 1980). The reason is the basic atmospheric heating principle that the air is heated from bottom to top. For this, the heating rate depends on the surface properties. In this respect, albedo (reflectivity) of the surfaces plays the most important role in this phenomenon. A general rule of thumb is that dark colour or wet surfaces have lower albedos while light colored or dry surfaces have higher albedos (Harris, 2004).
Today's urbanized cities comprise asphalt roads, concrete pavements, parking lots, buildings and because these surfaces are quite dark, they absorb most of the visible light that falls on them. Thus the absorbed solar energy heats up the pavement. In turn, the air is heated by the pavement and areas warmer than their surroundings appear over these surfaces in the cities, which is known as urban heat island (UHI). The excessive heating may deteriorate thermal comfort conditions in the warm season.
Human thermal comfort is defined as the condition of mind which expresses satisfaction with the thermal environment, absence of thermal discomfort or conditions in which 80 or 90% of people do not express dissatisfaction. Variables of thermal comfort are the air temperature, radiant temperature, relative humidity, air velocity, activity and clothing (ASHRAE 55–2004). Since these elements other than activity and clothing are directly associated with the surface features, thermal comfort is mainly affected by the surfaces at a given point. It is generally known that the air 2 m above the ground is the most effective atmospheric level on the human activities.
Research on indoor and outdoor human thermal comfort have been carried out for many years by many authors some of whom have put forward a bioclimatologic comfort model (indices) such as Thom (1959), Lally and Watson (1960), Givoni (1963), Olgyay (1963), Fanger (1970), Masterson and Richardson (1979), Winterling (1979), Jendritzky and Nübler (1981), Kalkstein (1982), Weiss (1983) and Steadman (1984); while others used these indices in their case studies such as Matzarakis and Mayer (1997), Giles and Balafoutis (1990), Mayer and Höppe (1987), Unger 1999, Baker et al. (2002) and Toy et al. (2007).
In the present study an attempt has been made to compare differences in human bioclimatological conditions 2 m above the ground among three different land surfaces (asphalt concrete, soil and grass surfaces), during summer in the city of Erzurum, Turkey, using a data set obtained on 15 clear and calm days in August 2005 and an appropriate bioclimatological index, the thermohygrometric index (Thom, 1959).
2. Materials and methods
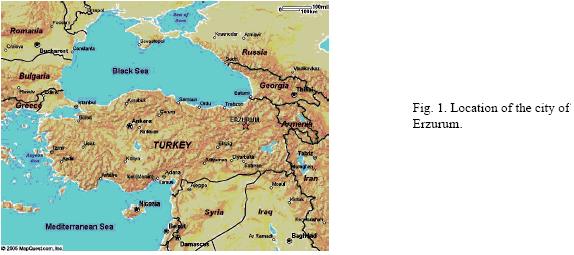
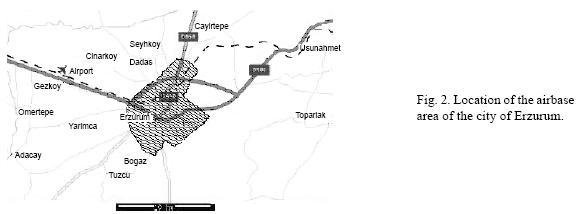
This study was conducted in the airbase area of the city of Erzurum, Turkey (Fig. 1). Data were obtained from the station at an elevation of 1754 masl and a location of 39° 57 N and 41° 10 E, in the airbase area lying about 7 km from the city edge (Fig. 2). The airbase is surrounded by the vast open area in all directions. There are no buildings or human activities around the station except for the cultivated area which is 4 km from the station and where plants that do not need watering are grown (Toy et. al., 2007).
According to the climatic values measured at the station in the airbase area between 1988 and 2003, the mean daily temperature is 5.2 °C, diurnal temperature range is 15.1 °C, the maximum temperature measured so far is 35.6 °C and the minimum is –37.2 °C. Annual rainfall is 401.6 mm and average relative humidity is 63.3%. Mean vapour pressure is 6.0 mb. Mean daily wind speed is 2.7 m/sec and prevalent wind direction is ENE in summer and WSW in winter due to frontal systems (Toy et. al., 2007). The hottest month of the year in the study area is August with monthly average temperature of 19.2 °C.
The data used were obtained from the Meteorological Observation Station in the airbase area, where an Automated Weather Observation System (AWOS) has been running for nearly three years now. The measurement system in the study area, AWOS with a measurement range from –52 to +60 °C and accuracy at +20 °C ± 0.3 °C, is an automatic observation system capable of getting data every two minutes. The temperature sensors had been placed 2 m above three different surfaces including runway, taken as asphalt concrete surface, grass and bare soil nearly 3 years before the study (Fig 3). The temperature and relative humidity values obtained above these surfaces were transmitted to the data logger, stored and processed.

Although observations have been carried out for nearly three years continously, only the temperature values in August (2005; because of being the hottest month of the year on the average) were taken and for the purpose of this study, all other observational days in the month except for the days 1, 6, 8, 9, 12, 13, 15, 16, 17, 18, 20, 22, 24, 25 and 26, were rejected because of the variable weather, as in the study of Ca et al. (1998). During the days except for those mentioned above, the weather was partly or wholly cloudy, rainy or windy, which is not representative for the study and the hot summer days in this area of Turkey.
Because the aim of this study was to evaluate the direct effects of the surfaces on thermal comfort, wind component, one of the aforementioned thermal comfort elements, was not included in the evaluation, which was also convenient with the index used. For this purpose, among the bioclimatologic indices, thermohigrometric index, THI (Thom, 1959), was chosen to evaluate the values obtained. The widely used temperature–humidity index, also known as the heat index (Thom, 1959) was used as a measure of human comfort as in the studies by Kyle (1994), Unger (1999) and Toy et al. (2007), who used it in the same area to compare the thermal comforts between rural, urban and urban forest.
Formula of the THI index is (Unger, 1999):
THI (°C) = t – (0.55 – 0.0055f) (t–14.5) .
Where (t) is air temperature measured in degrees Celsius and f is the relative humidity.
Unger (1999) writes: "The THI was used originally to determine the discomfort due to heat stress; therefore, it has been evaluated over a much wider range of conditions (Kyle, 1994). As a result, the optimum occurs between 15 and 20 °C, and that is the basis for defining comfortable conditions. Below a THI of 15 °C, evaporation, which constantly takes place at the skin surface even in the absence of apparent perspiration, takes away heat from the body thus requiring defence against cooling. Hence, below a THI of 15 °C there is a series of categories where increasing thermogenetic mechanisms are required to combat increasing cold stress. The opposite process occurs above a THI of 20 °C, because the perspiration system becomes effective as a cooling mechanism to prevent overheating. The higher the THI the more ineffective this mechanism becomes, so a series of categories has been introduced above the comfortable zone, where the heat stress is increasing" (Fig. 4).

3. Results and discussion
From the calculated THI values, human bioclimatic comfort conditions 2 m above the surfaces were determined over 24 hours of 15 calm and clear days. From Figure 4, it can be seen at which hours of the day people can perform their activities comfortably and, from Figure 5, the thermal comfort differences between the surfaces can be seen. According to Figure 4, four THI categories of "very hot", "hot", "comfortable" and "cool" are prevalent above the asphalt concrete while above soil and grass "very hot" range was replaced with "cold" range. If the time period of 24 hours is considered as 100%, for the asphalt concrete (AC), 20.8% of the day (5 hours) is in the "very hot" THI category, which occurs from 08:00 to 12:00 with a maximum of 28.1 °C at 10:00 (Fig. 4); above soil and grass this extreme category cannot be seen.
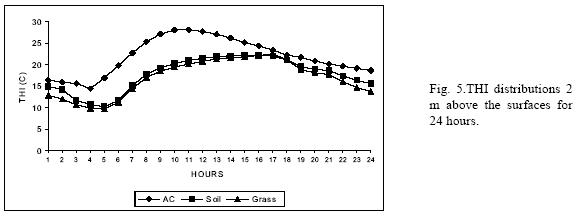
The "comfortable" range dominates above the asphalt concrete surface one–third of the day (33.3%), mainly from 21:00 to 05:00 except at 03:00 which is "cool". Above soil surface, this condition pertains for 37.5% of the day, from 18:00 to 22:00 and 06:00 to 09:00 while it is prevalent above grass for 29.2%, from 07:00 to 09:00 and 18:00 to 21:00. Above the asphalt concrete surface, 4.2% of the day (only one hour, 03:00) enters in the "cool" range, while above soil 8.3% (two hours, 00:00 and 01:00) and grass 12.5% (3 hours, at 06:00, 22:00 and 23:00) of the day are in this range (Fig. 4).
The most dominant bioclimatic type above the surfaces is the "hot" one. Above the asphalt concrete surface, it prevails in a period from 06:00 to 20:00 except for the aforementioned "hot" interval from 08:00 to 12:00 in 41.7% of the day while above soil this range is seen from 09:00 to 17:00 (37.5%) and above grass it appears from 10:00 to 17.00 in 33.3% of the day (Fig. 4).
It can be stated from the outcomes of the study that the soil area has the most advantageous effects on the thermal conditions of humans for the "comfortable" conditions, which occur more frequently but the proportion of a "hot" period is higher than that of grass. From Figure 4, it is obvious that thermal comfort values above asphalt concrete are always higher than others, while those of soil are higher than grass with exception of 16.00 and 17:00 when THI values above grass are slightly higher.
Surface temperature of the asphalt concrete is likely to be warmer (due to lower albedo) than others and thus radiate heat which will worsen thermal comfort conditions during the day. However, due to the thermal mass of the asphalt, much of the absorbed solar radiation will be stored in the material and released after sunset which will improve thermal comfort conditions at night.
Distribution of the "comfortable" hours above soil is thought not to be an advantage because these are the hours when human activities take place less than others. From this point, grass surface has the most advantageous features, where "comfort" range is seen from 07:00 to 09:00. For the "hot" range, which is prevalent most of the daytime, the most favourable surface is the grass again, because the number of "hot" hours is less than others and the values are lower (Fig. 4).
It seems that for the "comfortable" range grass is the least advantageous surface but it has more advantages for the number of "hot" range, which is less than others. This means that in terms of average, the coolest area is above grass surface with 17.0 °C, followed by soil with 18.0 °C and asphalt concrete with 22.0 °C. The grass surface in this study is an un–irrigated natural surface; the thermal comfort would probably have been better above the grass surface if it had been irrigated.
Warner (1991) suggests that landscape architects should design spaces to create optimal thermal comfort or comfort for the majority. When designing for optimal thermal comfort, one should try to eliminate climatic extremes because these are the conditions pedestrians most want to avoid. This study shows that even if it is under no or a poor maintenance condition, grass may have more favourable features than the impervious surfaces (such as asphalt concrete) and in the new landscape design processes the area of these surfaces must be reduced and perhaps grass or porous pavements, described by Pomerantz et al.(1997) may be utilized more densely.
The human response to the thermal environment is impossible to express as a function of only one environmental factor (Givoni, 1963). Several factors affect human thermal comfort including: air temperature, wind, humidity, metabolic rate, age, sex, and clothing levels. In this study, THI index, which uses only temperature and humidity was utilized.
4. Conclusion
In the present study, three different land surfaces were compared in the respect of human thermal comfort and soil surface was found to be the most advantageous surface for the "comfort" range, while the least favourable features were presented by the asphalt concrete surface. But in terms of mean THI values, grass surface has the most favourable features. The values in this study may be important for that they may show the pure effects of the surfaces on the thermal comfort 2 m above these surfaces, also because it was carried out in an environment away from the urban effects and in a period when no prevalent wind was present and sky was clear.
This study shows that area of impervious surfaces must be reduced and alternative surfaces especially those natural originated must be utilized more densely. Because this study concerns only the warmest month, in other seasons the asphalt concrete may be advantageous and for that reason, following studies must be carried out in different seasons.
Great care should be taken in designing urban spaces and landscape architects or urban designers should avoid large asphalt surface and rather use a mix of impervious and porous materials or lighter colour pavements and preferably provide shade of the ground from e.g. shading trees.
References
ASHRAE, 2004. Thermal environmental conditions for human occupancy. ANSI/American Society of Heating, Refrigerating, and Air–Conditioning Engineers Standard. Atlanta, 35 pp. [ Links ]
Baker L. A., A. J. Brazel, N. Selover, C. Martin, N. McIntyre, F. R. Steiner, A. Nelson and L. Mucacchio, 2002. Urbanization and warming of Phoenix (Arizona, USA): Impacts, feedbacks and mitigation urban ecosystems, Urban Ecosystems, 6, 183–203. [ Links ]
Ca V. T., T. Asaeda and E. M. Abu, 1998. Reductions in airconditioning energy caused by a nearby park. Energy and Buildings 29, 83–92. [ Links ]
Fanger P. O., 1970. Thermal comfort. 1st. Ed. McGraw–Hill Book Co, New York, 244 pp. [ Links ]
Gedzelman S. D., 1980. The science and wonder of the atmosphere. J. Wiley and Sons, New York, 535 pp. [ Links ]
Giles B. D. and C. H. Balafoutis, 1990. The greek heatwaves of 1987 and 1988. Int J. Climatol. 10, 505–517. [ Links ]
Givoni B., 1963. Estimation of the effect of climate on man: Development of a new thermal index. Building Research Station Research Report to UNESCO. Technion – Israel Institute of Technology, Haifa, Israel, 85 pp. [ Links ]
Harris A. M., 2004. Designing with climate: Using parking lots to mitigate urban climate, Thesis submitted to the Faculty of Virginia Polytechnic Institute and State University, in partial fulfillment of the requirements for the degree of Master of Landscape Architecture, Department of Landscape Architecture College of Architecture and Urban Studies, Blacksburg, Virginia, 77 pp. [ Links ]
Jendritzky G. and W. Nübler, 1981. A model analysing the urban thermal environment in physiologically significant terms. Arch. Meteor. Geophys. Bioclimatol. Serial B 29, 313–326. [ Links ]
Kalkstein L. S., 1982. The weather stress index. NOAA Technical Procedures Bulletin 324, 1–16. [ Links ]
Kyle W. J., 1994. The human bioclimate of Hong Kong. In Brazil (R. and M. Kolar Eds.) Contemporary Climatology, Proc. of COC/IGU Meeting, 15–20 August, 1994, Brno, Czech Republic, Masaryk University, Brno, Czech Republic, 345–350. [ Links ]
Lally V. E and B. F. Watson, 1960. Humiture revisited. Weatherwise 13, 254–256. [ Links ]
Masterson J. and F. A. Richardson, 1979. Humidex, a method of quantifying human discomfort due to excessive heat and humidity. Environment Canada, Downsview, Ontario, p.45 [ Links ]
Matzarakis A. and H. Mayer, 1997. Heat stress in Greece. Int J. Biometeorology 41, 34–39. [ Links ]
Mayer H. and P. Höppe, 1987. Thermal comfort of man in different urban environments. Theor. Appl. Climatol. 38, 43–49. [ Links ]
Olgyay V., 1963. Design with climate: Bioclimatic approach to architectural regionalism. Van Nostrand Reinhold, New York, 190 pp. [ Links ]
Pomerantz M., H. Akbari, A. Chen, H. Taha and A. H. Rosenfeld, 1997. Paving materials for heat island mitigation, Berkeley, CA: Lawrence Berkeley National Laboratory. LBNL–38074. [ Links ]
Steadman R. G., 1984. A universal scale of apparent temperature. J. Clim. Appl. Meteor. 23, 1674–1687. [ Links ]
Thom E. C., 1959. The discomfort index. Weatherwise 12, 57–60. [ Links ]
Toy S, S. Yilmaz and H. Yilmaz, 2007. Determination of bioclimatic comfort in three different land uses in the city of Erzurum, Turkey. Building and Environment 42, 1315–1318. [ Links ]
Unger J., 1999. Comparisons of urban and rural bioclimatological conditions in the case of a Central–European city. Int. J. Biometeorology 43, 139–144. [ Links ]
Warner G. E, 1991. Predicting pedestrian use on outdoor urban plazas utilizing climate/behavior models. MLA thesis, Virginia Polytechnic Institute and State University, 102 pp. [ Links ]
Weiss M. H., 1983. Quantifying summer discomfort. Bull. Amer. Meteor. Soc. 64, 654–655. [ Links ]
Winterling. G. A., 1979: Humiture–revised and adapted for the summer season in Jacksonville, Fl. Bul. Amer. Meteor. Soc. 60, 329–330. [ Links ]

