


Services on Demand
Journal

Article
 English (pdf)
 Article in xml format
 Article references
 Send this article by e-mail
Indicators
 Cited by SciELO
 Related links
-
 Similars in
SciELO
Similars in
SciELO
Share

 Permalink
Atmósfera
Print version ISSN 0187-6236
Atmósfera vol.20 n.3 Ciudad de México Jul. 2007
Evolution of atmospheric pollutants in the city of Sfax (Tunisia)
(October 1996-June 1997)
C. AZRI
Faculté des Sciences de Sfax, Département des Sciences de la Terre,
BP 802, 3018 Sfax, Tunisie
Corresponding author e-mail: chafai_azri@yahoo.fr
A. MAALEJ
Faculté des Sciences de Sfax, Département de Physique,
BP 802, 3018 Sfax, Tunisie
K. MEDHIOUB
Institut Préparatoire aux Etudes d'Ingénieurs de Sfax (IPEIS),
BP 805, 3018 Sfax, Tunisie
R. ROSSET
Laboratoire d'Aérologie UMR CNRS/UPS 5560, 14 Av. Ed Belin,
31400 Toulouse, France
Received June 7, 2006; accepted October 25, 2006
RESUMEN
El estudio descriptivo con relación a la evolución de las concentraciones de los compuestos O3, NO, NO2, CO, SO2, CH4, NMHC y de los PM10 en la ciudad de Sfax señaló, durante el período de octubre 1996 hasta junio 1997, que la ciudad está fuertemente influenciada por varias fuentes y factores meteorológicos. Las concentraciones diurnas medias de dichas especies mostraron algunas particularidades debidas a las costumbres locales de los habitantes y también a las particulares condiciones meteorológicas asociadas a las fuertes situaciones ciclónicas (bajas segregadas). Con base en NO y CH4, dos especies seleccionadas como trazadores local y sinóptico de la contaminación respectivamente, este estudio descriptivo refinado con un análisis de componentes principales mostró, aparte de estas situaciones particulares, tres componentes de la contaminación atmosférica: un primer componente formado por CH4 y en menor grado NMHC mostrando el impacto de las fuentes sinópticas, un segundo componente conteniendo NO, NO2, CO, SO2, y en menor grado PM10 y NMHC exponiendo el impacto de las fuentes locales (fuentes móviles e industriales) y finalmente un tercer componente formado por O3 y en menor grado PM10 desplegando el impacto de las fuentes locales (industriales y vehiculares). Bajo las situaciones ciclónicas citadas anteriormente, la distribución de dichos componentes ha sido modificada notablemente.
ABSTRACT
The descriptive study related to the evolution of O3, NO, NO2, CO, SO2, CH4, NMHC and PM10 concentrations in downtown Sfax showed, during the period October 1996-June 1997, that the city is significantly influenced by many sources and meteorological factors. The diurnal average concentrations of these species let appear at times some peculiarities due to the population local customs and also to particular meteorological conditions associated with predominant strong cyclonic situations (cut-off lows). Based on NO and CH4, two species selected respectively as local and synoptic tracers, this descriptive study which is refined by a principal component analysis showed, out from these particular meteorological conditions, three components of the atmospheric pollution: a first component formed by CH4 and in less degree NMHC showing the impact of synoptic sources, a second component containing NO, NO2, CO, SO2 and in less degree PM10 and NMHC displaying the impact of local sources (vehicle and industrial sources), and finally a third component constituted by O3 and in less degree PM10 presenting the impact of regional sources. Under the above quoted cyclonic situations, the distribution of such components was shown considerably modified.
Key words: Sfax, atmospheric pollutants, traffic and industrial sources, particular meteorological conditions, PCA .
1. Introduction
The population growth and the development of industrial, agricultural and transport activities generally result in a change of the air chemical composition (Mégie, 1994). Those activities are responsible for the undesirable growth in the atmosphere of certain gas traces such as sulfur oxides (SOX), nitrogen oxides (NOX), carbon oxides (COX), volatile organic compounds (VOC) and dusts, which affect the human health and the vegetation. Their impact on the environment was shown to be a function of emissions conditions (flux, distribution of sources, etc.), exposition time (short term or long term) and meteorological conditions (atmospheric stability, winds, inversions, anticyclones, etc.). These pollutants present in the atmosphere are usually subject to the processes of accumulation, disappearance and transformation depending on meteorological conditions (sunshine, wind, temperature, air humidity, atmospheric stability, precipitations, etc.). They can also result in secondary pollutants more harmful for the environment, such as ozone (O3) and secondary aerosols with an acid character.
Studies conducted by Palumbo and Iannibelli (1984), Buat-Menard and Robert (1987), Gomes at al. (1988) and Artaxo et al. (1989) showed that the expansion of atmospheric pollutants within urban cities affect the different reservoirs of the globe (hydrosphere, lithosphere and biosphere) and their transboundary movement far from the original pollution sources. Numerous examples are available in the literature, such as the case of lead deposited in the large icecap of Groenland (Bruton et al., 1993) and the case of "red" precipitations in Europe containing fine sand which comes from the North Africa desert (Gerzoni et al., 1998).
Conscious of the problem, Tunisia started since the last decade a program of installation of surveillance and monitoring networks of the air quality within its large cities. In the urban center of Sfax (34°43' N and 10°46' E), such a station has been implemented since June 1996, at a busy traffic cross-roads with peak values of 2000 vehicles/hour. On a regular basis this station gives, for each hour, the concentrations of ozone (O3), nitrogen oxides (NOX), sulfur dioxide (SO2), carbon monoxide (CO), methane (CH4), non methane hydrocarbons (NMHC) and particles with diameter below 10 mm (PM10). The objective of this study is to examine the evolution of atmospheric pollutants in the city of Sfax using data sources and meteorological factors. Data were measured during the period October 1996 to June 1997 (except for April, rejected for incomplete data). More specifically, emphasis is put upon hourly average concentrations for every month during this period.
2. Material and methods
The evolution of O3, NOX, SO2, CO, CH4, NMHC and PM10 particles were traced by an air quality control station located at a busy traffic cross-roads, in the urban center of Sfax. The station includes instruments that identify and measure the concentrations of the aforementioned pollutants. The station also includes meteorological sensors to determine principal meteorological parameters, such as wind speed and its direction, air temperature, atmospheric pressure, relative humidity and solar radiation. In this station, the ozone is detected by photometry (UV), nitrogen oxides are analyzed by chemiluminescence, carbon monoxide is analyzed by infra-red absorption, and finally methane and non methane hydrocarbons are detected by gas chromatography-flame ionization detection. The PM10 particles were detected (by weight) by a TEOM 1400 sensor.
Measurements of the concentrations for all pollutants, as well as meteorological parameters, are performed. All measurements and analysis equipment are subject to periodic calibration. Gas analyzers and meteorological detectors are connected to a computer, which ensures data acquisition and storage. The computing station is equipped with a modem, to perform the operation of control of analyzers and ensure data acquisition in real time.
3. Climatic characteristics of Sfax
The region of Sfax is located in the south east of Tunisia on the Mediterranean Sea. Its latitude is 34°43'N and the longitude 10°46'E. Its area is 7,086 km2, characterized by an original semi-arid Mediterranean climate largely influenced by (i) its mild and gentle topography and (ii) its maritime exposure. The region is well ventilated with low to moderate wind velocities rarely exceeding 5 ms-1 (DGAT, 1995). The region, which is subjected to opposite influences of continental and maritime air masses is characterized by hot dry summers and relatively cold wet winters. Average winter and summer temperatures are 12.3 and 24.9 °C, respectively. The hot season extends over a period of five months from May (average temperature = 24.2 °C) to September (average temperature = 29.4 °C). The region receives little rainfall (an average of 217 mm per year), characterized by an accentuated seasonal and annual variability.
4. Industrial and traffic activities
Sfax is among the most urbanized and industrialized Tunisian cities. It has a population of 733,687 inhabitants, of which properly 53 % live in the City. Different studies about the main industries of Sfax city, such as the phosphate treatment factory SIAPE, the lead secondary melting industry and the soap industry, showed high emission rates of sulfur oxides (SOX) and dust, exceeding Tunisian standards (JICA, 1993; Azri et al., 2002). Through the chimneys of the phosphate treatment factory, average flow rates of 4.5 and 4.55 tons per day of dust (enriched by sulphate and phosphorous compounds) and SOX (expressed in equivalent SO2) were measured, respectively. These flow rates exceed 8 and 20 times respectively emission standards. Dust discharge rates out of the lead secondary melting industry were found to be around 1.75 tons per day, which represent more than 160 times the acceptable standards. Dust discharge rates out of the soap industry were found to be around 5.2 tons per day. They exceed 10 times emission standards. Compared to SOX and dust, emission rates of nitrogen oxides (NOX) from the aforementioned industries are relatively low and are within emission standards. The highest production of NOX (0.22 tons per day, in equivalent NO2) was registered downstream of the chimneys of the soap factory.
Urban extension and its associated industrial development on one hand, and population growth on the other, resulted in the development of highway infrastructure to accommodate ever increasing traffic. An analysis of highway circulation, performed in 1997 at different locations of downtown Sfax, showed an average daily variation of traffic rates for the different areas of the City (Table I).

5. Results and discussion
In downtown Sfax, the diurnal evolution of NO, NO2, O3, CH4, NMHC, CO, SO2 and PM10, during the period October 1996-June 1997, was examined based on the variation of pollutant concentrations using data sources and meteorological factors.
5.1 Diurnal evolution of nitrogen oxides (NOx)
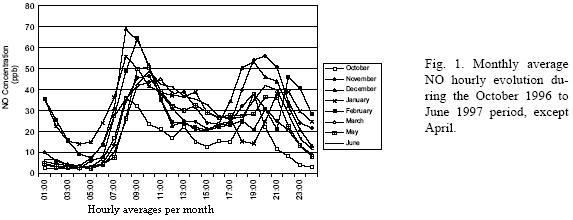
In Figure 1, nitrogen monoxide (NO) most generally displays two maxima corresponding to traffic-peak hours, in the morning between 08:00 and 10:00 LT (local time), and in the afternoon between 18:00 and 21:00 LT. Such hourly average evolutions directly reflect the traffic intensity in downtown Sfax within the main pollution emission source. Nevertheless, the months of January and February (Fig. 1) depart from this regular sequence. One then observes the disappearance of evening peaks and the appearance instead of nocturnal peaks between 22:00 and 01:00 LT. This is associated with the Ramadan Month (then between January 10 and February 9, 1997), during which road traffic is most intense at night (after fast breaking) rather than in the evening. This is directly reflected (Fig. 1) in NO average hourly measurements during the nocturnal period. Such a situation was also observed elsewhere, for instance in Algiers (Kerbachi et al., 1998) and in Tunis (Chalghoum and Hamrouni, 2006).
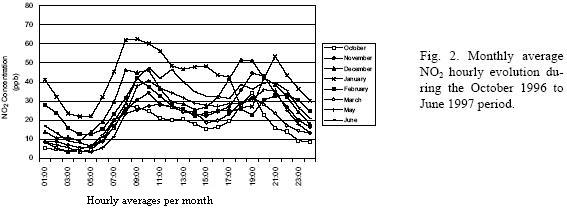
Nitrogen dioxide (NO2) displays (Fig. 2) a similar diurnal evolution, which confirms its road traffic origin. According to Alary et al. (1994), atmospheric nitrogen dioxide (NO2) in cities, not directly emitted by local anthropic sources, is mainly formed by photochemical reactions as a secondary pollutant. In downtown Sfax, its formation close to the NO traffic sources is expressed by the reaction NO + O3  NO2 + O2. This is confirmed by low diurnal NMHC/NOx ratios (below 10 ppbC/ppb), which is indicative of a limitation in the ozone photochemical production process (Goddeville and Guillermo, 1990; Académie des Sciences, 1993). However, one cannot exclude NO2 formation by photochemical reactions. Indeed, fluctuations in the NO/NO2 ratio, which let appear an increase in NO2 contents during the hottest months (Table II), emphasize the impact of meteorological conditions upon photochemical processes.
5.2 Diurnal evolution of ozone (O3 )
As for diurnal ozone, there is a relative reduction in concentrations during the morning and at the end of the afternoon, corresponding to traffic-peak hours (about 09:00 and 19:00 LT) (Fig. 3). This decrease in ozone concentrations clearly correlates with an increase in nitrogen oxides NOX (Figs. 1 and 2). During traffic peak hours, low NMHC/NOx ratios (below 10) are indicative of a limitation in the ozone photochemical production process. Strong NO emissions enhance ozone buffering due to the oxidation reaction of NO into NO2. Even at the times of maximal temperatures (12:00 to 14:00 LT), these ratios remain under 10, thus testifying the predominance of ozone buffering upon photochemical processes. The distribution of ozone concentrations shows a linear trend with small diurnal/nocturnal modulations. It is different from the standard which, in the case of undisturbed meteorological situations (clear sky and low wind velocities), shows a monotonous curve with a maximum in the evening and a minimum early in the morning. Real situations do not follow this type of theoretical curve, with the effect of:
(i) The high wind speeds exceeding 10 ms-1, which contribute to mix the atmosphere and prevent the formation of low amplitude night inversions (Toupance, 1988). They trend to attenuate the daily variation of ozone concentrations to yield slightly diurnal/nocturnal modulated profiles. Therefore, the profiles of ozone will be characterized by a maximum concentration neighboring of the regional mean one;
(ii) The ocurrence of peaks that can correspond to the very local effects as the proximity of precursors (Papais et al., 1998);
(iii) The sites that are situated on hills or mountains, can also affect the ozone diurnal profile regime.
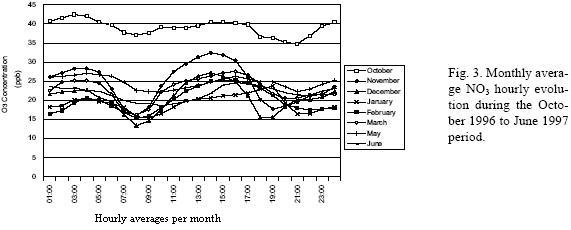
Owing to the absence of topography and high wind velocities at Sfax region, daily concentrations of ozone appear to be practically constant. They may be explained by the particular meteorological conditions of this coastal region. The absence of calmness and wind velocities varying between 1.5 and 5.0 ms-1 during the study period show a well ventilated zone. The daily ozone regime, being slightly modulated, is probably influenced by this significant natural ventilation.
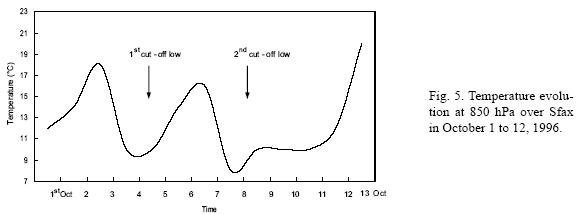
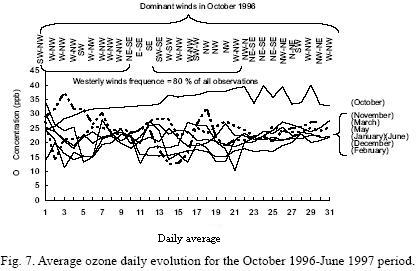
From October 1996 to June 1997, mean ozone concentrations were about 25 ppb during all months, except for October 1996 when these concentrations reached values as high as 40 ppb (Fig. 3). Such an increase in ozone levels during this episode is associated with the particular meteorological conditions linked with predominant strong cyclonic situations during the first half of this month. Analyses of the synoptic maps (Fig. 4) revealed that since October 1, 1996, Tunisia was under the influence of a surface depression centered over Italy. This depression was associated with disruptions of the Mediterranean front separating European cold air masses from Saharan hot air ones. At 500 hPa, this situation, associated with a low pressure zone over Europe, was characterized by strong winds. Between October 2 and 5, 1996, the surface depression evolved slowly moving towards the west and northern Tunisia. In altitude, the zone of low pressure also moved towards Tunisia. On October 5, one observed a clear superposition between the zone of low geopotentials in altitude and the surface depression. On October 6, a new surface depression centered over France affected Sicily. On October 7, the meteorological situation can be described as the vertical superposition over the central Mediterranean Sea of the surface depression and low geopotentials aloft. On October 8 and 9, the surface depression and the low geopotential area, under the dominance of westerly and north-westerly winds, moved to the east. Then from October 10, the depression moved towards the east and Tunisia returned to stable weather. This meteorological situation displayed over west and central Mediterranean (over Italy and Tunisia), a succession of two cut-off lows: the first one from October 1 to 5, then afterwards the second one before its evacuation at approximately October 10.
Over the Sfax region, the evolution of the temperature at 850 hPa clearly lets appear these cut-off lows on October 4, 5 and 8 (Figs. 5 and 6). At the surface, this particular period was characterized by a very cloudy sky and very low ambient air temperatures (a decrease of 4 to 6°C for maximum registered temperatures at 14:00 LT). These two succeeding cut-off lows over Tunisia possibly favor deep ozone subsidence from the upper layers. It is to be noted that the relatively long duration of this episode (about 15 days) was able to significantly affect average ozone concentrations over the Sfax region during the whole month of October 1996 (Fig. 7). In addition, this period was characterized by lower NOX and CH4 concentrations.
5.3 Diurnal evolutions of hydrocarbons (CH4 and NMHC) and carbon monoxide (CO)
Methane (CH4), a long-lived tracer, appears nearly constant in Figure 8, with no clear diurnal modulation, thus giving typical background concentrations for Sfax. In October 1996, a peculiarity is observed considering the decrease of CH4 contents at Sfax City between 01:00 and 15:00 LT. It is associated with the above quoted cyclonic situations during the first half of October.
Similarly to CH4, NMHC in Figure 9 appear nearly constant, with no clear diurnal modulation, thus giving typical background concentrations at Sfax. Their monthly evolution shows a remarkable increase in concentration in winter (January). Such a maximum is also observed elsewhere in the Northern Hemisphere (Académie des Sciences, 1993).
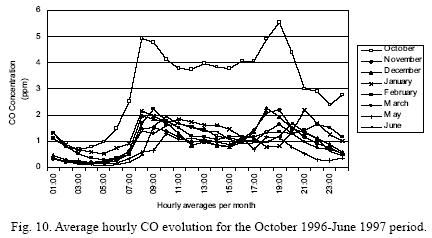
Carbon monoxide (CO) in Figure 10 shows a similar evolution to nitrogen monoxide (NO), with maximal values during peak traffic hours. Furthermore, the same particular situation as for NO appears during the Ramadan Month, with nocturnal CO peaks due to intense road traffic after 20:00 LT. As for ozone in Figure 3, carbon monoxide displays large concentration levels in October 1996, possibly in relation with the two cut-off lows previously quoted. In this month, the increase of CO is not associated with an increase of NO concentrations, their diurnal amplitudes being similar to those during the other months (Figs. 1 and 10).
5.4 Diurnal evolution of sulfur dioxide (SO2 )
Diurnal SO2 evolution, in Figure 11, is complex due to various local emission sources within urban Sfax. In addition to road traffic (fuel) emissions, there are strong industrial SO2 emitters. Most importantly, the phosphate factory SIAPE emits exhaust gases with strong SOX concentrations (Fig. 12), largely exceeding the Tunisian standards. In this latter figure, both high and low SOX emission cases are largely over the standard reference for Tunisian industries. According to Azri et al. (2000), calculation of the emission fluxes of sulfur oxides (SOX) by the main factories in Sfax (soap factory, textile factories, secondary melting lead factories and the phosphate factory SIAPE) lets appear that the chemical reactor of SIAPE is the major SOX emitting source. On average, it emits 4.5 tons/day of SOX (in equivalent SO2), a value equivalent to an emission factor of 25 kg of SOX /tons of phosphates.
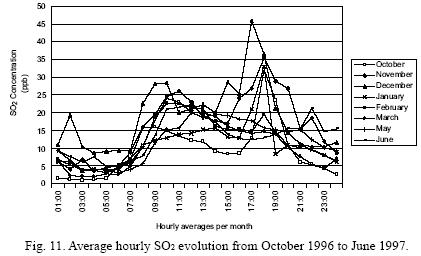
Another potential source for SOX could also be found in the oxidation of biogenic DMS (Suhre et al., 1995) emitted by the sea, even though this contribution could presumably be here less important. Though displaying a diurnal evolution like that of NO, SO2 evolution has some distinctive peculiarities with stronger peaks between October 1996 and January 1997, especially in the evening at about 18:00 LT. This can be tentatively interpreted as due to meteorological conditions favoring local SO2 accumulation during that period. Figure 13 shows that from October 1996 to February 1997 high pressures were predominant over Sfax, likely associated with stable conditions trapping SO2 near the surface. At the beginning of 1997 (Fig. 13), surface pressure at Sfax decreased, thus releasing the buffering hypothesis and reducing SO2 concentrations in the boundary layer. Another meteorological factor, in favor of high SO2 concentrations from October 1996 to January 1997 period in downtown Sfax, can be found in the highest frequencies of southwesterly winds, respectively, occurring in November and December 1996 for 12 and 25% of all observations. Such wind can transport SOX emitted at SIAPE to the central station in Sfax.

The PM10 diurnal cycle always displays large modulations, except in June (see the insert in Fig. 14). During this latter month, the PM10 concentrations are nearly constant at low levels (only about 47 μg/m3) and surface pressure reaches its lowest values in Sfax (Fig. 13), with possibly convective conditions prevailing in thick mixed layers (cf. the same insert for June in Figure 14). Moreover, winds are predominantly from the east in June 1997 (more than 75 % of all observations during this month), thus blowing from the sea with reduced particle loading.
5.6 Statistical analysis of data
Results of the descriptive study presented above were refined by a principal component analysis (PCA) applied to hourly averages per month for selected chemical species. The projection of individuals (related to measurement time) in the 1x 2 factorial plane (representing the maximum of inertia) shows two distinct groups of data (Fig. 15). Group d is composed of the majority of individuals (87.5 %), while group G2 is essentially dominated by the individuals of the month of October 1996. It is characterized by a strong weight on the positive part of axis 2. Each group is in fact, composed of two sub-groups of individuals representing daily hours on one hand and nocturnal hours on the other.
The projection of variables (chemical species) related to group G1 in the 1 x 2 factorial plane shows three principal groups (Fig. 16):
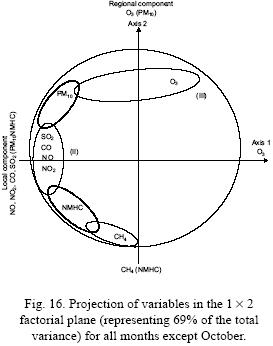
• A first group (I), negatively displayed over axis 2, is presented essentially of CH4, which is a distant natural component (synoptic tracer). It presents a certain affinity with NMHC of the same origin with averagely significant correlation coefficients;
• A second group (II), negatively displayed over axis 1, is articulated around NO, NO2, CO and SO2 and to a less degree PM10 and NMHC. These elements associated with NO (local tracer of pollution) present between each other, highly to averagely significant positive correlation coefficients. This group explains the non negligible contribution of the local anthropogenic sources. The marked anti-correlation between NO, NO2 and O3 [r(NO, O3) = - 0.53 and r(NO2, O3) = - 0.54, and the threshold of significance = 0.20 for p < 0.05 and n = 168] implies the predominance of ozone buffering upon photochemical processes.
• A third group (III), characterized by its strong weight over the positive part of axis 2, includes O3 and to a less degree PM10. The strong weight of this group, over the inertia axis 2, results in giving its pole the regional component.
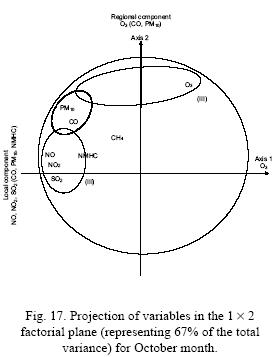
The distribution of chemical species within group of individuals G2 presented in Figure 17 (representative of the month of October 1996) is different from that observed in group of individuals G1. In fact, this distribution in the 1 x 2 factorial plane (representing the maximum of inertia) is characterized by the particular behavior of CH4, supposed to be a distant natural component (synoptic tracer), and that of CO which was shown a local pollutant. It is to note that these two species (CH4 and CO) are only positively correlated in October 1996 [r(CH4, CO) = 0.59, the threshold of significance = 0.20 for p < 0.05 and n = 24)].
6. Conclusions
In the urban center of Sfax during the period of study (October 1996 to June 1997, except April), the descriptive study related to the survey of ozone (O3) and its precursors, sulfur dioxide (SO2) and particles (PM10) shows that the air quality is significantly degraded, with concentrations somewhat below Tunisian standards. In this study, the road traffic is the main source of NOX emitted to the atmosphere. The results obtained during particular periods such as the Ramadan month, display specific evolutions directly related to road traffic intensities.
Meteorological conditions play a prominent role in the distribution of pollutants, notably for SO2. Enhancement of SO2 peaks during December and November resulted from the localized SIAPE contribution, in connection with dominant south-westerly winds. In urban Sfax, ozone buffering is a dominant process affecting ozone chemistry, with concentrations of about 25 ppb during most months. In October, the ozone concentrations are relatively higher, reaching 40 ppb. They are associated with the strong cyclonic situations during the first half of this month. Under all examined meteorological situations, despite the difference between the ozone levels, the daily distribution of concentrations at the surface remained almost the same. The daily ozone regime, being slightly modulated, is probably influenced by the significant natural ventilation of the region.
This descriptive study refined by statistical analysis showed, out from the strong cyclonic situations of October 1996, three main components of air pollution in Sfax City:
• A component of a natural dominance, with a relatively distant origin that concerns CH4 and to a less degree NMHC.
• A component of a local dominance which concerns the elements NO, NO2, CO, SO2 and to a less degree PM10 and NMHC.
• A component of a regional dominance especially including O3 and to a less degree PM10.
The distribution of these components was shown to be disturbed in October 1996, with a particular behavior of CH4 and CO in association with marked concentrations of O3 associated with the two cut-off lows.
The following steps are recommended for further research:
• Adequate treatment of the industrial atmospheric emissions, especially of SIAPE factory;
• Reinforcement of the network for the control of air quality in the region by installing other measurement stations, especially in the suburbs, to trace the evolution of pollutants and in particular of ozone;
• Extended monitoring (over many years) of air quality is also required to ensure a better understanding of the physico-chemical processes in Sfax atmosphere.
References
Académie des Sciences, 1993. Ozone et propriétés oxydantes de la troposphère. Techniques et documentation, Rapport No. 30, Lavoisier, 251 pp. [ Links ]
Alary R., J. Donaty and A. Viellard, 1994. La pollution automobile a Paris, influence du trafic routier et des conditions météorologiques. Pollution Atmosphérique 141, 55-65. [ Links ]
Artaxo P., W. Menhaut and H. Storms, 1989. Large scale trace element concentration in aerosols over the Amazon basin in the wet saison. J. Geophys. Res. Special issue on GTE/ALBE-2B. [ Links ]
Azri C., A. Maalej and K. Medhioub, 2000. Etude de la variabilité des constituants de l'aérosol dans la ville de Sfax (Tunisie). Pollution atmosphérique 165, 121-129. [ Links ]
Azri C., A. Tlili, M.M Serbaji and K. Medhioub, 2002. Etude des résidus de combustion des fuels liquide et solide et de traitement chimique du phosphate brut dans la ville de Sfax (Tunisie). Pollution Atmosphérique 174, 297-308. [ Links ]
Buat-Menard P. and A. D. Robert, 1987. Metal transfer across the air-sea interface: Myths and mysteries. John Wiley, 147-170. [ Links ]
Chalghoum Z. and H. Hamrouni, 2006. Etude de l'environnement de la ville de Tunis. Mémoire de projet de fin d'études. Faculté des Sciences de Sfax, 37 pp. [ Links ]
Direction Générale de l'Aménagement du Territoire, DGAT, 1995. Atlas du gouvernorat de Sfax. [ Links ]
Guerzoni H. and E. Molinaroli, 1998. Les poussières sahariennes: des poussières du Sahara traversent la Méditerranée et retombent sur l'Europe, notamment sous forme de "pluies rouges". Pour la Science 247, 72-83. [ Links ]
Goddeville P. and R. Guillermo, 1990. Pollution photooxydante et modélisation Lagrangienne: campagne de mesures dans le Nord-Pas-De-Calais, Pollution Atmosphérique 127, 279-291. [ Links ]
Gomes L., G. Bergametti and B. Chatener, 1988. An estimate of the dry deposition of trace elements onto the coastal margin of the Mediterranean Sea from the FOS/Mer industrial Area. Environ. Technol. Letters 9, 1295-1302. [ Links ]
JICA, 1993. The study on waste water treatment and recycling of selected industries in the region of Sfax in the republic of Tunisia. Japan International Cooperation Agency, Japan. [ Links ]
Kerbachi R., M. Boughedaoui, N. Koutai and T. Lakki, 1998. La pollution par les oxydes d'azote et de l'ozone à Alger. Pollution Atmosphérique 158, 89-101. [ Links ]
Mégie G., 1994. Ozone et propriétés oxydantes de la troposphère. TSM, 10, 572-574. [ Links ]
Municipalité de Sfax, 1998. Etude de la circulation dans la ville de Sfax. Rapport de Phase 1, inventaire et analyse de la situation existante, version definitive (avril 1998), 59 pp. [ Links ]
Palumbo A. and M. Iannibelli, 1984. Atmospheric contribution to marine pollution in the Bay of Naples. VIIàmes journées ETD. Pollutions, Lucerne C.I.E.S.M., 63-71. [ Links ]
Papais S., J. Fontan, A. Lasserre-Biggory and V. Pont, 1998. Analyse de la pollution photochimique en France pendant l'année 1996. Pollution Atmosphérique 159, 82-93. [ Links ]
Seinfeld J. H. and S. N. Pandis, 1998. Atmospheric chemistry and physics: from air pollution to climate change, John Wiley, New York. [ Links ]
Suhre K., M. O. Andreae and R. Rosset, 1995. Biogenic sulfur emissions and aerosols over the tropical South Atlantic, 2, one-dimensional simulation of sulfur chemistry in the marine boundary layer. J. Geophys. Res. 100, 11323-11334. [ Links ]
Toupance G., 1988. L'ozone dans la basse troposphère. Théorie et pratique. Pollution Atmosphérique 117, 32-42. [ Links ]

