


Services on Demand
Journal

Article
 English (pdf)
 Article in xml format
 Article references
 Send this article by e-mail
Indicators
 Cited by SciELO
 Related links
-
 Similars in
SciELO
Similars in
SciELO
Share

 Permalink
Atmósfera
Print version ISSN 0187-6236
Atmósfera vol.20 n.2 Ciudad de México Apr. 2007
Detection of the urban heat island in Mexicali, B. C., México and its relationship with land use
O. R. GARCÍA–CUETO
Instituto de Ingeniería, Universidad Autónoma de Baja California,
Mexicali, B. C., México
Corresponding author e–mail: rafaelcueto@uabc.mx
E. JÁUREGUI–OSTOS
Centro de Ciencias de la Atmósfera, Universidad Nacional Autónoma de México,
Circuito Exterior, Ciudad Universitaria, México, D. F., 04510 México
D. TOUDERT
Instituto de Investigaciones Sociales, Universidad Autónoma de Baja California,
Mexicali, B. C., México
A. TEJEDA–MARTINEZ
Licenciatura en Ciencias Atmosféricas, Universidad Veracruzana, Xalapa, Veracruz, México
Received January 13, 2006; accepted May 29, 2006
RESUMEN
En este trabajo se analizan las islas de calor urbana, tanto atmosférica como superficial, y su relación con los usos del suelo, mediante mediciones in situ de temperatura del aire, y el uso de imágenes térmicas de satélite NOAA AVHRR y Landsat, en la ciudad de Mexicali, B. C., México. Los resultados muestran el desarrollo de una isla de calor urbana nocturna, con una intensidad máxima promedio de 4.5 °C en el otoño, pero durante el día, en cualquier época del año, esta situación se invierte, dando lugar a una isla urbana fría. Se estableció la existencia de una isla de calor urbana superficial al comparar la ciudad con los alrededores cercanos. En el interior de la ciudad se manifiestan contrastes térmicos importantes que se pueden visualizar, cual mapa topográfico, en diferentes configuraciones, y éstas a su vez se pueden relacionar con los usos urbanos del suelo. La discusión se orienta al enlace que existe entre la temperatura del aire en la capa del dosel urbano, la temperatura de superficie del suelo y el balance energético de la baja atmósfera.
ABSTRACT
In this paper the urban heat islands (UHI), both atmospheric and surface, and their relationship with the land use in the city of Mexicali, Baja California, México, were examined by means of direct in situ measurements of air temperature, and the use of NOAA's AVHRR and Ladsat thermal satellite images. The results show the development of a nocturnal urban heat island, whose highest mean value was recorded in autumn (4.5 °C), however during the day–time, in any season of the year, this situation is reversed and the city becomes a cold urban island. The existence of a surface urban heat island (SUHI) could be proved when the city was compared with nearby surroundings. Within the city, important thermal contrasts can be seen as a topographic map, and then can be related to different urban land use. The discussion is focused to the relationship that exists between the canopy air temperature, the surface temperature, and the atmospheric energy balance near the ground.
Keywords: Urban heat island, NOAA AVHRR thermal images, Landsat thermal images, land use, atmospheric energy balance.
1. Introduction
The urban heat island (UHI), defined as the thermal difference between the urban area and its surroundings, is the clearest expression of anthropogenic activity impact of climate at local level. It emerges as a result of two different but associated processes; the first, and more important, is the alteration of the land cover since urbanization eliminates the natural ground, which is replaced by non–evaporating and non porous materials such as asphalt and concrete. This alteration will inevitably result in the modification of the surface atmospheric energy balance. The second process refers to the activities that take place in the cities, mainly in transport and industry, because they generate waste energy that contributes to urban heating. Nowadays, this topic has become important due to the rising trend of the population in cities, and because the UHI has important implications for human comfort and health, urban air pollution, energy management, and urban planning.
The UHI has been one of the most studied, and maybe the best–known phenomenon of urban climate, ever since Luke Howard mentioned this fact in the urban area of London in 1833. A century and a half later, Oke (1982) suggested two main hypothetical causes for the existence of the UHI: surface controls and atmospheric controls. The primary surface controls are surface geometry, like the sky view factor, and surface thermal properties, especially thermal admittance, whereas the primary atmospheric controls are wind and clouds. The strongest UHI are observed when the skies are clear and the winds are calm. Other causes suggested are anthropogenic heat and urban greenhouse effect (Oke et al., 1991).
Generally speaking, two types of UHI according to the methods of temperature measurement can be distinguished: (i) the canopy layer heat island, and (ii) the boundary layer heat island (Voogt, 2002). The former consists of air between the roughness elements (buildings and tree canopies), with an upper boundary just below roof level. The latter is situated above the former, with a lower boundary subject to the influence of the urban surface (Weng, 2003). The UHI in the canopy layer are typically detected by in situ sensors measured at a standard meteorological shelter in a height of 1.50 meters above roof level, as the studies by Jáuregui (1997) and Klysik and Fortuniak (1999) show. The temporal thermal variations can be estimated with this method, but the spatial distribution of the heat islands cannot be known with the methodology described. To solve this problem, air temperature is measured using car traverses through urban areas (Jáuregui, 1975; Jáuregui, 1979; Cervantes et al., 2000; Alonso et al., 2003; Fernández et al., 2005), or also a meteorological urban network of observation is used (Balling and Brazel, 1986a; Barradas, 1987; Tejeda and Acevedo, 1990; Jáuregui, 1993); but even so, due to poor spatial resolution, interpolations based on topography and land use need to be carried out.
In contrast to the direct in situ measurement made of the atmospheric heat islands, the remotely sensed surface urban heat islands (SUHI) (Vogt and Oke, 2003), require information about the overlying atmosphere and the surface radiative properties. The UHI detected in this way have a higher spatial distribution, but a low temporal resolution and a shorter record of data. Studies on the UHI phenomenon with remote sensing data have been conducted primarily using satellite thermal images from National Oceanic Atmospheric Administration's Advanced Very High Resolution Radiometer (NOAA's AVHRR) (Balling and Brazel, 1988; Gallo et al., 1993), TERRA/ MODIS (TM) (Ochi et al., 2003), Landsat (Carnahan and Larson, 1990; Toudert et al., 1996), or infrared thermal images from airplane flights at low altitudes (Lo et al., 1997; López et al., 1998; Weng, 2001). Particularly, the images from NOAA's AVHRR, due to their low spatial resolution (1.1 km at the nadir), can only analyze the thermal distribution at a not very adequate scale for studies in the urban area, but they are able to distinguish regional thermal contrasts for different land cover. The spatial resolution provided by the infrared thermal channel of Landsat, 120 m of TM and 60 m of ETM+, gives clearer information about the thermal variation compared with the images from NOAA's AVHRR; therefore, it seems to be more adequate for studies in the urban area.
This study examines in the canopy layer of the city of Mexicali, Baja California, México, the atmospheric urban heat island through air temperature analysis of the meteorological urban network, and the surface urban heat island, by means of the analysis of satellite thermal images from the NOAA's AVHRR, and from the satellite Landsat ETM+. As the two methods of analysis have different spatial and temporal resolution, they has allowed us to get a clearer picture of the role that the land cover/land uses have in both, regional and intra–urban, thermal behavior.
2. Area of study
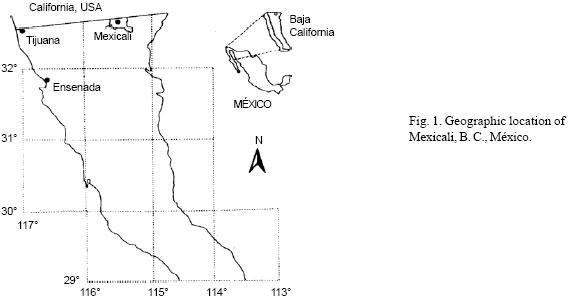
Mexicali city is in the northeastern part of the State of Baja California, México (32°33' N, 115°28' W, and altitude 4 m, Fig. 1). It has a dry, arid climate with winter rainfall and wide annual oscillation of mean temperatures [BW (h')hs(x'), according to García's classification, 1982]. Mexicali has just become one hundred years old. In its origins, the population was dedicated to agricultural activities, but these have been changing gradually to commercial and industrial activities. Its geographical location, bordering with one of the most dynamic economies of the world (the state of California, USA), has allowed it to grow at a higher rate than the national average, and in spite of its rude climate, it has had a marked increase in population (Table I). Thus, the land cover and the land use have changed in a relatively short term, to the extent that urban growth has gobbled up the agricultural rural limits of its surroundings; these surface alterations in turn have caused variations in the thermal characteristics, as will be shown later. Therefore, the energy balance in the layer close to the ground, that is, in the atmosphere–surface interface, should also be changed.
3. Data
Maximum and minimum air temperature records from the year 1998 from a network of urban stations in Mexicali city were used in the most representative months of the seasons of the year: January (winter), April (spring), July (summer) and October (autumn). The purpose was to examine the atmospheric urban heat island (UHI) and to studying the dynamics characteristic of the air mass overlying the urban area.
To obtain information on the thermal regional climate, twenty–six composite images with ten–day averages between the years 1992 and 1995 from NOAA's AVHRR were processed; the bands used were number 4 (10.3–11.3 µm) and number 5 (11.5–12.5 µm) from a step in the afternoon (between 21:00 and 22:30 GMT). Radiometric and atmospheric effects in these images were corrected. The size of pixel of these images (1.1 km) seems to be very large for urban studies; therefore the analysis of these images allows only a clearer regional view. In this case, the SUHI was analyzed when the maximum air temperature occurs.
Finally, to have evidence of the intra–urban thermal variation, and since it is related to the land use, the ETM+ thermal image from the satellite Landsat of May 12, 2003 was used. The size of the image's pixel, 60 m, seems adequate for this type of studies, as the works of Schmid and Oke (1992) and Hubble (1993) shown that the microclimatic spatial interaction at a scale lower than 200 m in critical explaining intra–urban thermal variations.
To relate the information described with the land use, maps and aerial photography were used. The maps were from Mexico's Instituto Nacional de Estadística, Geografía e Informática (INEGI) (scale 1:100 000) and an urban base chart (1:25000) from the City Hall of Mexicali, B. C., México. The aerial photographies were obtained from the United States Geological Survey–Geography web site and had a resolution of 4 m/pixel and 2 m/pixel.
4. Methods
4.1. Urban thermometrical network
With the information generated by the network of urban stations from Mexicali, B.C., México, and Calexico, CA., USA, the distribution of extreme temperatures was spatially analyzed (minimum air temperatures and maximum air temperatures) for representative months of the seasons of the year 1998: January (winter), April (spring), July (summer) and October (autumn). The program Surfer 8 was used for the spatial tracing of isotherms with the Krigging interpolator (Anderson, 2002).
4.2. AVHRR images from NOAA
To process AVHRR images, GIS IDRISI V3.2 was used. For estimating surface radiant temperature (SRT), the algorithm proposed by Price (1990) was used (Eq. 1), that has successfully been applied in several studies (e.g., Becker and Li , 1990):
SRT = T4 + R (T4 – T5) (1)
where:
SRT = Surface radiant temperature (of black body),
T4 = Radiant temperature of band 4,
T5 = Radiant temperature of band 5, and
R = 1/[(β5/β4) – 1], (β4 and (β5 are the coefficients of atmospheric absorption of channels 4 and 5.
In Price's (1990) relation, a surface emissivity of 1.0 is supposed. Sur face emissivity differences between urban and rural regions were not available, and thus they were not included in the computation of SRT, though several authors (e.g., Roth et al., 1989; Carlson, 1986) mention that when the emissivity values are not included, the differences range from 1 °C to 1.5 °C. As the interest is in the relative values for effects of comparison, and not in the absolute ones, it thought that this difference was not significant for the purpose of this study.
A classification of the land cover was carried out with the estimated SRT, and several areas of interest were digitized. The following basic statistics of SRT were obtained for each area: minimum values, maximum values, average, range, standard deviation and coefficient of variability. The monthly advance of the SRT was documented with such statistical data, and the most adequate month was chosen for the analysis of the Landsat satellite image in the study of the SUHI in Mexicali, B. C., México.
4.3. Landsat ETM+ image
The ideal conditions for the strongest UHI are clear sky, very weak winds or preferably a calm day with low relative humidity. These conditions appeared on May 12, 2003, date chosen to carry out the analysis of the Landsat image. First, the SRT values from the Landsat ETM+ satellite image were extracted through the above mentioned GIS. Briefly, the digital values of each pixel of the thermal channel were transformed to SRT, in Celsius degrees. This estimated temperature supposes that the surface is radiating as a black body; to have a better estimate of the surface temperature, therefore, we should correct it by introducing emissivity values of the different surfaces present in the covering of the image. However, this process was not carried out since that information was not available. As an alternative, since there were thermometric data from eight meteorological stations, a linear regression analysis was carried out to obtain "real" air temperatures, which is what really matters to know the thermal distribution in the urban canopy layer, and for detecting the atmospheric urban heat islands. Thus, taking the air temperature as a dependent variable and the black body SRT as an independent variable, the equation obtained was applied to estimate the air temperature for each pixel from the image of surface radiant temperature.
With the map of land use, elaborated by Alvarez (1998), the primary uses in the city and outskirts were identified and extracted using an Auto Cad package. The following categories were the most important: a) commercial, b) residential, c) industrial, d) green areas, e) mixed, f) equipment, g) infrastructure, h) agricultural and i) dunes.
To examine the spatial distribution of estimated air temperatures, the image was re–classified into three temperature zones based on the standard deviation as a criterion for classifying temperatures (Smith, 1986). The thermal differences are considered normal if they are ± 1 standard deviation, with regard to the mean value of temperature; they are considered as cold points, that is, cold islands, if the thermal differences are < –1 standard deviation, and warm points, that is, heat islands, if the thermal differences are > +1 standard deviation.
Finally, several graphic profiles (transects) were outlined on the image of estimated air temperatures to examine their intra–urban variation and to relate them with the different land uses. For each transect the criterion of standard deviation already established was utilized.
5. Results and discussion
5.1. Urban thermometrical network
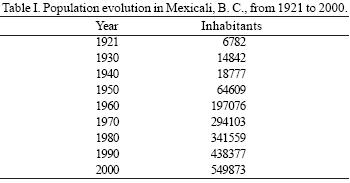
Figures 2 and 3 show the spatial pattern of the minimum air temperatures and maximum air temperatures for the month representing autumn season. The results for the other seasons of the year are not shown because are similar.
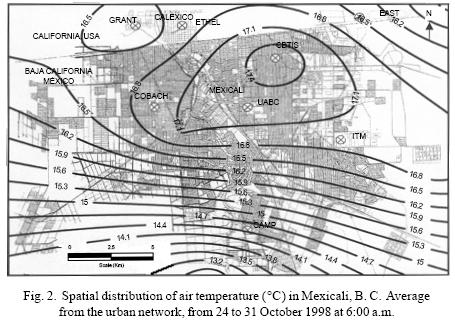
Figures 2 and 3 display a contrasting urban thermal pattern; a very well marked diurnal urban–rural difference is observed. In the first hours around dawn, the city behaves as a heat island, but as the day goes on, this pattern is reversed in such a way that in the first hours of the afternoon, the urban area behaves as a cold island when compared with its surroundings, that is, an "oasis" effect occurs (Oke, 1987). So, the air temperature is a dynamical variable with a daily cycle in Mexicali, B. C.; if the air temperature does not perform anymore than surface energy balance of fundamental amounts, in the form of turbulent exchanges of energy between the surface of the ground (soil heat flux) and the lower atmosphere (sensible heat flux and latent heat flux), the question to be formulated is: what does cause this diurnal behavior in the thermal pattern?. The answer seems to be in the availability of energy in the ground–atmosphere system, and in the way in which the covering of the land cover/land use answer to this availability, that is to say, the cause of the UHI must be related to changes in the surface atmospheric energy balance caused by urbanization.
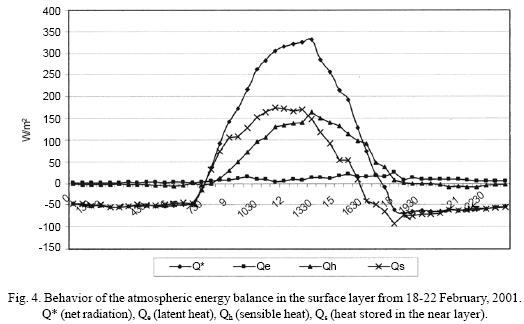
From Figures 2 and 3, it is possible to infer that the city has enough sensible heat to raise the diurnal temperatures. The latent heat flux must be small, since there are not many evapo transpirative surfaces, thus the net radiation distributes mainly in sensible heat flux and heat stored flux in the urban fabric (Fig. 4). In the rural area, most of the net radiation is not stored as soil heat flux, even though it is gained extremely fast due to its low thermal admittance; instead, the energy gained in the ground seems to be transferred rapidly to the heating of the air, that is, as a turbulent sensible heat flux, which causes the air temperature to be higher in the rural area than in the urban one around midday. Results from two campaigns of measurements of the energy balance fluxes in the lower atmosphere corroborate the foregoing comments (García–Cueto et al., 2004).
At night the loss of energy through long wave radiation is greater in the rural surroundings than in the urban area, so that at the end of the nocturnal period, the well–known effect of the UHI occurs. The heat stored during the day in the urban fabric is slowly released during the night (thermal inertia); whereas in the rural area, which is a desert, divergences in the heat flux and a strong surface cooling seem to exist.
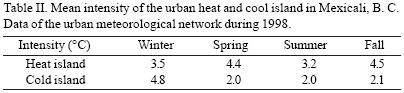
Table II shows the mean intensity of the heat and cold islands in the urban area, according to the seasons of the year, starting from the values of minimum air temperature and maximum air temperature. The highest mean value of the urban heat island in the urban canopy layer occurs in autumn with 4.5 °C, and spring with 4.4 °C. The highest mean value of the urban cold island occurs during winter (4.8 °C), whereas in the rest of the seasons the value is very similar (about 2 °C).
5.2. NOAA AVHRR images
Figure 5 shows a representative example of the surface radiant temperature (SRT) for the ten–day period composed from May 1 to May 10 of the year 1992. In this figure there can be seen distinguishable features associated with different SRT values, depending on the land cover and therefore, with different physical properties, as emissivity and albedo. Fig. 5 shows the urban area stands out due to its highest values of SRT compared with the agricultural areas; however, because of the location of Mexicali city, similar or even higher SRT values were found in the surrounding desert areas.
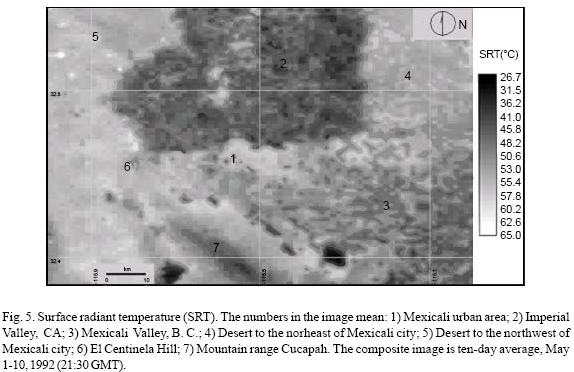
The analysis of the twenty–five remaining images, corresponding to different temporal periods, has allowed to detect the features that already were mentioned in the described example, from what it is possible to conclude in a general way that, with these images (pixel size of 1 km2), it is possible to detect the surface urban heat island; nevertheless, we have also seen that, given the geographical location of Mexicali, warmer regions have been detected in the surrounding desert areas, in particular at the end of spring season, during summer and at the beginning of autumn. The coldest surface radiant temperatures are associated with irrigated agricultural areas, especially in Imperial Valley, California, USA, located just north of the border line with its large agricultural landss and with less intensity, in Mexicali Valley, B. C., México.
On having realized a classification of SRT values in NOAA's AVHRR images, it was possible to distinguish at least four land cover types: agricultural, desert, urban area and mountain range Cucapah. Also, it was possible to differentiate other regional geomorphologic characteristics, such as El Centinela Hill and the evaporation lagoon of Cerro Prieto geothermal plant, which present lower surface temperatures than their surroundings.
The highest thermal contrasts, with values higher than 40 °C, between the urban area of Mexicali and the agricultural valleys, were observed in summer months (July and August); thermal contrasts lower than 20 °C were observed (taking out the months with rain) in October and November; thermal contrasts between 30 and 40 °C were observed in April, May, June and September.
From what has been commented, the lowest SRT are correlated with agricultural areas of Imperial Valley, CA., and Mexicali Valley, B.C. This result does not seem to be out of context if we remember that when there is available moisture in the surface, a great percentage of net radiation is used for evapotranspiration. Measurements of surface atmospheric energy balance undertaken to detect land use changes in Mexicali and its surroundings in the year 2003, showed that in an irrigated site with vegetation, 39% of the net radiation was used as latent heat flux, 41 % as sensible heat flux, and 20% as ground heat flux (García–Cueto et al., 2004), resulting in a lesser amount of energy for warming the air. Consequently, the greater the amount of vegetation, the lower the temperatures (both of the surface and of the air). This factor has already been cited as a significant contributor to the UHI effect (Carlson et al., 1981).
Upon comparing the SRT of the urban area with its surroundings, it was found that Mexicali, just like other cities, for example, Phoenix (Balling and Brazel, 1988) located in arid climates, does not show the classical pattern of a UHI; that is, the higher surface temperatures are not only found toward the urban center, as occurs in humid climates. In this case, the hottest areas are also found in the surrounding desert areas. Again, remembering the partition of energy fluxes that took place in the above mentioned measurement campaigns, it was observed that the main energy sink in the urban area is the sensible heat flux (58% of the total available), while only 5% is being used for evapotranspiration (due to lack of vegetation), therefore, the SRT are higher in the urban area than in the agricultural ones.
5.3. Land use in Mexicali, B. C.
Figure 6 shows the primary land uses in the urban area of Mexicali, B. C.; these will be used for studying its relationship with the results of the thermal analysis, particularly the related ones to the transects carried out through a module of the GIS IDRISI in the thermal image of the ETM+ satellite.
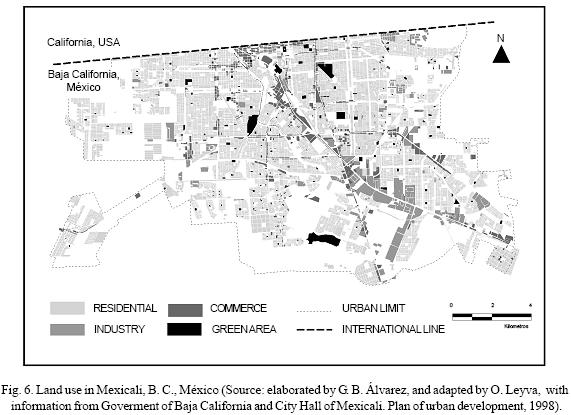
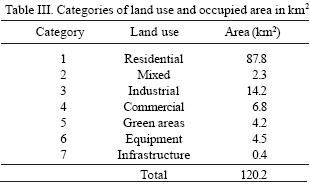
From the original file of land use in the Mexicali's urban area for the year 2003, was chosen seven categories, as shown in Table III, together with their corresponding area in km2. Mexicali city has a surface area of 120.2 km2, corresponding 87.8% to housing, 2.3% to mixed use, 14.2% to industry, 6.8% to commerce, 4.2% to green areas, 4.5% to equipment and 0.4% to infrastructure.
5.4. Landsat ETM+ image
5.4.1. Lineal model of surface radiant temperatures (SRT) and air temperatures (TAIR)
The simple linear model obtained was:
TAIR = 14.6 + 0.44 * SRT (2)
The slope of the equation (2) indicates that for every Celsius degre of increase in the SRT, the estimated increase in the TAIR is 0.44 °C. The statistical tests t and F concluded that the surface radiant temperature influences the air temperature linearly. Likewise, the coefficient of determination (R2), which is a relative measure of the degree of linear association between SRT and TAIR, was 0.87; therefore, the linear presence of SRT in the regression model explained 87% of the total variation in the TAIR estimated. The linear relationship measured by the correlation coefficient was 0.94.
The regression equation found was applied to the image of surface radiant temperature, with which the air temperature was estimated (Fig. 7). The mean temperature over the whole image is 29.3 °C, and its standard spatial deviation, 2.9 °C. In general, the clearest tones, which represent the highest temperatures, are associated with the urban area, vacant land and desert area; whereas the darkest tones, representing the coldest temperatures, are associated with the agricultural land of both valleys (Mexicali and Imperial) and in the urban area to the green areas, being outstanding the forest of the city as one of the most contrasting places of the city, thermally speaking, with regard to the surroundings. The contour indicates the urban area of Mexicali city for the year 2003. In the last 10 years, urban growth has taken place mainly in the south and east directions, being less in the west.
Table IV was constructed to locate the thermal classes according to the standard deviation criterion (Smith, 1986). Based on the thermal classes, defined in Table IV, Table V shows their frequency of occurrence. From Table V, and on the basis of the classification criterion, an estimated 10.8% of the thermal values are cold islands; 88.4% are normal values, and less than 1% are urban heat islands.
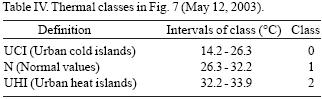
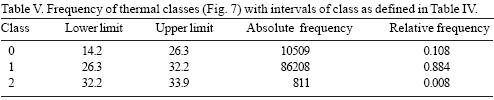
Figure 7 shows that the land uses in the urban area are such that residential, commercial, industrial and infrastructure have relatively high temperatures ranging from 29 to 32 °C; however, vacant land and nearby desert areas also present high temperature values, even higher than in the urban area, ranging from 30 to 34 °C. Some hot points, or UHI, could be identified. The largest heat islands are in the mall, close to the international border, an industrial park in the southeast of the city, and an infrastructure area at the east of the urban area. Seemingly, the residential areas are less effective in promoting the development of the UHI.
5.4.2 Thermal transects in the urban area of Mexicali, B. C., México
To analyze the intra–urban distribution of the air temperature, eight transects were outlined in an attempt to cover the diverse land use in the urban area, and even a bit beyond its limits so as to have a more complete view. These transects appear in the Figure 8.
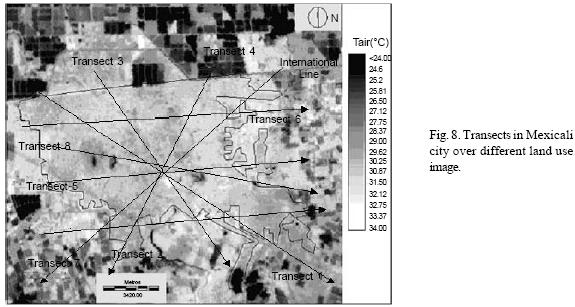
Figure 9 displays a thermal transect profile carried out in Landsat image; there can be seen the different configurations produced by the diverse land use in the urban area.
In the thermal transect presented (Fig. 9) it is possible to observe numerous "ridges", "valleys", "plateaus", "peaks" and "basins", indicating the heterogeneous nature of air temperature over the space. This shows that the surface of the ground, mainly in the urban canopy layer, transfers its thermal properties to the air through the turbulent vertical exchange of sensible heat flux and latent heat flux (assuming that there are no advective effects, that is, without transport of energy or mass in the horizontal).
Table VI shows the summary of some basic statistics of the analyzed transects. For the whole image, the highest value of air temperature was 34.0 °C, the lowest was 14.2 °C, and the mean value was 29.3 °C. It is evident that the mean value of the air temperature varies from one transect to another. Transect 6 has the highest value (30.7°C), and transect 4, the lowest value (30.0 °C). The path of transect 6 makes us think that high density residential use, added to the presence of bare ground, produces this highest value among all the transects; whereas a relatively small green area, like the sports city, influences in a very relative way in its surroundings (even the standard deviation is small, 0.7 °C). With regard to transect 4, in spite of including residential areas of different densities, its lower value may be due to agricultural areas included in both ends of the path, thereby, notably reducing the effects observed in the urban area; the high value of the standard deviation in this transect (1.3 °C) is an indicator of the high thermal contrast between the urban and non–urban areas.
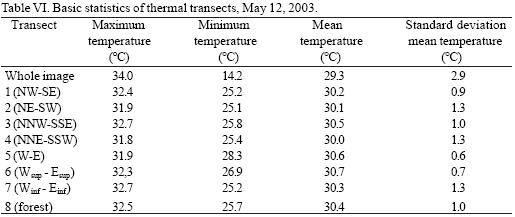
Column 5 of Table VI shows that the value of standard deviation of the air temperature ranges from 0.6 °C (transect 5) to 1.4 °C (transect 7) in the eight transects. These values indicate that, in the case of transect 5, the land use is more homogeneous; in the case of transect 7, upon reaching an agricultural area on both ends of its path, makes it have a greater variability than there should be if only urban areas were involved.
In transect 8, called "forest" because it crosses the most important green area of the urban zone, added with water body, a thermal "basin" was observed, i.e., an important decrease of the temperature; nevertheless, such effect does not seem to spread beyond the radius of the forest cover itself, nor to have important consequences in the complete thermal profile. Regarding this, Gallo et al. (1996) mentioned that the micro–scale influences (100 m of radius), like a garden, were more important in the range of diurnal temperatures than those on the local scale (the size of a park), an effect that seems to occur in this case.
To examine the thermal profile of each transect, a classification of temperature zones based on the scheme of standard deviation was done. Three classes were differentiated based on the mean and standard deviation of the data distribution. Class 1 data with more than one standard deviation below of the mean, are cold islands; class 2 values that fall between the mean and one standard deviation, below or above of the mean, are normal values; and class 3 values with more than one standard deviation above of the mean, are heat islands. The percentage of each classification was estimated and is shown in Table VII. The objective of showing this information is to find out if there is any relationship between the land use more frequently present in the transect and the thermal patterns found.
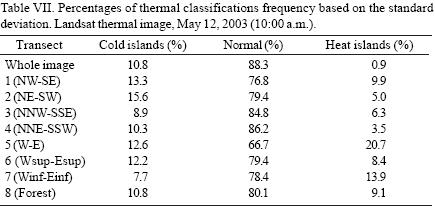
If the whole image is analyzed, we observe, in agreement to Table VII, that 10.8% are cold islands, 88.3% are normal, and 0.9% (about 3 km2 of the whole image) are heat islands. With regard to transects, transect 5 stands out for having the highest percentage of UHI (20.7%), then comes transect 7 with 13.9%, and the one with the lowest percentage of UHI is transect 4, with 3.5%. This indicates that transect 5 is the one with the greatest number of land elements with high thermal absorptivity (higher thermal "firms") and low albedo, whereas transect 4 should have land cover types with a high albedo and low thermal absorptivity (lower thermal "firm"). Regarding cold islands, transect 2 has the highest percentage of them (15.6%), and, if we observe its path, to the end reaches agricultural areas, which explains the high value that was found. Transect 7 has the lowest percentage of cold islands, with 7.7%. These may be associated with the agricultural areas at the end of it. Regarding to normal values, transect 4, with 86.2%, is the highest.
5.4.3. Land use–air temperature
With the Landsat thermal image from year 2003 as reference, several statistics for each land use was estimated, as shown in Table VIII; in addition to those mentioned in this table, agricultural areas (category 8) and dunes (category 9) were added, which were extracted from the Figure 6.
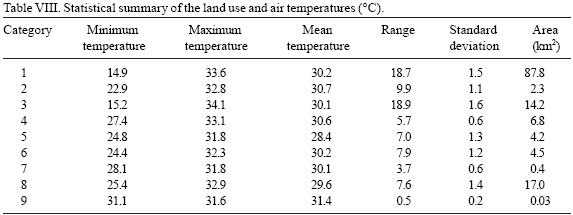
From Table VIII we observe that the highest mean value for air temperature (31.4 °C) corresponds to the dunes, situated toward the east of the city, with a standard deviation of 0.2 °C. If the categories 5 (green), 8 (agricultural), and 9 (dunes) were excluded, the estimated mean air temperature for the remaining categories is 30.4 °C, with a standard deviation of 1.1 °C. Then, in that descending order, the agricultural area with 29.6 °C, and a standard deviation of 1.4 °C, and finally, the green area, with a value of 28.4 °C, and a standard deviation of 1.3 °C.
In the analysis performed, was detected that the heat islands are located, at first, in an area of transition between the urban area and its surroundings, which is certainly a dunes area, to the east of the city; secondly, the urban heat islands were detected where the land use is mixed, and in the mall located to the north–northwest of the city, a short distance from the international boundary; since this is a mandatory point for crossing the border, the heavy traffic and the commercial activities developed in that area seem to be factors linked that collaborate in the development of this UHI. We might even infer that the commercial area on 1st. and 2nd. streets in Calexico, CA., also contribute to this intra–urban, inter–border warm spot.
In the mixed land use, was found both, residential and commercial land uses, but the weightiest factor being the vacant lands, as they may potentially have the same effect as the desert area, i.e., they bring enough sensible heat flux to the urban canopy layer, thus increasing the air temperature slightly more than in the surroundings and producing a hot area or UHI.
The agricultural areas in the surroundings of the city (and also the green areas in the urban zone) show lower temperature because the vegetation seems to reduce thermal emissivity, and because part of the heat gained at the surface is expended as latent heat, thus reducing the sensible heat for directly heating the air.
Transect 5 was the one having the highest percentage in the development of heat islands, 20.7%, the lowest variability in temperature (0.6 °C of standard deviation), and the lowest spatial variability, as measured by the coefficient of variation (0.019). This result agrees with what Price (1990) expressed in the sense that the urban surfaces lacking vegetation do not commonly show wide thermal variability, due to the dry nature of non–evapotranspirative materials.
Transect 4, as it had been mentioned, had the lowest percentage in the development of heat islands, only 3.5%; however, its thermal variability is one of the biggest (1.3 °C of standard deviation), and also the spatial variability (0.0422 coefficient of variation). Contrary to what was stated in the previous paragraph these results indicate, that the urban surfaces through which the transect crosses, like the Sports City and the agricultural areas at its ends, being humid surfaces, generate a great thermal contrast, which has been corroborated by the statistical data described.
Indeed, it is a fact, green areas have lower temperature values, that is to say, they are cold islands, as is shown by the minimum value estimated for Mexicali city, which was 24.8 °C, although it seems that their effects are notable only in the immediate surroundings. This agrees with the observation by Spronken–Smith and Oke (1998) that the influence of parks on air temperatures seems to be restricted to a distance of the width of the park.
It must be remembered that the maximum intensity of the UHI, for Mexicali city, occurs bit before dawn (García and Dávalos, 2002); therefore, the time of the examined image (10:00 a.m.) is not the best for the study. Nevertheless, the thermal image of Landsat has given enough information for exploring and detecting the intra–urban variations as well as the heat islands in the urban canopy layer.
6. Conclusions
The study of urban heat islands (UHI), both, atmospheric and surface, in the city of Mexicali, Baja California, México, with different study techniques has showed that, as in other cities, this climatic phenomenon is also present. A daily cycle is observed in which the atmospheric UHI develops during the night, but in daytime disappears, giving way to an urban cold island. It seems to be that the physical properties of urban materials, especially thermal admittance and thermal diffusivity, compared with those of the rural area, have the major relevance for this result (among other things, because the city is relatively flat and it seems that there are no factors of urban geometry, like the sky view factor, which in other cities with high buildings is an important cause of the UHI), and maybe exacerbated by the heat addition of the traffic fleet that in the urban area exceeds 250,000 vehicles.
NOAA's AVHRR thermal images show that the agricultural areas are the coldest regions, whereas the hottest correspond to the urban area and to the surrounding desert. On this scale (1.1 km from spatial resolution) a great thermal variability is observed; nevertheless, it was possible to relate the land cover to SRT and to recognize different geomorphologic features. Very high surface radiative temperatures are observed within the city, i.e., a surface urban heat island (SUHI), as compared with the agricultural areas, which can be explained by a lower expenditure of energy in the evapotranspirative process in the urban area. This implies that if there is more vegetation, more cold will be the environment. Therefore, the parks, wooded areas, gardens in residential areas, etc., would reduce the demand for energy; in other words, the urban planners might handle strategies of environmental design, based on the use of green areas, for literally, to exchange water for electricity.
The linear relation proposed for estimating the air temperatures, starting from the SRT from Landsat thermal image, proved its goodness of fit; thus we could identify the atmospheric UHI, analyze the intra–urban thermal variation and associate it with the land use. The UHI had its better development to the east of the city in a dunes area, where there is a mixed land use, and in the commercial area of the historical center a short distance from the international border. With regard to the thermal transects, they follow an heterogeneous profile, of "ridges", "valleys", "plateaus", etc., as in a topographic map. This shows that the land use, especially in the urban canopy layer, transfers to the air its thermal properties through a vertical turbulent exchange of sensible and latent heat.
With regard to the mapping of air temperature distribution we could not obtain the best spatial coverage; consequently, its interpolation is subject to mistakes. To insist on the foregoing, as the temperature measurements were not carried out in different uses of urban land, the application of the regression analysis with the SRT, and its later application for estimating for the whole image, is subject to a certain margin of error. Possibly, a traverse in an instrumented car at the time the image was taken, with measurements in different urban land uses, might give a better approximation to the proposal of an association model between the SRT and the TAIR. Finally, another point to be introduced might be the surface emissivity value in the land cover/land use in the satellite Landsat images, for a better evaluation of the SRT. Due to the relationship found among the SRT, TAIR and the land use the creation of green areas to mitigate the UHI would be desirable because this would favor energy–saving policies and thus contribute to reduce global warming.
Acknowledgements
The authors are grateful for the translation to Mrs. Irene Marquina S. and Mr. Warren Haid, from the Veracruz University Research Department.
References
Alonso M. S., J. L. Labajo and M. R. Fidalgo, 2003. Characteristics of the urban heat island in the city of Salamanca, Spain. Atmósfera 16, 137–148. [ Links ]
Anderson S., 2002. An evaluation of spatial interpolation methods on air temperature in Phoenix, AZ. [http://www.coblestoneconcepts.com/ucgis2summer: June 10, 2005]. [ Links ]
Balling R. C. Jr. and S. W. Brazel, 1986a. Time and space characteristics of the Phoenix urban heat island. J. Arizona–Nevada Academy Science 21, 75–81. [ Links ]
Balling R. C. and S. W. Brazel, 1988. High Resolution Surface Temperature Patterns in a ComplexUrban Terrain. Photogram. Engin. Rem. Sens. 54, 9, 1289–1293. [ Links ]
Barradas V. L., 1987. Evidencia del efecto de la isla térmica en Jalapa, Veracruz, México. Revista Geofísica, Inst. Panamericano de Geogr. e Hist. OEA, 26, 125–135. [ Links ]
Becker F. and Z. L. Li, 1990. Towards a local split window method over land surfaces. Int. J. Remote Sens. 11, 369–393. [ Links ]
Carlson J. K., S. G. Benjamin and J. N. Cooper, 1981. Satellite estimation of surface energy balance, moisture availability and thermal inertia. J. Appl. Meteorol. 20, 67–87. [ Links ]
Carlson T. N., 1986. Regional–scale estimates of surface moisture availability and thermal inertiausing remote thermal measurements. Remote. Sens. Rev. 1, 197–247. [ Links ]
Carnahan W. H. and R.C. Larson, 1990. An analysis of an urban heat sink. Rem. Sens. Envir. 33, 65–71. [ Links ]
Cervantes J. P., V. L. Barradas, A. T. Martínez, Q. A. Cordova, C. T. Ramírez, and G. G. Tepach, 2000. Aspectos del clima urbano de Villahermosa, Tabasco, México. Universidad y Ciencia 16, 10–16. [ Links ]
Fernández F., J. P. Montávez, F. J. González–Rouco and F. Valero. A PCA analysis of the UHI form of Madrid, Spain. Fifth International Conference on Urban Climate, Lodz, Poland, September 2004, 80–84. [ Links ]
Gallo K. P., A. L. McNab, T. R. Karl, J. E. Brown, J. J.Hood and J. D. Tarpley, 1993. The use of NOAA AVHRR Data for Assessment of the Urban Heat Island Effect. J. Appl. Met. 32, 899–908. [ Links ]
Gallo K. P., R. D. Easterling and C. T. Peterson, 1996. The influence of land use/land cover on climatological values of the diurnal temperature range. J. Climate 9, 2941–2944. [ Links ]
García–Cueto, O.R., y E.G. Dávalos, 2002. Desarrollo de la Isla de Calor Urbano en Mexicali, B.C. Reporte Técnico, Instituto de Ingeniería, UABC, 45 pp. [ Links ]
García–Cueto O.R., A. Tejeda Martínez and E. Jáuregui, 2004. Contraste Ciudad–Desierto del balance de energía en la atmósfera superficial en el NW de México. Publicaciones de la Asociación Española de Climatología Serie A, No. 4, Asoc. Española de Climatología–Univ. Cantabria. [ Links ]
García E., 1982. Modificaciones al sistema de clasificación climática de Köppen. Instituto de Geografía, UNAM, 252 pp. [ Links ]
Hubble M., 1993. Monitoring and assessing surface and near surface urban climate with Landsat satellite imagery: Phoenix, AZ. Master Thesis, Department of Geography, Arizona State University. [ Links ]
Jáuregui E., 1975. Microclima del Bosque de Chapultepec. Boletín del Instituto de Geografía, UNAM, No. VI, 63–72. [ Links ]
Jáuregui E., 1979. La isla de calor en Toluca, México. Boletín del Instituto de Geografía, UNAM, No. IX, 27–37. [ Links ]
Jáuregui E., 1993. Mexico city's urban heat island revisited. Erdkunde 47, 185–195. [ Links ]
Jáuregui E., 1997. Heat island development in México City. Atmosph. Environ. 31, 3821–3831. [ Links ]
Klysik K. and K. Fortuniak, 1999. Temporal and spatial characteristics of the urban heat island of Lodz, Poland. Atmosph. Environ. 33, 3885–3895. [ Links ]
Lo C. P., D. A. Quattrochi and J. C. Luvall, 1997. Application of high–resolution thermal infrared remote sensing and GIS to assess the urban heat island effect. Int. J. Rem. Sens. 18, 287–304. [ Links ]
López G. A., F. G. Fernández, A. R. Fernández, E. H. García and F. I Arroyo, 1998. Temperaturas nocturnas y diurnas en Madrid a partir de teledetección aeroportada. CSIC, Parteluz 83 pp. [ Links ]
Ochi S., D. Uchihama, W. Takeuchi and Y. Yasuoka, 2003. Monitoring urban heat environment using MODIS data for main cities in East Asia. GISdevelopment.net. [ Links ]
Oke T. R., 1982. The Energetic basis of the Urban Heat Island. Q. J. R. Meteorol. Soc. 108, 1–23. [ Links ]
Oke T. R., 1987. Boundary layer climates. Methuen and Co. Ltd., 435 pp. [ Links ]
Oke T. R., G. T. Johnson, D. G. Steyn and I. D. Watson, 1991. Simulation of surface urban heat islands under ideal conditions at night, part 2: diagnosis of causation. Bound. Lay. Meteorol. 56, 339–358. [ Links ]
Price J. C., 1990. Using spatial context in satellite data to infer regional scale evapotranspiration. IEEE Trans. Geosci. Remote Sens. 28, 940–948. [ Links ]
Roth M., T. R. Oke and W. J. Emery, 1989. Satellite derived urban heat islands from three coastal cities and the utilization of such data in urban climatology. Int. J. Remote Sens. 10, 11, 1699–1720. [ Links ]
Schmid H. P. and T. R. Oke, 1992. Scaling North American urban climates by lines, lanes and rows. Geographical Snapshots of North America (D. B. Janelle Ed.). Guilford Press, New York, 395–399. [ Links ]
Smith R. M., 1986. Comparing traditional methods for selecting class intervals on choropleth maps. Professional Geographer 38, 62–67. [ Links ]
Spronken–Smith R. A. and T. R. Oke, 1998. The thermal regime of urban parks in two cities with different summer climates. Int. J. Rem. Sens. 19, 2085–2104. [ Links ]
Tejeda M. A. y F. Acevedo, 1990. Alteraciones climáticas por la urbanización en Xalapa, Ver. La Ciencia y el Hombre 6, 37–48. [ Links ]
Voogt J. A., 2002. Urban heat island. Causes and consequences of global environmental change. Encyclopedia of Global Environmental Change (Ian Douglas Ed.), 3, 660–666. [ Links ]
Voogt J. A. and T. R. Oke, 2003. Thermal remote sensing of urban climates. Rem. Sen.Environ. 86, 370–384. [ Links ]
Weng Q., 2001. A remote sensing–GIS evaluation of urban expansion and its impact on surface temperature in the Zhujiang Delta, China. Int. J. Rem. Sens. 22, 1999–2014. [ Links ]
Weng Q., 2003. Fractal Analysis of Satellite–Detected Urban Heat Island Effect. Photogram. Eng. Rem. Sens. 69, 555–566. [ Links ]

