


Serviços Personalizados
Journal

Artigo
 Inglês (pdf)
 Artigo em XML
 Referências do artigo
 Enviar este artigo por email
Indicadores
 Citado por SciELO
 Links relacionados
-
 Similares em
SciELO
Similares em
SciELO
Compartilhar

 Permalink
Atmósfera
versão impressa ISSN 0187-6236
Atmósfera vol.20 no.1 Ciudad de México Jan. 2007
Analysis of full–scale data obtained in a street canyon
N. A. MAZZEO, L. E. VENEGAS and P. B. MARTIN
Consejo Nacional de Investigaciones Científicas y Técnicas, Departamento de
Ciencias de la Atmósfera y los Océanos, Facultad de Ciencias Exactas y Naturales
Universidad de Buenos Aires
Ciudad Universitaria, Pab. 2, 2do. Piso, 1428–Buenos Aires, Argentina
Corresponding author: N. Mazzeo; e–mail: mazzeo@at.fcen.uba.ar
Received April 11, 2006; accepted July 15, 2006
RESUMEN
En las ciudades, principalmente en los cañones urbanos, se pueden presentar altos niveles de concentración de contaminantes en aire. El flujo del aire en los cañones urbanos está modificado por efectos aerodinámicos y térmicos, y por el movimiento de los vehículos que influyen sobre los niveles de contaminación. En este trabajo, se analizan valores horarios de concentraciones de CO y NOx medidas a 1.5 m de altura en el lado oeste de un cañón urbano de Göttinger Strasse en Hannover (Alemania) y de concentraciones de fondo de CO y NOx observadas en el techo de un edificio lateral. Asimismo, se incluyen en el análisis las observaciones horarias de velocidad y dirección del viento ambiental en el techo de ese edificio lateral e información horaria de volumen de tránsito en la calle del cañón. Los resultados permiten inferir la presencia de un vórtice en el aire dentro del cañón urbano, cuando el viento ambiental es mayor que 1.8 m/s y es perpendicular al eje de la calle. Se realizan algunas evaluaciones de la influencia de las turbulencias ambiental e inducida por los vehículos sobre las concentraciones locales en el cañón. Los resultados muestran que cuando la velocidad del viento es menor que 2 m/s, el efecto de la turbulencia inducida por los vehículos afecta la dispersión de los contaminantes dentro del cañón urbano.
ABSTRACT
In urban areas high air pollutant concentrations may be observed, mostly within street canyons, where buildings and other obstacles disturb the airflow and turbulence. Air motions inside the street canyons are influenced by aerodynamic and thermal effects and by the movements of the vehicles. In this article, we analyze hourly CO and NOx concentrations measured at 1.5 m height on the west side of a street canyon of Göttinger Strasse in Hannover (Germany) and background CO and NOx, wind speed and direction that have been measured on the roof of a nearby building. Information of traffic flow in the street is also available. Results show the presence of a vortex cell inside the street canyon when the ambient wind is greater than 1.8 m/s and is mainly perpendicular to the street axis. We evaluated of the relative influence of ambient and traffic–induced turbulences on local concentrations inside the canyon. The results show that traffic–induced turbulence becomes important when the wind is lower than 2 m/s.
Keywords: urban air quality, street canyons, traffic pollution.
1. Introduction
The concentration of air pollutants in urban areas due to motor vehicles has become of increasing concern. Urban pollution involves physical and chemical processes over a wide range of space and time scales. Cities have typical scales up to 10 to 20 km and possibly even larger when surrounding areas are added. The spatial scale of the pollution processes at the streets may be up to 100 or 200 m. This scale is representative of street canyon air pollution. The geometric arrangement of the buildings, the dimensions of the street canyon and the intersections affect the atmospheric dispersion processes corresponding to this spatial scale (Xie et al., 2005). The most characteristic feature of the street canyon wind flow is the formation of a wind vortex so that the direction of wind at street level is opposite to the flow above roof level (ambient wind). The presence of a canyon vortex has been demonstrated by Albrecht (1933) and later on verified by Georgii et al. (1967). When the street canyon is relatively deep the primary vortex will not extend to the ground and there may be a weak contra–rotating vortex near the ground. The primary vortex may not extend completely across the street if the street canyon is relatively shallow. There are variations on this flow due to wind directions not normal to the street axis, to the real rather than the simple idealized geometry of the street canyon and to the mean flow and turbulence generated by traffic within the street canyon (Pavageau etal., 2001).
Wind measurements in a street canyon were reported by Nakamura and Oke (1988). Wind speed and direction were measured both above and within the canyon. These observations confirmed the formation of a vortex when the ambient flow (N) was normal to the street axis. For oblique roof–level winds, a spiral wind flow through the canyon should be observed. Other complex channelling effects might be produced by winds parallel to the street axis. Additional low–pressure areas and wind circulations are created near intersections, resulting in horizontal corner vortices. The dispersion of pollutants in street canyons depends generally on the rate at which the street exchanges air vertically with the above roof–level atmosphere and laterally with connecting streets. Skimming flow, a feature of regular canyons, provides minimal ventilation of the canyon and is relatively ineffective in removing pollutants. Field measurements (DePaul and Sheih, 1985; Qin and Kot, 1993; Schatzmann et al., 2001; Berkowicz et al., 2002) show increased concentrations of traffic–related pollutants on the leeward side of the canyon, and decreasing concentrations along with height above the ground on both sides of the street. The increased leeward concentrations are due to the accumulation of pollutants locally advected by the large wind vortex that covers most of the canyon. Profiles of mean wind speed and turbulence statistics in and above the urban street canyon are presented by Rotach (1995), Louka et al. (2000) and Eliasson et al. (2006).
Their observations indicate that the profiles exhibit a strong dependence on atmospheric stability conditions. However, the effects of thermal stratification on the pollutant dispersion in a street canyon are not completely known. In addition, vehicles in movement might change the natural conditions of stratification.
Pollutant emissions from vehicles will dilute as they exit the vehicle exhaust initially through jet–like mixing processes, then by the turbulence in the vehicle wakes and then by turbulence in the street canyon as a whole. Vehicle–induced turbulence can be an important factor of pollutant dispersion in street canyons, in particular under conditions of low wind speed. The air turbulence generated by the movement of vehicles has been theoretically and experimentally studied in wind tunnel and full–scale experiments (Eskridge et al., 1991; Ketzel et al., 1999; Kastner–Klein et al., 2000; Stern and Yamartino, 2001; Vachon et al. 2002; Di Sabatino et al.; 2003; Kastner–Klein et al., 2003; Mazzeo and Venegas, 2005; Kalthoff et al., 2005; Bäumer et al., 2005). Most of treatments of vehicle–induced turbulence have been developed for simple, single lane, flat terrain reading situations. In the canyons there is a high density of vehicles and the turbulence induced by their motion is not a simple overlapping turbulent produced by each vehicle (Berkowicz et al., 1997).
In this article, we analyze both observational data on carbon monoxide (CO) and nitrogen oxides (NOx) concentrations measured in a street canyon in Hannover (Germany) and the background concentrations (measured on the roof of one of the lateral buildings). We relate these values with ambient wind speed and direction. Background concentrations and local concentrations (concentrations observed within the canyon minus background concentrations) observed in leeward and windward situations are compared. We analyze the variation of local concentration with traffic flow considering different wind speed conditions, for leeward and windward situations. We study the relative importance of both traffic–induced and ambient turbulences on local concentrations.
2. Data
Traffic pollution measurements in Gottinger Strasse (Hannover, Germany) have provided one of the most important datasets of airflow and pollutant concentrations in atypical urban street canyon. The information includes wind speed and direction measured by a sensor located on the top of a nearby building, CO and NOx concentrations [C]i measured inside the street canyon at a sampling height of 1.5 m, background concentrations [C]b measured on the roof of the building and traffic flow (NLÖ, 1993). Göttinger Strasse has four lanes (two in one way and two in the opposite direction). The mean value of hourly traffic flow (N) for the nocturnal period is 385 veh/h (working days) and 485 veh/h (weekends and holidays) and during day hours it is 1827 veh/h (working days) and 1625 veh/h (weekends and holidays). The street axis is oriented 163 – 343° with respect to north. The width (W) of the canyon is 25 m and the height (H) of the buildings on both sides of the street is approximately 20 m. Therefore, the aspect ratio (H/W) is 0.8. In this way, it is possible to expect a vortex cell (Oke, 1988), when the ambient wind has a perpendicular component to street axis and its speed is higher than 1.5–2.0 m/s. The background concentrations [C]b have been subtracted from the values measured inside the street [C]i in order to obtain the local concentrations [C]S = [C]i – [C]b inside the street canyon which are considered in the analysis.
3. Background CO and NOx concentrations
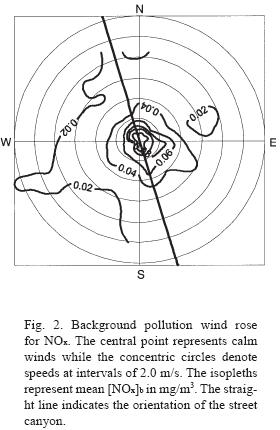
Pollutants emitted by vehicles that run on the different streets of a city and that are introduced in the atmospheric urban boundary layer contribute to "background" pollution. At roof level air is exchanged between the street and the boundary layer. Experimental evidence (Louka et al., 2000) shows that the re–circulation in the street is coupled to the wind aloft through a shear layer that develops at the roof–level. The shear layer is unstable, as Kelvin–Helmholtz instability, which leads to intermittency in the re–circulation in the street, and hence to ventilation of the air in the street (Louka et al., 2000). The background pollution wind roses for CO and NOx measured on the roof of a building of Göttinger Strasse (Hannover) are included in Figures 1 and 2, respectively. These diagrams show isopleths of [CO]b and [NOx]b concentrations for sixteen wind directions and a number of wind–speed classes. The central point in the diagrams represents calm winds while the concentric circles are at intervals of 2.0 m/s. Mean values of background and local concentrations of CO and NOx and ambient wind speed observed with ambient wind direction within ± 11.25° from the direction perpendicular to the street axis are shown in Table I. When wind direction is from (73° ± 11.25°) (towards the sampler) mean concentrations are higher and mean wind speed is lower than the mean values obtained when the wind direction is from (253° ± 11.25°). In order to compare the mean background concentrations [C]b for both wind directions considering quite similar mean ambient wind speeds (Um), the ratio I = [C]b(253°± 11.25°)/ [C]b(73° ± 11.25°) has been evaluated for Um = 2, 3, 4, 5 m/s. The variation of I obtained for CO and NOx with Um are presented in Figure 3. The difference between both curves may be due to differences in the emission of CO and NOx outside the street canyon. Figure 3 shows that, for this canyon, when Um < 3.1 m/s (for CO) and Um < 3.4 m/s (for NOx), I < 1.0. In this case, when ambient wind speed is low, air circulations developed within the street canyon may transport air pollutants from within the street upwards to the boundary layer aloft. These results show that mean background concentrations of both pollutants (Figs. 1 and 2) are slightly higher when the substances, once out of the canyon, are transported towards the sampler located on the roof of the building on the west side of the street, by low ambient wind speeds. On the other hand, when ambient wind speed is high, I > 1.0, background air pollution can be entrained into the circulation within the street canyon.


4. Local CO and NOx concentrations
4.1. Local pollution wind roses
Figures 4 and 5 show the local pollution wind roses for CO and NOx, respectively. Each plot included in Figures 4 and 5 corresponds to a different class of traffic flow: a) < 600 veh/h, b) 600–1200 veh/h, c) 1200–1800 veh/h, d) >1800 veh/h. In these figures a clear distinction between the values of the concentrations corresponding to leeward (wind directions from the western side of the street) and windward (wind directions from the eastern side of the street) cannot be observed when wind speed is weak. In general, it is accepted that when the wind speed is lower than 1.5–2.0 m/s, the vortex does not develop completely (Berkowicz et al., 1997). At higher wind–speeds, concentrations at leeward are higher than at windward side. These results are consequence of the dynamics of the vortex cell developed inside the street canyon. This effect intensifies when the direction of the wind gets perpendicular to the street axis. The mean values of [CO]S = ([CO]i – [CO]b) and [NOx]s = ([NOx]i – [NOx]b) estimated for leeward conditions (wind directions from 253° ± 11.25°) and windward conditions (wind directions from 73° ± 11.25°) are also included in Table I. Mean local CO and NOx concentrations for leeward cases are considerably higher (about four times) than for windward cases. Taking into account that mean ambient wind speed is greater for leeward conditions than for windward conditions (Table I) and that traffic motions in the street also affect dilution of pollutants mainly in leeward cases, the vortex inside the street canyon is the main responsible for the different concentration values obtained. The mean concentrations obtained when the wind blows in both opposite directions (163 and 343°) parallel to the street canyon are very similar.


4.2. Windward conditions
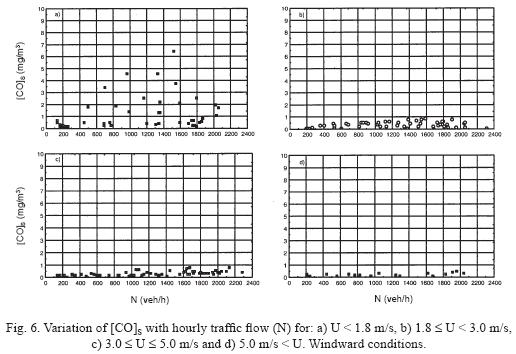
The variation of [CO]S and [NOx]S with hourly traffic flow (N), for four ranges of wind speed (U): (a) < 1.8 m/s; (b) 1.8–3.0 m/s; (c) 3.0–5.0 m/s; (d) > 5.0 m/s, when sampler is located at windward can be seen in figures 6 and 7, respectively. Except for wind speeds < 1.8 m/s (Figs. 6a and 7a), the increase of [CO]S and [NOx]S values with hourly traffic flow is very little. For U ± 1.8 m/s, [CO]S and [NOx]S values at windward side are low, probably as a consequence of the dilution originated by the vortex circulation inside the street canyon. In these conditions, [CO]S values are lower than 1.0 mg/m3 and [NOx]S values are lower than 0.160 mg/m3. However, when U < 1.8 m/s, there are several values of [CO]S and [NOx]S greater than 1.0 mg/m3 and 0.160 mg/m3, respectively, indicating that for very low wind speeds, the vortex is not completely developed, being capable to exist other turbulent structures.

The values of local concentrations [CO]S (Fig. 8) and [NOx]S (Fig. 9) are plotted against the ambient wind speed (U) with wind direction within 73° ± 11.25°, for N < 600 veh/h and N > 1800 veh/h. These figures show, as examples, the situations of lowest and highest traffic flow in this street. As expected, concentrations are higher for lower wind speeds and larger traffic flows. For high Reynolds numbers, usually found in urban–canopy flows, street–canyon concentration values can be scaled by a reference wind velocity ([C]S  U–1) (Ketzel etal., 1999; Kastner–Klein et al., 2001). However, Ketzel et al. (1999) considered a general form ([C]S U–n) and using data from Göttinger Strasse, suggested that for windward conditions may be n ≠ 1. Local concentrations shown in Figures 8 and 9 have been fitted to a power–variation given by [C]S U–n, obtaining n ≈ 0.55 (for CO) and n ≈ 1.0 (for NOx). The difference between the values of the exponents for both pollutants is not clear. The few cases and the scatter of the measured data might contribute to this difference.


4.3. Leeward conditions
The variations of [CO]S and [NOx]S with hourly traffic flow (N), for four ranges of wind spee (U): (a) < 1.8 m/s; (b) 1.8-3.0 m/s; (c) 3.0-5.0 m/s; (d) > 5.0 m/s, when sampler is located at leeward are presented in Figures 10 and 11. Local [CO]S and [NOx]S concentrations increase non–linearly with traffic flow. This non–linear variation comes from the combination between emission from vehicles circulating in the street and the air turbulence (natural as well as traffic–induced) dispersion effects.
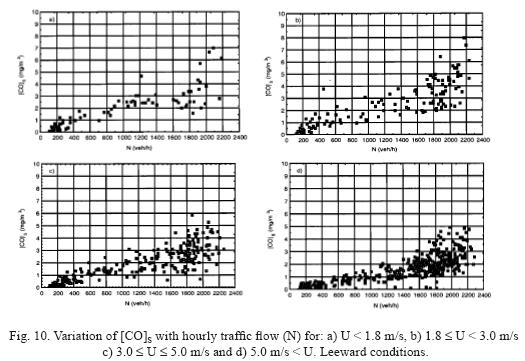
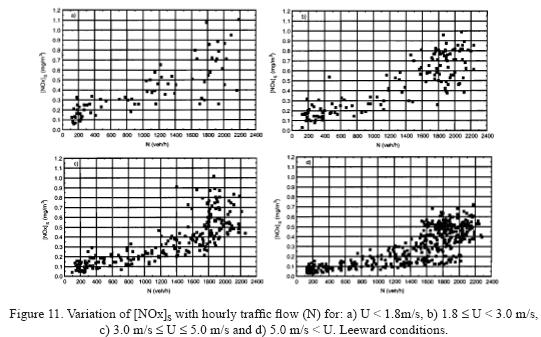
Three regimes can be distinguished in the plots included in Figure 10 (for CO) and in Figure 11 (for NOx). For low and high traffic volumes the increment of local concentrations with the number of vehicles is greater than the observed for the intermediate range of traffic volume. Values of traffic volume that define these three regimes depend on wind speed. Natural air turbulence is always present and affects local concentrations within the street canyon. Nevertheless, we may assume that this effect is almost similar for each wind speed range considered in each plot in Figures 10 and 11. Under light traffic conditions, an increase in emission rate increases concentration levels, as dilution effect of traffic–induced turbulence generated by the few cars circulating in the street is limited. In the case of high traffic densities, vehicles can be assumed to be densely packed and traffic–induced turbulence effect is expected to become independent of the number of vehicles (Di Sabatino et al., 2003) while emission rate increases with N. For intermediate traffic flows, local concentration levels result from the interaction of both emission rate and traffic–induced turbulence dilution effect.
As mentioned before, the pollutant dispersion within a street canyon is influenced by the joint action of both ambient and traffic–induced turbulences. On the leeward side, concentration level is the result of direct contribution of vehicle emissions and dilution of pollutants governed by ambient and traffic–induced turbulences. In particular, for low wind speeds, traffic–induced turbulence may become an important factor for the dilution of pollutants in streets and should affect the concentration value. The problem is complex and a separately quantification of the influences of ambient turbulence and of traffic–induced turbulence on the pollutants dispersion using full–scale measurements have not been obtained yet.
Assuming that traffic–induced velocity fluctuations contribute to the dilution of street–canyon pollutants in addition to wind–induced dispersive motions, Kastner–Klein et al. (2003) introduced the following dispersive velocity scale (Us) that account for both dispersion mechanisms:
US = [σu2 + σt2]1/2......................................................................(1)
where su2 is the contribution of ambient turbulent energy and st2 is the contribution of turbulent energy produced by the traffic motion.
Based on the analysis of wind–tunnel and full–scale concentration data, Kastner–Klein et al. (2003) proposed that the turbulent motions related to wind and traffic are mixed inside the canyons so that the dispersive velocity scale can be taken proportional to a linear combination of the squares of wind speed (U) and traffic velocity (V):
US = [a U2 + b V2]1/2..................................................................(2)
where a depends on the street geometry, wind direction and sampling position and b is a function of vehicles characteristics, average drag coefficient of the vehicles and the number of vehicles per unit length. For the Göttinger Strasse canyon conditions, Kastner–Klein et al. (2003) found out that a = 0.00035.
Some authors (Berkowicz et al., 2002; Kastner–Klein et al., 2003) propose that for high Reynolds numbers, which are typical in street canyons, even with weak winds, the leeward local concentration with ambient wind perpendicular to the street axis, must be inversely proportional to the dispersive velocity scale:
C α 1/US................................................................................. (3)
Considering Eq.(2) in Eq.(3), the variation of local concentrations with ambient wind speed can be obtained. In particular, our interest is to study the patterns of C vs U for low and high traffic flow conditions. As examples, we include the variation of [CO]S (Fig. 12)and [NOx]S(Fig. 13)withUat leeward conditions, with ambient wind direction within ± 11.25° from the direction perpendicular to the street axis, for low (N < 600 veh/h) and high (N > 1800 veh/h) traffic flows. It can be seen that for ambient wind speeds lower than 6 m/s the fitting curve considerable deviates from [C]s a U–n (a straight line in a log–scale plot). The deflection is more pronounced for higher traffic volume and lower wind–speed. The [C]S values represented in Figures 12 and 13 have been adjusted to a general expression with the following functional form (full line):
[C]S = p (0.00035 U2+ σt2.........................................................(4)
where p depends mainly on the pollutant emission strength (proportional to the vehicular flow) and on the canyon dimensions. For high wind speeds, [C]S ≈ p (0.00035)–1/2 U–1. According to the results reported in previous studies, in this street canyon traffic influence is less important for U > 6 m/s (Ketzel et al., 1999) or U > 5 m/s (Kastner–Klein et al., 2003). Using [C]S data observed during high wind speed (U > 6 m/s) we estimated the value of p for CO and NOx, corresponding to each traffic class. Then, knowing p and fitting Eq.(4) to all data, we obtained σt2 (included in Figs. 12 and 13). From Eqs. (1) and (2), σt2 = bV2. Then, for N < 600 veh/h considering V = 50 km/h, we obtain b = 0.0000089 (for CO) and b = 0.0000079 (for NOx), and for N > 1800 veh/h with V = 40 km/h, the values of b are 0.0000406 (for CO) and 0.0000418 (for NOx). The obtained values of b for CO and NOx are quite similar (differences might be due to the fact that they are obtained from experimental data) and are of the same order of magnitude than the values obtained by Kastner–Klein et al. (2003) using another methodology.
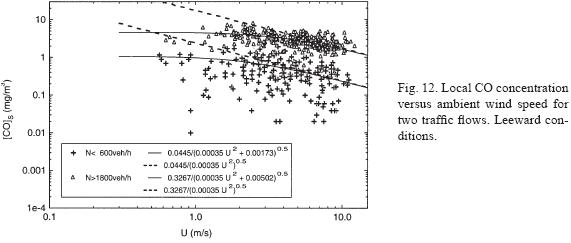

Dotted lines in Figures 12 and 13 represent the form [C]So = p (a U2)–1/2. This variation would represent the hypothetical condition with "zero" traffic–induced turbulence, in which only the fluctuations caused by the ambient wind affect the pollutant concentration levels (usually when U > 6m/s). In this way, [CO]S and [NOx]S data can be used to isolate the influences of ambient and vehicle induced turbulences. For weak winds (when σu2 << σt2) traffic–induced turbulence is an important factor for the dilution of pollutants in streets, and for high wind speeds (when σu2 >> σt2) ambient turbulence become the more important factor. The variation of local concentration ratio between the expressions of [C]S (with traffic–induced turbulence) and [C]So (without vehicle turbulence) with wind speed, for leeward conditions and N < 600 veh/h and N > 1800 veh/h, is shown in Figure 14. The curves obtained for both pollutants, CO and NOx, are very similar. [CO]S /[CO]So and [NOx]S/[NOx]So rapidly increase with wind speed for U < 2 m/s (N < 600 veh/h) and U < 4 m/s (N > 1800 veh/h) and increase very slowly for U > 4 m/s (N < 600 veh/h) and U > 6 m/s (N > 1800 veh/h). At higher wind speeds, the importance of the vehicle turbulence diminishes relative to ambient turbulence levels.

A comparison with data obtained from a wind tunnel study (Kastner–Klein et al., 2000) and numerical model results (Stern and Yamartino, 2001) is shown in Figure 15. In this figure the ratios [CO]S/[CO]So and [NOx]S/[NOx]So are plotted against X = [(N/V)/0.067]1/3 (V/U), where velocity ratio (V/U) has been scaled by the dimensionless factor [(N/V)/α]1/3 (Kastner–Klein et al., 2000, Stern and Yamartino, 2001) which accounts for the traffic density (N/V) and the wind tunnel to full–scale scaling factor α = 0.067 m–1. Data can be adjusted to the following functional form:

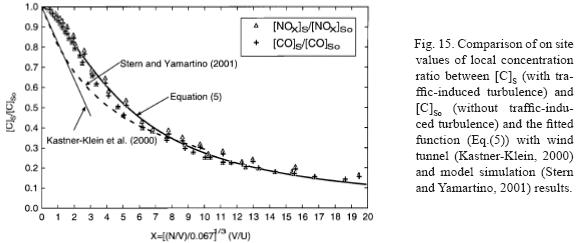
The representation proposed by Kastner–Klein et al. (2000), C/C0 = 1 – 0.18X, and by Stern and Yamartino (2001), C/C0 = 1/(1 + 0.24X), are also shown in Figure 15. In general, Eq.(5) may be closely related to the physical picture of ambient turbulence acting on a vehicle–turbulence generated well–mixed zone (or initial σz in the Gaussian plume sense).
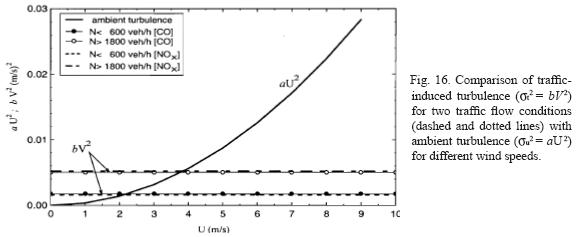
Figure 16 shows the values of σu2 (ambient turbulence) and σt2 (traffic–induced turbulence) against wind speed (U) for different traffic conditions. It can be observed that for N < 600 veh/h, σt2 > σu2 when U < 2 m/s and for N > 1800 veh/h, σt2 > σu2 when U < 4 m/s.
5. Conclusions
This paper presents an analysis of CO and NOx concentrations observed within a street canyon, CO and NOx background concentrations, traffic flow and wind speed and direction data obtained in Göttinger Strasse (Hannover, Germany). The main observed features are summarized below:
• The analysis of background concentrations of both pollutants showed evidence that, when ambient wind speed is low, air circulations developed within the street canyon may transport air pollutants from within the street upwards to the boundary layer aloft and, when ambient wind speed is high, background air pollution can be entrained into the circulation within the street canyon.
• Local concentrations of CO on the leeward side can be three or four times the background CO concentrations and local concentration values of NOx may be an order of magnitude greater than background values.
• For both pollutants, mean local concentration observed on leeward side is about four times the one observed on windward side of the street.
• When the wind speed is weak (< 1.8 m/s) and its direction is perpendicular to the street axis there is no indirect evidence of the presence of the typical vortex cell inside the canyon.
• For windward situations, the variation of local concentrations of both pollutants with ambient wind speed can be fitted to a power law of the form [C]S α U–n.
• For leeward situations, the variation of local concentrations with hourly traffic flow, for different wind speed ranges, show three different regimes. For low and high traffic volumes local concentrations increase with the number of vehicles more rapidly than for the intermediate range of traffic flow.
• Traffic–induced turbulence is more important than ambient turbulence when the wind speed is lower than 2.0 m/s.
• We obtained an empirical relationship for the ratio [C]S / [C]So (between local concentrations with traffic–induced turbulence [C]S and without vehicle turbulence [C]So) as function of X = [(N/V)/0.067]1/3 (V/U). The results have been compared with data obtained from a wind tunnel study and numerical model results.
Acknowledgements
This work has been partially supported by Projects: Grant UBACyT–X060 and Grant CONICET PIP 6169. The traffic pollution data used in this paper are available on www.dmu.dk/atmosphericenvironment/Trapos/datadoc.htm, within the framework of the European Research Network on Optimisation of Modelling Methods for Traffic Pollution in Streets (TRAPOS).
References
Albrecht F., 1933. Untersuchungen der vertikalen luftzirkulation in der grosstadt.Met. Zt. 50, 93–98. [ Links ]
Bäumer D., B. Vogel and F. Fiedler, 2005 .Anew parameterisation of motorway–induced turbulence and its application in a numerical model. Atmos. Environ. 39, 5750–5759. [ Links ]
Berkowicz R., O. Hertel, S. E. Larsen, N. N. Sorensen and M. Nielsen, 1997. Modelling traffic pollution in streets. Ministry of Environment and Energy, NERI, Roskilde, Denmark, 55p. [ Links ]
Berkowicz R., M. Ketzel, G. Vachon, P. Louka, J. M. Rosant, P. G. Metsayer and J. F. Sini, 2002. Examination of traffic pollution distribution in a street canyon using the Nantes'99 experimental data and comparison with model results. Water, Air and Soil Poll.: Focus 2, 311–324. [ Links ]
DePaul F. T. and C. M. Sheih, 1985. Atracer study of dispersion in an urban street canyon. Atmos. Environ. 19, 555–559. [ Links ]
Di Sabatino S., P. Kastner–Klein, R. Berkowicz, R. E. Britter and E. Fedorovich, 2003. The modeling of turbulence from traffic in urban dispersion models – Part I: Theoretical considerations. Environ. FluidMech. 3, 129–143. [ Links ]
Eliasson I., B. Offerle, C. S. B. Grimmond and S. Lindqvist, 2006. Wind fields and turbulence statistics in an urban street canyon. Atmos. Environ. 40, 1–16. [ Links ]
Eskrigde R. E., W. B. Petersen and S. T. Rao, 1991. Turbulent diffusion behind vehicles. Effect of traffic speed on pollutant concentrations. JAWMA 41, 312–317. [ Links ]
Georgii H. W., H. W. Busch and E. Weber, 1967. Untersuchung über die zetliche und raumliche verteilung der immissions–konzentration des kohlenmonoxid in Frankfurt am Main. Berichte des Institutes für Meteorol. und Geophys., der Universität Frankfurt/Main, N° 11. [ Links ]
Kalthoff N., D. Bäumer, U. Corsmeier, M. Kohler and B. Vogel, 2005. Vehicle–induced turbulence near a motorway. Atmos. Environ. 39, 5737–5749. [ Links ]
Kastner–Klein P., R. Berkowicz and E. J. Plate, 2000. Modelling of vehicle–induced turbulence in air pollution studies for streets. Int. J. Environ. Poll. 14, 496–507. [ Links ]
Kastner–Klein P., E. Fedorovich, M. Ketzel, R. Berkowicz and R. E. Britter, 2003. The modeling of turbulence from traffic in urban dispersion models–Part II: Evaluation against Laboratory and full–scale concentration measurements in street canyons. Environ. FluidMech. 3, 145–172. [ Links ]
Ketzel M., R. Berkowicz, W. Müller and A. Lohmeyer, 1999. Dependence of street canyon concentrations on above roof wind speed–Implications for numerical modelling. 6th. Int. Conf. on Harmonisation within Atmos. Disp. Modelling for Regulatory Purposes. Rouen, France, 11– 14 October 1999. [ Links ]
Louka P., S. E. Belcher and R. G. Harrison, 2000. Coupling between air flow in streets and the well–developed boundary layer aloft. Atmos. Environ. 34, 2613–2621. [ Links ]
Mazzeo N. A. and L. E. Venegas, 2005. Evaluation of turbulence from traffic using experimental data obtained in a street canyon. Int. J. Environ. Poll. 25, 164–176. [ Links ]
Nakamura Y. and T. R. Oke, 1988. Wind, temperature and stability conditions in and E–W oriented canyon. Atmos. Environ. 22, 2691–2700. [ Links ]
N. L. Ö. 1993. Lufthygienische Überwachungssystem Niedersachsen – Niedersächsisches Lande–samt für Ökologie, Research Network TRAPOS. Available at www.dmu.dk/atmosphericenvironment/Trapos/datadoc.htm [ Links ]
Oke T. R., 1988. Street design and urban canopy layer climate. Energy and Build. 11, 103–113. [ Links ]
Pavageau M., S. Rafaildis and M. Schatzmann, 2001. A comprehensive experimental databank for verification of urban car emission dispersion models. Int. J. Environ. Poll. 15, 417–425. [ Links ]
Qin Y. and S. C. Kot, 1993. Dispersion of vehicular emission in street canyons, Guangzhou city South China (P.R.C.). Atmos. Environ. 27B, 283–291. [ Links ]
Rotach M. W., 1995. Profiles of turbulence statistics in and above an urban street canyon. Atmos. Environ. 29, 1473–1486. [ Links ]
Schatzmann M., Ch. Chauvet, B. Leitl, T. Glanert, R. Berkowicz, M. Ketzel and F. Palmgren, 2001. Comparison of Jagtvej field data set with corresponding wind tunnel results, 7th Int. Conf. on Harmonisation within Atmos. Disp. Modelling for Regulatory Purposes, Belgirate, Italy, 28–31 My 2001 (online available at www.harmo.org/conferences/belgirate/7harmo.asp). [ Links ]
Stern R. and R. J. Yamartino, 2001. Development and first evaluation of micro–calgrid: a 3–D, urban–canopy–scale photochemical model. Atmos. Environ. 35, Supp., S149–S165. [ Links ]
Vachon G., P. Louka, J–M. Rosant, P. G. Mestayer and J–F. Sini, 2002. Measurements of traffic–induced turbulence within a street canyon during the Nantes'99 Experiment, Water, Air and Soil Poll.: Focus 2, 127–140. [ Links ]
Xie X., Z. Huang, and J. Wang, 2005. Impact of building configuration on air quality in street canyon. A tmos. Environ. 39, 4519–4530. [ Links ]

