


Serviços Personalizados
Journal

Artigo
 Inglês (pdf)
 Artigo em XML
 Referências do artigo
 Enviar este artigo por email
Indicadores
 Citado por SciELO
 Links relacionados
-
 Similares em
SciELO
Similares em
SciELO
Compartilhar

 Permalink
Atmósfera
versão impressa ISSN 0187-6236
Atmósfera vol.20 no.1 Ciudad de México Jan. 2007
Methodological approach to the study of the daily persistence of the sea breeze in Alicante (Spain)
C. AZORÍN–MOLINA
Laboratorio de Climatología, Instituto Universitario de Geografía, Universidad de Alicante,
P. O. Box 99, 03080 Alicante, España Corresponding author e–mail: cesar.azorin@ua.es
J MARTÍN–VIDE
Grupo de Climatología, Departamento de Geografía Física, Universidad de Barcelona,
C/ Montalegre 6, 08001 Barcelona, España
jmartinvide@ub.edu
Received November 16, 2005; accepted July 3, 2006
RESUMEN
Este estudio examina el grado de persistencia de la brisa marina en Alicante. Esta investigación está basada en la secuencia de datos semi–horarios de dirección y velocidad de viento correspondientes al período quinquenal 1999–2003 (base de datos de días de brisa marina). El comportamiento repetido de esta variable meteorológica (días consecutivos con vientos en régimen de brisa marina) es estudiado mediante la aplicación de varios métodos y técnicas estadísticas: análisis del número y longitud de las rachas de días con brisa marina; distribución de frecuencias de las rachas según la duración (curvas de concentración o de Lorenz); cálculo de coeficientes de persistencia (probabilidades empíricas y condicionadas), y ensayo de probabilidades de duración de las rachas de brisa marina utilizando el modelo de las cadenas de Markov de primer y segundo orden (cM1 y cM2). Los resultados demuestran el elevado grado de persistencia de este mecanismo de vientos en el sureste de la península ibérica, particularmente en verano. La persistencia de la brisa marina se relaciona con dos factores principales: las condiciones sinópticas regionales (débil gradiente de presión en superficie) y las características del terreno –topografía–. La caracterización estadística de la persistencia de la brisa marina podría ser una herramienta útil en el análisis de la variabilidad anual y estacional de los niveles de contaminación atmosférica en la cuenca del Mediterráneo.
ABSTRACT
This study examines the degree of persistence in the sea–breeze in Alicante. This research is based upon the sequence of semi–hourly data for wind direction and speed for the five–year period from 1999 to 2003 (database of sea breeze days). The repetitive behaviour of this meteorological variable (consecutive days with sea breeze winds), is studied by applying various methods and statistical techniques: analysis of the number and length of spells of days with sea breeze; frequency distribution of the sequences according to duration (concentration, or Lorenz, curves); calculation of coefficients of persistence (empirical and conditional probabilities), and probability testing for the duration of the sea breeze spells using one and two–order Markovian chain models (cM1 and cM2). The results demonstrate the high level of persistence of this wind mechanism in the southeast of the Iberian peninsula, especially in summer. The persistence of the sea breeze is related to two main factors: the synoptic regional conditions (weak surface pressure gradient) and the characteristics of the land –topography–. Statistical characterization of the persistence of the sea breeze could become a useful tool in the analysis of annual and seasonal variability in atmospheric contamination levels in the Mediterranean basin.
Keywords: Sea breeze, persistence, concentration curve, Markov chain, Alicante.
1. Introduction
Inertia is understood to be the capacity of a body to persist, in other words, its resistance to change. Inertia is an inherent property in all meteorological variables to a greater or lesser extent (Martín–Vide, 2003). The status of the atmospheric weather at any given time (temperature, humidity, precipitation, wind, atmospheric pressure, cloud cover, etc.) is directly related to meteorological conditions previously recorded. This dependence lessens as the period of time passed increases. Furthermore, the persistent character is not identical between the various meteorological phenomena, as it depends on the continuity of each meteorological variable. For example, temperature is more persistent than precipitation, as it is a time–continuous atmospheric element (Martín–Vide, 2003). However, wind is defined as a semi–continuous atmospheric phenomenon, as air is not in constant movement.
The sea breeze was the object of few studies by Spanish climatologists (Ramis and Alonso, 1988; Ramis et al., 1990) until the 1990s. More recently, it has become increasingly valued in research work on the Mediterranean area (Furberg et al., 2002). This can be explained by the high level of occurrence and persistence of the sea breeze in this area, the important atmospheric role of wind circulation in the dynamic of pollutants in the Mediterranean basin (Millán, 2003), and the spatial and temporal increase of wind–speed and direction data (Achberger et al., 2006).
Recent papers include studies on the climatology of sea breezes by Ramis and Alonso (1988), Ramis et al. (1990), Ramis and Romero (1995), Romero and Ramis (1996), González Márquez et al. (1998) and Alomar et al. (2004) for the Balearic Islands; Redaño et al. (1991), Palomares (1996) and Prohom (1998), for the Catalan coast; Quereda (1987), Quereda and Montón (1994; 1998), Quereda et al. (2004), Salvador (1990; 1999), Boix et al. (1995), Salvador and Millán (2003), Miao et al. (2003), Azorín–Molina (2004) and Olcina–Cantos and Azorín–Molina (2004) for the area of Valencia, and Kottmeier et al. (2000) for Southeastern Spain. These studies have attempted to analyze the main characteristics, physical processes and effects of the sea breezes on the Mediterranean coast of the Iberian peninsula. In other cases, tests have been carried out by modelling this mesoscale mechanism (for example, Ramis et al., 1990; Redaño et al., 1991; Salvador, 1999). The latter includes work on the dispersion of pollutants, carried out at the Centre for Environmental Studies in the Mediterranean, Fundación CEAM (Centro de Estudios Ambientales del Mediterráneo) by Millán, Estrela, Salvador and other researchers (Millán, 2002).
In contrast to research on the Spanish Mediterranean coast, few studies have been published on sea breezes along the Iberian Atlantic coast (Alcoforado, 1987; Arteche et al., 2004; Vasconcelos et al., 2004; Vasconcelos and Lopes, 2005), due to the dominance of synoptic winds for much of the year.
Ramis and Alonso (1988) defined the average meteorological conditions that favor the high persistence of the sea breeze during summer in the Mediterranean: weak geostrophic wind, anticyclonic circulation (Reiter, 1975), intense solar radiation and clear sky.
This article looks at statistical tests to measure the degree of persistence of the sea breeze. The methodological testing of all these statistical study techniques in Spain, especially the use of Markov chains, evaluates or values the occurrence and duration of dry and rainy spells (Martín–Vide, 1981; Raso Nadal, 1982; Gómez Navarro, 1997; Lana and Burgueño, 1998; among many others). It also studies the daily concentration of precipitation (Martín–Vide, 2004). However, Markov chains have not been used to examine the persistence of sea–breezes. This new methodological approach could help explain the seasonal and annual variability of concentration levels of pollutants. This problem is specific to the Mediterranean coastal cities, which are governed by a recirculating cycle of polluted air masses (Millán, 2002).
2. Data and methods
2.1 Data set
This study focuses on statistical analysis of the persistence of the sea breeze at a specific point on the central coast of Alicante (campus of the University of Alicante, San Vicente del Raspeig). This point is located on the coastal plain of the Campo de Alicante district, at approximately 100 meters above sea level and 5 km from the coastline of the Mediterranean Sea. The study area is located in the southeastern region of the Iberian peninsula (Fig. 1).

The climatic data, recorded half–hourly, for wind speed and direction, were obtained from the automatic meteorological station of the Laboratory of Climatology of the University of Alicante, from 14 August 1999 to 31 December 2003. The hourly data from the Alicante–Renfe automatic meteorological station depend upon the Atmospheric Contamination Control and Monitoring Network of Conselleria de Territori i Habitatge (Generalitat Valenciana), which is located about 5 km from the university. This location was used to complete the five–year study period (1999–2003). In both cases, the wind speed and direction was measured at a height of 10 meters (Table I).

Days with sea breeze were selected and the following statistical techniques were used to study the degree of persistence:
(i) Absolute and mean number of sea breeze spells, and maximum, minimum and mean length of sea breeze spells, at different time scales (annual, monthly and seasonal).
(ii) Distribution of frequencies according to the length of the spells of sea breeze,
(iii) Empirical probabilistic estimation of the persistence of the sea breeze,
(iv) Markovian analysis of the spells of days with sea breeze.
2.2. Identifying sea breeze days by the manual method
The days with a sea breeze were identified manually, with the experience and empirical knowledge of the distinctive characteristics of the sea breeze. The statistical characterization of the occurrence and persistence of the sea breeze is too complicated to analyze by automatic selection: generally, the objective criterion apply to the study of the characteristics and physical processes of the sea breezes. They are very precise and underestimate the breezy days with this circulation of winds (Borne et al., 1998). As such, they have been dismissed as inapplicable for this case in study. On the other hand, detailed manual revision recorded on a daily basis permits the creation of a database of days with sea breezes. To statistically value the persistence of this phenomenon, the complete daily cycle of days with a sea breeze was considered. Incomplete days, when there was interference by synoptic or mesoscale factors, independent of the duration of the sea breeze also had to be considered. All of these can be defined as sea breeze days selected by the manual method. The interference of the synoptic or mesoscale factors can provoke a delay in the onset–time, or a slight variation in the direction and reinforcement of the speed of the sea breeze. These days should be taken into account in the study of the degree of persistence. According to Prezerakos (1986), the best way to select days with a sea breeze is by manually examining the anemograph, although this could prove a laborious task for long study periods. The manual method has been used by other authors: Arteche García (2001) selected 57 cases during the period of 1992–1996 (May to September) after visual observation of the wind direction graphics from the automatic meteorological station in Santander (Northern Spain).
The main criterion used for selecting sea breezes days was the change in direction (approximately between 120 and 180°), and wind speed (over 5.4 kph or 1.5 m/s) during the day (Steyn and Faulkner, 1986; Redaño et al., 1991; Banfield, 1991; Gustavsson et al., 1995; Borne et al., 1998; Furberg et al., 2002; among others). This is not attributed to the circulation of the synoptic scale. It was the only criterion which theoretically assured that the synoptic regional conditions were stable and that the difference between the land–sea temperature was positive. The selection criterion indicated by the authors as essential atmospheric requisites for the breeze to blow, was a weak pressure gradient at surface level and a weak large–scale flow (Steyn and Faulkner, 1986; Borne, et al., 1998; Furberg et al., 2002; Salvador and Millán, 2003; among others).
The greatest difficulty of the manual method was in the detection of the synoptic influence in winds that coupled to the same sector of wind direction as the sea breeze –as in the first and second quadrant in Alicante (Redaño et al., 1991; González et al., 1998). In this case, through observation and direct analysis of the wind data, revelation of the medium–high intensity of zonal situations was possible: 1) stronger spells, generally prolonged night and day; and 2) constant direction without sudden turns.
In addition to this primary criterion, Gustavsson et al. (1995) and Prohom (1998) consider additional complementary filters for identifying days with a sea breeze: (i) stabilization and downwards inflection of the air temperature curve, minutes after the sea breeze begins; (ii) stabilization or upwards inflection of the air relative humidity curve, minutes after the sea breeze begins.
The manual filter of the data on wind speed and direction (1999–2003) revealed 1227 days with a sea breeze; this constitutes 67.20% of the total days of the period. This signifies that the sea breeze blew over the Mediterranean coast of Alicante for two out of every three days. The subjective characteristic of the selection method, plus the difficulty in discriminating between days with sea breeze and those with winds of synoptic origin, created a small margin for error that tended to slightly overestimate the results.
This database was used to test the application of the following statistical tests.
2.3 Statistical analysis methods for the study of the persistence of the sea breeze
2.3.1 Spell method
This consists of counting the number and length of the spells of sea breeze, where the spell is a sequence or period of time made up of consecutive days with a sea breeze. Grouping days with a sea–breeze into spells requires three methods, which consider different allocation criteria when a spell stretches from one month to another or from one year to the next.
Method a. Assigns the days of a spell to the month or year in which the sequence of consecutive sea breeze days began (Douguédroit, 1987). This is inconvenient for assigning spells which begin in the last days of a month, when more days accumulate the following month. This example is outlined in Table II, which assigns the spells of 17 days of sea breeze (from 29/03 to 14/04) to the month of March. For the study period 1999–2003, 219 spells were recorded. This is less equitable than method b.
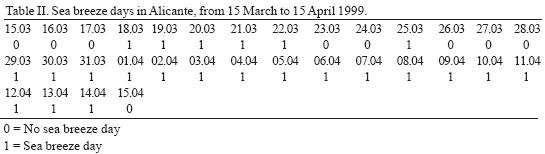
Method b. Assigns the days of a spell to the month or year with the greatest number of sea breeze days. The exception to this is when both add up to the same number, and in this case the criterion adopted is that the spell is assigned to the month in which it starts. Without breaking spells, this method favours the month which has a greater participation in the phenomena. In the example shown in Table II, April contains the spell of 17 days of sea breeze. This is the method that was used in this study. Using this method, an identical number of sea breeze sequences were recorded, as 219 spells.
Method c. Works with independent or individual months, fragmenting the spells that last from one month to the next (there are a total of 33 cases of this kind). By breaking spells, a total of 252 sequences were counted. This method is inadequate in valuing the persistence of the sea breeze. In the example shown in Table II, the spell of 17 days was broken into 2, with 3 days in March and 14 in April. This is the procedure used to calculate half of the statistic monthly values.
The average length of the spell is obtained as the quotient between the total number of days with a breeze and the total number of spells for the period of time being valued.
2.3.2 Frequency distribution of concentration, or Lorenz, curves
The knowledge of the structure of the days with a sea breeze throughout the statistical sample considered (1999–2003), is obtained by applying the frequency distribution method and its graphic representation by means of the concentration, or Lorenz, curves (Martín–Vide, 2003). The study of frequency distribution in accordance with the spells of sea breeze considers the following statistical fields:
(i) Class: spells were classified in increasing order in class intervals of two days, from the lowest (1–2 days) to the highest (51–52 days). The latter class considers the maximum length of the absolute sea breeze spell recorded during the entire study period.
(ii) Midpoint: central values representative of each class.
(iii) ni: number or absolute frequency of sea breeze spells for each class or class interval.
(iv) ∑ni: accumulated absolute frequency, a value that is obtained by adding the number of spells of each lower class to the last one considered. The value corresponding to the last class interval must coincide with the total number of sea breeze spells throughout the period considered; for the five–year period 1999–2003, the 1227 days with a sea breeze selected were grouped into 219 spells (method b).
(v) Pi: the product of the midpoint and ni for each class, where this operation gives a precise estimation of the total number of days with a sea breeze.
(vi) ∑Pi: accumulated number of days with a sea breeze per class, adding the intervals below the class. The value of the last class represents a close approximation of the total number of days with a sea breeze for the whole study period.
(vii) ∑ni (%): percentage of the number of sea breeze spells for each class interval, in reference to the total number of sea breeze spells.
(viii) ∑Pi (%): percentage of the number of days with a sea breeze for each class interval in reference to the total number of days with a sea breeze.
The graphic representation of ∑ni (%) as X (abscissa axis) and ∑Pi (%) as Y (ordinate axis), draws the concentration, or Lorenz, curve, resulting in a notable exponential polygonal curve. This curve values the dependence or relation between the percentage of the number of spells and that of the total number of sea breeze days.
2.3.3 Persistence coefficients: empirical probabilities
The repetitive behaviour of a meteorological condition can be assessed by the use of persistence coefficients (Martín–Vide, 2003). A statistical approach to this working technique requires the handling of conditional probabilities to evaluate the persistent character of certain meteorological variables.
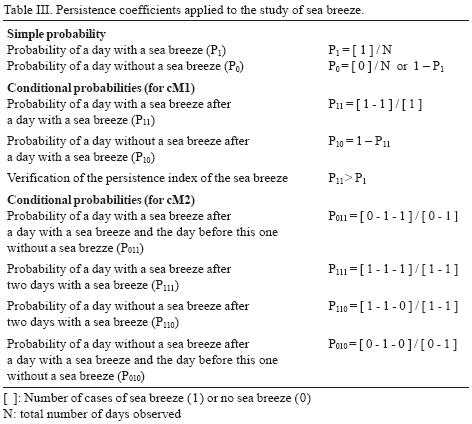
Table III summarizes the statistical calculations or empirical probabilities applied to the study of the inertial tendency to repetition of the days with a sea breeze on the coast.
2.3.4 Markovian chain model: calculated probabilities
The Markovian chain stochastic model was used as a statistical method for calculating the probability of a determined state of a meteorological variable lasting 1, 2, 3... n consecutive days, Pn. The Markovian property is defined as the dependence of the state of a variable at a given moment, with regard to its value during previous days. The hypothesis to be tested is that the temporal behavior of the sea breeze days is an order 1 or 2 Markovian phenomenon: the occurrence of a sea breeze day depends only on the state (sea breeze or not) of the day before, or of the day before and the previous one, respectively. The first–order Markov chain (cM1) considers only the state of the variable of the day before the day studied. A spell of sea breeze with a duration of n days has n sea breeze consecutive days, beginning after a day without a sea breeze and ending with another of identical type (0–1–...(n)...1–0; 1 for seabreeze day and 0 for the opposite). The calculation of the probability of a sea breeze spell lasting exactly n days using the Markovian model requires the chain to end with a day without a sea breeze: 1–... (n)–1–0 (there are n days with a sea breeze plus one final day without a sea breeze: n + 1 day). Consequently, there are n – 1 links of the 1–1 type and one of the 1–0 type. The first–order Markov chain formula applied is:
Pn= P11n–1 • P10 ; Pn= P11n–1 • (1 – P11) or Pn= (1 – P10)n–1 • P10
P11 is the probability of a day with a sea breeze after a day with a sea breeze, and P10 the probability of a day without a sea breeze after a day with a sea breeze.
With the aim of improving the adjustment of the probabilities calculated by cM1, the second –order Markov chain (cM2)–, was formulated to take the character of the two previous days into account, and considered thus:
Pn = P011 • P111n–2• P110 , for n > 2
P1 = P010
When the probabilities of sea breeze spells with a length of 1, 2, 3... n days had been calculated, the first and second–order Markovian chain model was validated. The adjustment(s) was/were verified by the χ2 test, with v – 2 degrees of freedom, once the spells with a frequency less than 5 were grouped, to a significant level α = 0.05 (Martín–Vide and Gómez, 1999).
3. Results
3.1 Application of the spell procedure to the study of the circulation of the sea breeze
3.1.1 Absolute and mean number of sea breeze spells
The greater or lesser number and length of sea breeze spells depend upon three basic factors: (i) the effect of the latitude; (ii) the topographical characteristics, and (iii) the synoptic variability on a daily temporary scale (López–Bustins and Azorín–Molina, 2005). On an annual scale, the total number of spells in Alicante is very balanced as it fluctuates between a maximum of 5 0 for the year 2003 and minimum of 40 for the year 2000, where the quinquennial mean is 43.8 sea breeze spells. To summarize, four stages are differentiated throughout the year, taking into account the numeric distribution of the monthly mean of spells (Fig. 2a):
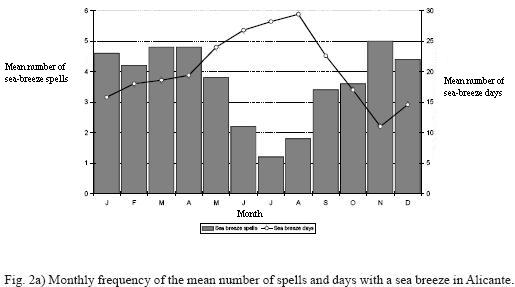
(i) Central summer months: very few sea breeze spells are recorded during the months of June (mean No. spells: 2.2), July (1.2) and August (1.8), which contain a significant number of sea breeze days, depending on the conditions of anticyclone circulation and atmospheric stability (Fig. 5a). These conditions are sometimes far from the trajectory of frontal depressions (Reiter, 1975; Ramis and Alonso, 1988; Ramis et al., 1990; Redaño et al., 1991).
(ii) Central winter months: the mean number of sea breeze spells in winter is almost three times greater than in summer, although there is a slight reduction in the mean number of spells (December 4.4, January 4.6 and February 4.2), compared with those of the preceding months (November) and following months (March and April). The dominance of synoptic westerly winds in winter (Fig. 5d), and the expansion of the circumpolar vortex (Shindell et al., 2001), alternates with the succession of high–pressure blocking situations over the synoptic stage; this creates the calm that triggers the sea breeze on the coast of Alicante (Olcina–Cantos and Azorín–Molina, 2004). For example, anomalies in mean pressure for 1961–1990 of +12 hPa to the west of Ireland in January 2000, and between +4 and 8 hPa in the Iberian peninsula, caused by a long period of anticyclone (Eden, 2000), led to a reduction in the number of spells to only four and an increase in the sea breeze days to 26, i.e. 83.87% of the days in January 2000 (Fig. 5c).
(iii) Transition from winter to spring and from autumn to winter: this corresponds to two stages of the year with variable weather types, where opposite atmospheric situations occur in a very brief time interval of a few days. March (4.8), April (4.8) and November (5.0) are variable, unstable months which combine days of calm with others typical of winter (Font Tullot, 2000). Consequently, the mean number of sea breeze spells in these months is markedly different to the other months of the year.
(iv) Transition from spring to summer and from summer to autumn: the mean number of sea breeze spells for the period of 1999–2003 is between 3.0 and 4.0; with 3.4 in September, 3.6 in October and 3.8 in May. The main characteristic of this final stage is the decrease in the mean number of sea breeze spells from spring to summer; this is due to the greater protagonism of the stable synoptic pattern (Azores anticyclone) and the upward tendency that occurs from the minimum of summer to autumn. This tendency is caused by an increase in the frequency of the unstable atmospheric circulation patterns over Europe and the Iberian Peninsula (westerly components).
There is an inverse correlation between the mean number of spells and the mean number of days with a sea breeze (Fig. 2a): the lower the mean number of spells, the greater the mean number of days with a sea breeze, and vice versa. This inverse correlation is because very few sea breeze spells contain a high number of sea breeze days under stable synoptic conditions (summertime). However, the number of spells is greater when the synoptic patterns are unstable and the sea breeze is not persistent (wintertime).
The values related to the percentage distribution of the sea breeze spells in seasons (Fig. 2b) are more concurrent with the atmospheric reality using the calendar division, WASpSu regime (maximum in winter and minimum in summer), than with the climatic division, SpWASu regime (maximum in spring and minimum in summer). In general terms, the unstable winter and autumn weather types distorts the sea breeze and triggers the number of spells, where the percentages stand as follows: 31.05% in winter (January, February and March), 29.68% in autumn (October, November and December), 24.66% in spring (April, May and June) and 14.61% in summer (July, August and September).

3.1.2 Maximum, minimum and mean length of the sea breeze spells
By valueing the persistence of the sea breeze, interesting data are obtained through calculating the length or maximum and minimum duration in days of the sea breeze spells for the whole period. Figure 3 shows a significant contrast between the four–month period between May and August (June, 52; August, 46; May, 36 and July 17), and the other months of the year (November, 7 days; October, 9; January and March, 12, and February, 13). The large decrease of the maximum length in July does not have a physical explanation: it is due to the application of the method b for grouping days with a sea breeze into spells. The sea breeze has a high level of occurrence and persistence in July (mean number of sea breeze days: 28.2). The estimation of sea breeze spells is a good indicator of the persistence associated to atmospheric stability conditions. Moreover, the length of minimum duration of the spells confirms the high level of inertia to persist of the sea breeze in summer, since in May, July and August, the minimum stands at two, compared with the other months of the year, which stand at one.

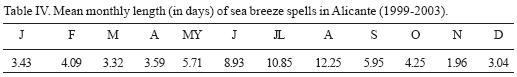
Table IV shows the mean monthly values of the duration of sea breeze spells, and also confirms the permanent status of the sea breeze during the warmer months of the year (June, 8.93 days; July, 10.85 and August, 12.25). This can be compared with the reduced repetitive behavior of this atmospheric phenomenon in winter, especially during November (1.96 days), when there is a dominance of advective situations (Esteban et al., 2006).
3.2 Analysis of the distribution of frequencies according to the length of the sea breeze spells
The distribution of absolute frequencies according to the length of the sea breeze spells in Alicante, in days, for the five–year study period is shown in Figure 4. The main feature of the time structure of the sea breeze spells is the marked tendency to reduce their number from the lower class intervals to those of longer duration. Explained in other terms: we registered a greater absolute number of short sea breeze sequences (1–2: 93 cases, 3–4: 45 cases and 5–6: 29 cases) in comparison with the longer class intervals (15–16: 4 cases, 17–18: 4 cases and 19 and > 20: 10 cases).

The negative–shaped exponential distribution of the number of sea breeze spells by class intervals can be verified by analyzing Figures 6 (a and b). These show a subdivision of the absolute frequency distribution of the spells in two six–month periods (from November to April and May to October), during which the regional atmospheric dynamics on Mediterranean latitudes show different behavior (Olcina–Cantos and Azorín–Molina, 2004): November–April (dominance of north–westerly synoptic winds) and May–October (dominance of sea–breeze winds).
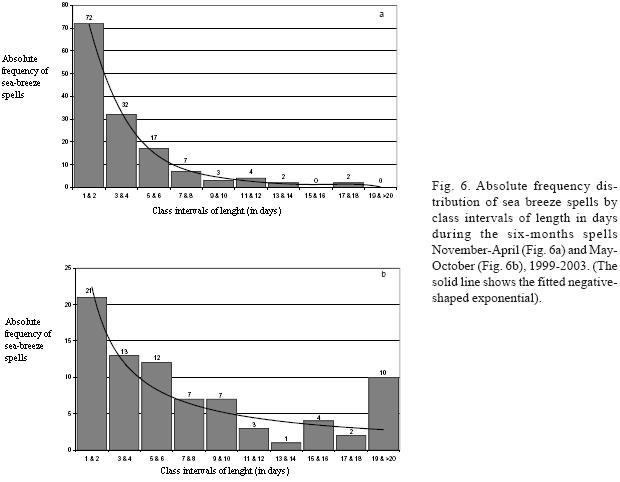
The curve of the fit shows a marked negative exponential behavior for the six–month period from November to April. The dominance of brief sea breeze spells is almost absolute in comparison with the rest: the relative frequency of the sea breeze sequences for the class intervals of 1–2 to 5–6 stands at 87.05% (121 cases). The other classes, with longer spells, are much less significant (7–8: 5.04%; 9–10: 2.16%; 11–12: 2.88%; 13–14: 1.44% and 17–18: 1.44%), and are attributed to situations of anticyclone blocking in the general circulation from the west (Fig. 5c). The frequency distribution for the warm six–month period of the year between May and October does not follow a particularly negative–shaped exponential, as the sea breeze spells last longer. However, the class intervals between 1–2 and 5–6 cover 57.50% of sequences, which correspond to brief spells during May, September and October. The atmospheric stability during June, July and August reduces the negative exponential statistical behavior, as the number of spells is of relative importance in the class intervals of 7–8: 8.75%; 9–10: 8.75%; 11–12: 3.75%; 15–16: 5% and 19 and 20: 12.50%.
Table V offers absolute frequency distribution (ni) and accumulated frequency distribution (∑ni) of the number of sea breeze spells, in 2–day classes, as well as the distribution of absolute frequencies (Pi) and accumulated frequencies (∑Pi) of the days with a sea breeze in Alicante for the five–year period 1999–2003. The total number of sea breeze spells (∑ni) is of 219 sequences and corresponds to the value of the last class interval (51–52), whereas the result obtained for the same class in ∑Pi: of 1230.5, is a very close approximation to the total number of sea breeze days for the study period considered: 1227 days with a sea breeze.

The most interesting interpretation of this table is achieved by calculating the accumulated relative frequencies for the number of sea breeze spells for each class interval, ∑ni (%), and those corresponding to the number of sea breeze days, as indicated in the last column: ∑Pi (%). Therefore, it is understood that for class 1–2, 42.47% of the spells contain 11.34% of the total number of days with a sea breeze in Alicante. This interpretation is identical for the other classes. Furthermore, the distribution of accumulated relative frequencies for both cases gives the graphic representation of its values, using the percentages corresponding to ∑ni (%) for the abscissa, or X, and those of ∑Pi(%) for the ordinate, or Y, which gives the concentration, or Lorenz, curve (Shaw and Wheeler, 1994). This method has been used in other studies to find the daily precipitation concentration (Martín–Vide, 2004).
Figure 7 shows the resulting polygonal curve for the whole year, as a marked positive–shaped exponential. As the whole year graph shows, only 15% of the sea breeze spells between the percentages of 85 and 100% contain just 50% of the days with a sea breeze. Class intervals of 1–2 and 3–4, which represent 63.01% of the spells, contain only 24.14% of the days with a sea breeze (Table V). Figure 8 also compares the polygonal curves of November–April and May–October. The greatest distance of the second polygonal curve from the straight line of equal distribution and from the first, indicates the concentration of the days with a sea breeze in spells during the warm six–month period of the year, compared with the cold period. This concentration, in which only a few spells contain a high number of days with a sea breeze, is shown by calculating the resulting area between the polygonal curve for each six–month period and the straight equal distribution line: the greater the area, the greater the concentration of the days with a sea breeze in spells. The area for May–October, of 52.52%, is greater than that calculated for November–April, which has 40.20%.


3.3 Probabilistic estimation of the degree of persistence of the sea breeze
The degree of persistence of the sea–breeze in Alicante was empirically valued by applying conditional probabilities as coefficients of persistence. The percentage of the days with a sea breeze, or empirical probability (P1), for the five–year periods 1999–2003 stands at 67.20%, i.e. 2.3 of the total number of days in the year the sea breeze blows over the coastal plain of Alicante. This information explains the high occurrence of this weather condition in the atmospheric dynamics of this region. The yearly breakdown shows variations in the percentage value or probability of days with a sea breeze, although they generally fluctuate approximately between 60 and 70%. The probability of days without a sea breeze in Alicante is therefore 32.80%, 1.3 of the days in the year.
Processing conditional probabilities adds precision to the estimation of the degree of persistence of the sea breeze. Consequently, the probability of a day with a sea breeze after a day with a sea breeze (P11) is 82.15% for the entire study period, and 17.85% the probability of days without a sea breeze after a day with a sea breeze. The former value, when compared with the percentage of days with a sea breeze, is used statistically to estimate the persistence of this wind circulation. For the five–year period as a whole, as for each year in consideration, the value of P11 > P1, should be interpreted as the statistical verification of the persistence of the days with a sea breeze on the coastline of Alicante (Table VI).

3.4 Markovian analysis of the spells of days with a sea breeze
The calculated probabilities of the sequences of days with a sea breeze provided by the stochastic model of the Markov chains are very satisfactory when compared with the observed or empirical values for Alicante. The test performed confirms the hypothesis presented in studies that have applied this model to the variable of precipitation: the greater the persistence and duration of the studied variable (Table VI), the worse the results obtained by the one–order Markov chain (cM1) (Gómez, 1996; Martín–Vide and Gómez, 1999). The repetitive characteristic of consecutive days with a sea breeze does not depend exclusively on the previous day, but also on what has happened on previous days. This can be improved with the second–order Markov model (cM2).
Despite the great persistence of the sea breeze in Alicante (P11 > P1) and, in general, on the whole eastern coast of Spain (owing to the synoptic subtropical pattern during summer), the fit through cM1 is acceptable for significance a = 0.05 (Table VIIa) for the whole study period (1999–2003) (χ2 = 19.78 < χ2(0.05,12) = 21.03). However, the experiment with the superior higher order (cM2) improves the quality of the results at the same level of significance (χ2= 17.14 < χ2(0.05,12) = 21.03) (Table VIIb).

The most interesting Markovian analysis studies the adjustments of cM1 and cM2 in the two semesters, with different degrees of persistence in the sea breeze. Theoretically, the greater synoptic variability on a daily temporary scale (López–Bustins and Azorín–Molina, 2005), and the lesser persistence of the sea breeze during the November–April semester should give satisfactory results. On the other hand, the presence of a weak surface pressure gradient in the May–October semester, and the greater persistence of the sea breeze should correspond with a worse fit. These results partially confirm this hypothesis. Using cM1, the fit to a confidence level of 95% is acceptable for the May to October semester (χ2= 12.86 < χ2(0.05,8) = 15.51), but give much better results for November–April (χ2 = 3.89 < χ2 (0.05,6)= 12.59) (Figs. 9a and 9b). cM2 provides a good fit for both semesters, improving the results in the May–October semester (χ2 = 11.71 < χ2(0.05,8)= 15.51) in reference to cM1. To summarize, the application of the orders under the Markov chain generally result in alignment, despite the seasonal factors, and are satisfactory for calculating probabilities of the duration of the sea breeze spells, in the Mediterranean coast of the Iberian peninsula.

4. Conclusions
Several statistical tests were used to estimate the degree of persistence of the sea breeze in Alicante, during the five–year study period 1999–2003. The results show the important status of the persistence of the sea breeze in summer, in favor of synoptic regional conditions of atmospheric stability, which prolong the sequences of the sea breeze to an absolute maximum of 52 consecutive days. However, the weight of the advective situations in certain months, such as March and November, significantly increases the absolute number of spells and reduces persistence.
The Lorenz curves confirm the indicated hypothesis (only a few spells contain a high number of days with a sea breeze), and the concentration that is linked to this phenomenon, as a very reduced number of spells in the year; more specifically, 15% contain 50% of the total number of sea breeze days.
The comparison between the probability of a day with a sea breeze, 67.20% (2.3 of the days in the year), and the probability of a day with a breeze after a day with a breeze, 82.15%, represents the statistical verification of the persistence of this atmospheric phenomenon, since the latter value is greater than the former for the entire five–year period and for each of the years.
The analysis between the probabilities observed and those calculated using the lower Markovian chain models (cM1 and cM2) is satisfactory to estimate the persistence of the sea breeze, with greatest precision in winter, although functional throughout the whole year.
Statistical characterization of atmospheric movements in the lower troposphere –sea breeze and local winds– could be used to assess intra–annual variability in pollution levels. The sea breeze has a decisive role in the transport and dispersion of pollutants released to the atmosphere (Millán, 2002). The statistical methods that have been applied may be used in future studies that attempt to explain the temporal dynamics of pollutants. The high persistence of local winds is the main factor responsible for the problems of air quality in Mediterranean cities, which are subjected to strong pressure from industry and the automobile. The cell formed by the sea breeze and the land breeze leads to dynamic confinement of the air masses in one single place, and to the formation of strata of polluted air (Simpson, 1994).
Acknowledgment
This study was carried out in the framework of the FPU predoctoral grant from the Ministry of Education and Science (MEC), which the corresponding author is completing at the Laboratory of Climatology of the University of Alicante. Part of this research has been undertaken in the frame of the "Grupo de Climatología" (2005SGR–01034, Regional Catalan Goverment). The authors would also like to thank the Conselleria de Territori i Habitatge (Comunidad Valenciana Government) for the use of wind data corresponding to Alicante, owned by the Atmospheric Contamination Control and Monitoring Network.
References
Achberger C., D. Chen and H. Alexandersson, 2006. The surface winds of Sweden during 1999–2000. Int. J. Climatol. 26, 159–178. [ Links ]
Azorín–Molina C., 2004. Estimación de la ocurrencia de la brisa marina en Alicante. In: El Clima, entre el Mar y la Montaña (García Codrón, J. C, Diego Liaño, C., Arróyabe Hernáez, P. F., Garmendia Pedraja, C. and Rasilla Álvarez, D., Eds.). AEC Publications (Asociación Española de Climatología), Santander, 19–29. [ Links ]
Alcoforado M. J., 1987. Brisas estivais do Tejo e do Oceano na regiao de Lisboa. Finisterra, XXII, 43, 71–112. [ Links ]
Alomar Garau G., M. Grimalt Gelabert and M. Laita Ruiz de Asúa, 2004. La percepción geográfica del régimen de brisas en Mallorca. De la experiencia directa a los datos instrumentales. In: El Clima, entre el Mar y la Montaña (García Codrón, J. C. Diego Liaño, C., Arróyabe Hernáez, P. F., Garmendia Pedraja, C. and Rasilla Álvarez, D., Eds.). AEC Publications (Asociación Española de Climatología), Santander, 551–559. [ Links ]
Arteche García J. L., 2001. Caracterización de la brisa marina en Santander. V Simposio Nacional de Predicción, INM, Madrid, 1–6. [ Links ]
Arteche García J. L., M. P. Sanz Moral and F. J. Ortiz Berenguer, 2004. Caracterización de la brisa cantábrica. In: El Clima, entre el Mar y la Montaña (García Codrón, J. C, Diego Liaño, C., Arróyabe Hernáez, P. F., Garmendia Pedraja, C. and Rasilla Álvarez, D., Eds.). AEC Publications (Asociación Española de Climatología), Santander, 195–204. [ Links ]
Banfield C. E., 1991. The frequency and surface characteristics of sea breezes at St. Johns, Newfoundland. Climatol. Bull. 25, 3–20. [ Links ]
Boix A., V. Compan, M. M. Jordan and T. Sanfeliu, 1995. Vectorial model to study the local breeze regimen and its relationship with SO2 and particulate matter concentrations in the urban area of Castellon, Spain. Sci. Total Environ. 172, 1–15. [ Links ]
Borne K., D. Chen and M. Núnez, 1998. A method for finding sea breeze days under stable synoptic conditions and its application to the swedish west coast. Int. J. Climatol. 18, 901–914. [ Links ]
Douguédroit A., 1987. The variations of dry spells in Marseilles from 1865 to 1984. J. Climatology 7, 541–551. [ Links ]
Eden P., 2000. Weather Log. January 2000. Dry, sunny and rather mild. Weather. 55. [ Links ]
Esteban P., J. Martín–Vide and M. Mases, 2004. Daily atmospheric circulation patterns over western Europe. A new approach using PCA and K–means clustering Int. J. Climatol. (submitted). [ Links ]
Font Tullot I., 2000. Climatología de España y Portugal. Ediciones Universidad de Salamanca, Salamanca. 422 pp. [ Links ]
Furberg M., D. G. Steyn and M. Baldi, 2002. The climatology of sea breezes on Sardinia. Int J. Climatol. 22, 917–932. [ Links ]
Gómez Navarro L., 1996. Análisis de las secuencias lluviosas en España mediante el modelo de las cadenas de Markov. In: Ciudad y clima: la gestión de un recurso climático (Marzol M. V., Dorta P., Valladares P. Eds.). Universidad de La Laguna, Tenerife, 271–280. [ Links ]
Gómez Navarro L., 1997. Regionalización climática de la España peninsular mediante el análisis Markoviano de las sequías. Universidad de Barcelona, España. Unpublished Ph. D. Thesis. [ Links ]
González Márquez J., J. A. Guijarro Pastor and A. Jansá Clar, 1998. Caracterización de la brisa en Mallorca. IX Asamblea Hispano Portuguesa de Geodesia y Geofísica. Universidad de Almería/ Instituto Geográfico Nacional, Almería, España, CD–ROM. [ Links ]
Gustavsson T., S. Lindqvist, K Borne and J. Bogren, 1995. A study of sea and land breezes in an archipelago on the west coast of Sweden. Int. J. Climatol. 15, 785–800. [ Links ]
Kottmeier C., P. Palacio–Sese, N. Kalthoff, U. Corsmeier and F. Fiedler, 2000. Sea breezes and coastal jets in southeastern Spain. Int. J. Climatol. 20, 1791–1808. [ Links ]
Lana X. and A. Burgueño, 1998. Daily dry–wet behaviour in Catalonia (NE Spain) from the viewpoint of Markov chains. Int. J. Climatol. 18, 793–815. [ Links ]
López–Bustins J. A. and C. Azorín–Molina, 2005. The Western Mediterranean Oscillation Index (WeMOi): An objective primary filter for finding sea breeze days on the east coast of the Iberian peninsula (Spain). In: 5th EMS Annual Meeting Abstracts EMS05–00141. [ Links ]
Lyons W. A., 1972. The climatology and prediction of the Chicago Lake breeze. J. Appl. Meteorol. 11, 1259–1270. [ Links ]
Martín–Vide J., 1981. Cantidades diarias y análisis markoviano de las precipitaciones en el litoral mediterráneo sur de la Península Ibérica. Paralelo 37, 5, 97–114. [ Links ]
Martín–Vide J. and L. Gómez, 1999. Regionalization of peninsular Spain based on the length of dry spells. Int. J. Climatol. 19, 537–555. [ Links ]
Martín–Vide J., 2003. El tiempo y el clima. Editorial Rubes, Barcelona. 127 p. [ Links ]
Martín–Vide J., 2004. Spatial distribution of a daily precipitation concentration index in peninsular Spain. Int. J. Climatol. 24, 959–971. [ Links ]
Miao J.–F., L. J. M. Kroon, J. Vilà–Guerau de Arellano and A. A. M. Holtslag, 2003. Impacts of topography and land degradation on the sea breeze over eastern Spain. Meteorol. Atmos. Phys. 84, 157–170. [ Links ]
Millán–Muñoz M. 2002. Ozone dynamics in the Mediterranean basin. A collection of scientific papers resulting from the MECAPIP, RECAPMA and SECAP proyects. Air pollution Research Report 78. Centro de Estudios Ambientales del Mediterráneo (CEAM), Valencia, 287 pp. [ Links ]
Millán–Muñoz M., 2003. Contaminación atmosférica en el sur de Europa: Resultados de proyectos europeos. Jornada técnica sobre contaminación atmosférica, Departamento de Medio Ambiente y Ordenación del Territorio, San Sebastián, 1–15. [ Links ]
Olcina Cantos J. and C. Azorín–Molina, 2004. The meteorological importance of sea breezes in the Levant region of Spain. Weather 59, 282–285. [ Links ]
Palomares Calderón M., 1996. Influencia del viento sinóptico y la estabilidad vertical en el desarrollo de la brisa de mar (campañas olímpicas de Barcelona 1991–1992). III Simposio Nacional de Predicción del Instituto Nacional de Meteorología (INM), Ministerio de Medio Ambiente, Madrid, 77–88. [ Links ]
Prezerakos N. G., 1986. Characteristics of the sea breeze in Attica, Greece. Boundary–Layer Meteorol. 36, 245–266. [ Links ]
Prohom Duran M. J., 1998. Principales características de la brisa marina estival en un punto de la costa catalana: Sant Pere Pescador. VIII Coloquio del Grupo de Métodos Cuantitativos de Información Geográfica y Teledetección. AGE, 167–179. [ Links ]
Quereda Sala J., 1987. Les vents sur le cote orientale de l'Espagne. Met–Mar. 136, 29–33. [ Links ]
Quereda Sala J. and E. Montón Chiva, 1994. Los vientos de superficie en el litoral de Castellón. Ediciones de la Caja Rural Credicoop, Castellón. 47 pp. [ Links ]
Quereda Sala J. and E. Montón Chiva, 1998. El escenario atmosférico de los contaminantes sobre el litoral mediterráneo. In: Clima y ambiente urbano en ciudades ibéricas e iberoamericanas (Fernández García F., Galán Gallego E., Cañada Torrecilla R., Coords.). Editorial Parteluz, Madrid. 482–494. [ Links ]
Quereda Sala J., E. Montón Chiva and J. Escrig Barberá 2004. La circulación aérea en el límite de la capa de friccion. In: Historia, Clima y Paisaje. Estudios geográficos en memoria del profesor Antonio López Gómez. Universitat de Valencia, Valencia, 397–410. [ Links ]
Ramis C. and S. Alonso, 1988. Sea breeze convergence line in Mallorca. A satellite observation. Weather, 43, 288–293. [ Links ]
Ramis C., A. Jansá and S. Alonso, 1990. Sea breeze in Mallorca. A numerical study. Meteorol. Atmos. Phys. 42, 249–258. [ Links ]
Ramis C. and R. Romero, 1995. A first numerical simulation of the development and structure of the sea breeze in the island of Mallorca. Ann. Geophys. 13, 981–994. [ Links ]
Raso Nadal J. M., 1982. Probabilidades de transición y distribución estacionaria de los días con y sin precipitación en Palma de Mallorca según el modelo de las cadenas de Markov para dos estados. Tarraco 3, 195–209. [ Links ]
Redaño A., J. Cruz and J. Lorente, 1991. Main features of the sea breeze in Barcelona. Meteorol. Atmos. Phys. 46, 175–179. [ Links ]
Reiter E. R., 1975. Handbook for Forecasters in the Mediterranean. Naval Postgraduate School. Monterey, California, USA., 336 pp. [ Links ]
Romero R. and Ramis C., 1996. A numerical study of the transport and diffusion of coastal pollutants during the breeze cycle in the island of Mallorca. Ann. Geophys. 14, 351–363. [ Links ]
Salvador R., 1990. Base de conocimiento de dispersión atmosférica: Metodología para la determinación de parámetros significativos en la formación de brisa marina en Castellón. Informe CIEMAT, Unidad de Medio Ambiente Convencional del Instituto P. R. Y. M. A., Madrid, 32 pp. [ Links ]
Salvador R., 1999. Análisis y modelización de los procesos atmosféricos durante condiciones de brisa en la costa mediterránea occidental: Zona de Castellón. Universitat Politécnica de Catalunya, Barcelona, Unpublished Ph. D. Thesis. [ Links ]
Salvador R. and M. Millán, 2003. Análisis histórico de las brisas en Castellón. Tethys, 37–51. [ Links ]
Shaw G. and D. Wheeler 1994. Statistical techniques in geographical analysis. John Wiley and Sons, 359 pp. [ Links ]
Shindell D., G. A. Schmidt, R. L. Miller and D. Rind, 2001. Northern Hemisphere winter climate response to greenhouse gas, ozone, solar and volcanic forcings. J. Geophys. Res. D. 106, 7193–7210. [ Links ]
Simpson J. E., 1994. Sea breeze and local wind. Cambridge University Press, Cambridge, 234 pp. [ Links ]
Steyn D. G. and D. A. Faulkner, 1986. The climatology of sea breezes in the lower Fraser Valley. B. C. Climatol. Bull. 20, 21–39. [ Links ]
Vasconcelos J., A. López, R. Salgado and J. Neto 2004. Modelling of the estuarine breeze of Lisbon (Portugal): preliminary results. In: El Clima, entre el Mar y la Montaña (García Codrón, J. C, Diego Liaño, C., Arróyabe Hernáez, P. F., Garmendia Pedraja, C. and Rasilla Álvarez, D., Eds). AEC Publications (Asociación Española de Climatología), Santander, pp.165–171. [ Links ]
Vasconcelos J. and A. Lópes, 2005. A influência da morfología urbana na modificação das brisas do estuário do Tejo na zona oriental de Lisboa. X Coloquio Ibérico de Geografia. Universidade de Évora, Portugal, 1–12. [ Links ]

