


Serviços Personalizados
Journal
Artigo
 Inglês (pdf)
 Artigo em XML
 Referências do artigo
 Enviar este artigo por email
Indicadores
-
 Citado por SciELO
 -
 Acessos
Links relacionados
-
 Similares em
SciELO
Similares em
SciELO
Compartilhar

 Permalink
Atmósfera
versão impressa ISSN 0187-6236
Atmósfera vol.20 no.1 Ciudad de México Jan. 2007
The storm of January 1, 2000, north of the city of Mendoza
S. C. SIMONELLI, F. A. NORTE, N. O. HEREDIA
Programa Regional de Meteorología, Instituto Argentino de Nivología, Glaciología y Ciencias
Ambientales (IANIGLA), Consejo Nacional de Investigaciones Científicas y Tecnológicas
de Argentina (CONICET ), Mendoza, Argentina
Corresponding author: S. C. Simonelli; e–mail: scs@prmarg.org
M. SELUCHI
Centro de Previsao do Tempo e Estudos Climaticos (CPTEC), Sao Paulo 12630–000, Brasil
Received November 25, 2004; accepted April 18, 2006
RESUMEN
El objetivo del trabajo es estudiar las condiciones observadas antes y durante el desarrollo de la tormenta convectiva registrada en las últimas horas del 1 de enero de 2000, que afectó un área ubicada al norte de la ciudad de Mendoza, incluyendo su Aeropuerto Internacional. Se pretende también determinar el comportamiento de las variables dinámicas y termodinámicas que funcionaron como gatillo para este caso de convección severa. Para el período comprendido entre el 30 de diciembre de 1999 y el 2 de enero de 2000 se analizaron los datos horarios de superficie y los radiosondeos diarios de la Estación Meteorológica Mendoza Aero, identificada como SAME. El estudio de la situación meteorológica de superficie y altura a escala sinóptica se realizó a través de los reanálisis del National Center for Environmental Prediction y el National Center for Atmospheric Research (NCEP/NCAR), Estados Unidos, y de los realizados en el Centro de Previsao de Tempo e Estudos Climaticos (CPTEC), Brasil. La información de la precipitación en mesoescala se obtuvo de la mesored del Instituto Nacional del Agua (INA) Argentina. La cantidad de precipitación caída en SAME durante una hora fue de 66.1 mm superando los récord históricos diarios y horarios. El análisis a escala sinóptica muestra que en la región se registraba una intensa advección de aire cálido y húmedo en superficie, proveniente del noreste del país, mientras que en altura avanzaba un eje de vaguada de onda corta desde el Océano Pacífico. Si bien la hodógrafa del viento muestra características semejantes a las de tormentas débiles aisladas, la intensidad de la misma fue incrementada por el gatillo dinámico representado por la vaguada. A pesar que el fenómeno no difiere de las tormentas usuales de la región con respecto a la duración y la hora en que se producen, tuvo sin embargo, características extraordinarias en lo que se refiere a la intensidad de la precipitación sobrepasando los valores diarios históricos de SAME. Es necesario incrementar las investigaciones sobre los procesos físicos de las tormentas y su climatología, para una mayor identificación y predicción, y para entender los mecanismos que conducen a la producción de precipitaciones intensas.
ABSTRACT
The objective of this paper is the study of the conditions observed before and during the development of the convective storm recorded the last hours of January 1, 2000, that affected an area located north of the city of Mendoza, including the International Airport. The work also attempts to determine the behavior of the dynamic and thermodynamic variables that triggered off this case of severe convection. The hourly surface data and daily radiosoundings of Meteorological Station Mendoza Aero, identified as SAME, were analyzed for the period December 30, 1999 to January 2, 2000. The synoptic scale analysis was done with information of National Center for Enviromental Prediction and National Center for Atmospheric Research (NCEP/NCAR), USA, and the results from Centro de Previsao de Tempo e Estudos Climaticos (CPTEC), Brazil. Mesoscale precipitation information was obtained from Instituto Nacional del Agua (INA) network, Argentina. During one hour of the storm the record in SAME was 66.1 mm, surpassing the historical daily and hourly maximum. Principal results shows that there was an intense advection of warm and humid air on the surface, proceeding from the northeast of the country, while a short wave trough axis came from the Pacific Ocean. Nevertheless wind hodograph showed similar characteristics like a weak isolated storm, the intensity was enhancement by a dynamic trigger represented by the trough. Even though the phenomenon did not differ from the usual storms with respect to the time of occurrence and duration, it had extraordinary features in regards to the precipitation intensity, that surpassed the historical daily values at the SAME. It is necessary to improve research about physical mechanisms of the storms and its climatology for better indentification and predictions, and also to understand the mechanisms that led to the production of intense precipitation.
Keywords: Convective storm, western central Argentina, extreme precipitation.
1. Introduction
Geographically Mendoza province belongs to the mid west of Argentine Republic, it is located leeward of Andes Cordillera and from north to south between 32° S and 37° 05' S, and from west to east between 66° 05' W and 70° W (Fig. 1).
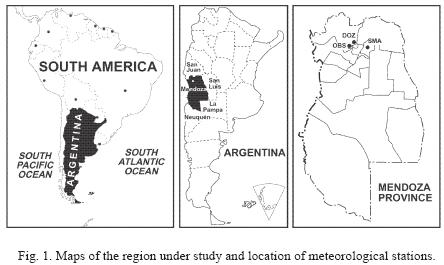
At these latitudes the mean height of the Cordillera is of 4500 meters above sea level (masl), and it is conformed by three mountain ranges, named from west to east Cordillera del Límite, which maximum heights oscillate between 6000 and 7000 masl, Cordillera Frontal with up to 5500 masl and Precordillera with height 3000 masl. The city of Mendoza is at the foot–range of Precordillera; SAME is 10 km northeast of the city close to the International Airport.
The northern zone of the province of Mendoza is unique in regards to the initiation, development and evolution of convection, given its location leeward of the Andes Cordillera, that modifies the air flow in a very complex manner affecting the westerly air flow throughout its vertical extension.
The climatic characterization of Mendoza province (Norte, 1995), based on Köppen's classification (1948) shows that, exception made of the cordilleran region, most of the province is under the climatic zone type B (dry climate) and the Bwakw climatic type, identifying the variety of the desertic climatic type with the mean temperature of the hottest month higher than 22 °C (a), cold and dry in the winter, with annual mean temperature lower than 18 °C (k and w).
Precipitation over central Andes in South America exhibits a marked annual cycle with most of the rainfall concentrated during the austral summer season (December–February), when the atmospheric circulation favors the lifting of moist air from the lowlands to the east of the mountain range (Garreaud, 1999).
The storms developing during that period may provoke severe weather phenomena such as: intense rainfall, hail and wind gusts occasioning damage in cultivated as well as in populated zones, representing a considerable economic and social hazard. The occurrence of these storms is usually associated to synoptic situations such as: frontal passages, western border of squall lines, instability of the surface air mass, and/or a trough in the atmosphere middle levels (Nicolini and Norte, 1978; Norte, 1980). Storms occur more frequently between 18:00 UTC and 06:00 UTC of the following day (Grandoso, 1966; Saluzzi, 1983), considering a 24 hour period measured from 12:00 UTC of each day.
Weisman and Klemp (1986) studied the characteristics of isolated convective storms through the observed type of convective storms (single cell, multicell and supercell); the physical mechanisim controlling growth and evolution (thermodinamical structure, vertical wind shear), and some application to forecasting convective storm and severity.
The forecast of convection and the processes that trigger it have been studied from different scales and applying different methodologies in Argentina. The use of meteorological radar (Grandoso and Iribane, 1963, 1965), (Grandoso et al., 1965), (Grandoso et al., 1966a, b); the use of satellite images (Velasco, 1994), the effect of the vertical shear (Nicolini, 1987a, b) and, the surface and height synoptic information (Lichtenstein and Schwarzkopf, 1970a, b) allowed to widen the knowledge about the origin and development processes of the severe convective activity.
The behavior of storms in relation to their displacement velocity were likewise studied (Nicolini, 1980) as well as their severity (Nicolini and Norte, 1978, 1979), and certain characteristics of its cloud microphysics such as the particularities of the generated hail (Nicolini and Norte, 1980) and their potential damages (Schwarzkopf, 1989). The numerical simulation of situations associated to convective events, with regional models as well as with cloud models were a significant advance (Nicolini et al., 1997). Based on Hirsch (1971), Ghidella and Saluzzi (1979, 1980) obtained a new version model adapted to the region and used for the National Program of Fight Against Hail in Mendoza province.
Simonelli (2000) developed a statistical model to forecast the occurrence of convection for the northern zone of Mendoza province, using the methodology of Step Discriminant Analysis (SDA) based on the statistical models for the forecast of different regional meteorological phenomena in Mendoza province (Norte, 1988; Norte and Silva, 1990; Norte et al., 1991; Selucchi and Norte, 1994).
The discriminant analysis (DA) uses the values of predictors to distinguish the different categories of the predictand to optimize the differentiation of categories. Once the discriminant functions have been determined, a second stage will make it possible to obtain probability frequency functions for each one of the predictand categories.
SDA proceed from DA method elaborating a discriminant model "step by step", analyzing all the variables in each step and assessing which contributes better to the discrimination between categories. This variable is included in, and the model continues on with the analysis of the remaining variables.
Fawbush and Miller Index (FMI) resulted the best predictor to forecast the occurrence of convection, inferring that the existence of a layer close to the surface with relative humidity above 65% strongly conditions the convection development in the zone, thus being an important forecasting parameter. This humid layer in the area could result from the advection of humid air from the southeast or northeast sectors. This humid air advection could be caused by the intensification of Northwestern Argentinian Low (NAL) (Lichtenstein, 1980) or by the displacement toward the south of a warm front located at the northeast of Argentina.
Other instability indexes selected by SDA, with a lower statistical significance were Lifted (LI) and Total–Total (TT) instability indexes, indicating again the significance of humidity in the lower layers reinforced by the effects of diurnal heating in LI, as well as that for height cooling in TT.
The goal of this work is the study of the conditions observed before and during the development of a convective storm recorded on January 1, 2000, that started at about 22:45 UTC, reaching its maximum at 23:20 UTC, and that affected an area located north and northeast of the city of Mendoza, including the International Airport. The work also attempts to determine the behavior of the dynamic and thermodynamic variables that triggered the severe convection, and the singularities of this event in comparison with the general characteristics of the storms in the area.
2. Data and methodology
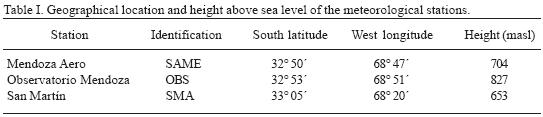
The meteorological information of the hourly surface data and the daily radiosoundings (12:00 UTC) were obtained for the period between December 30, 1999 and January 2, 2000. All the information was from SAME, part of the Servicio Meteorológico Nacional (SMN) (National Weather Service) of Argentina. The surface meteorological information was taken from the meteorological stations shown in Table I.
Mesoscale precipitation information was obtained from Instituto Nacional del Agua (INA) network, located at foot–hills near to Mendoza city.
The climatological aspects of January's precipitation were considered using the SMN meteorological statistics of 1981/90 and 1991/2000 decades from SAME, OBS and SMA. The re–analysis done by National Center for Environmental prediction and National Center for Atmospheric Research (NCEP/NCAR) (Kalnay et al., 1996) and the analysis done by Centro de Previsao de Tempo e Estudos Climaticos (CPTEC) from the period between December 30, 1999, at 18 UTC and January 2, 2000 at 12 UTC, were used to:
• Characterize the circulation at synoptic scale, the dynamic and thermodynamic structure of the troposphere with geopotential heights of 925, 850, 700 and 500 hPa levels;
• Determine the necessary thermodynamic conditions for the convective development with omega vertical fields of speed (pascal/s) and of specific humidity (q) (kg/kg) for 925, 850 and 700 hPa levels.
• Observe the evolution of equivalent potential temperature (EPT) spatial distribution (°K), of precipitable water (kg/m2) and of LI (°K) at surface.
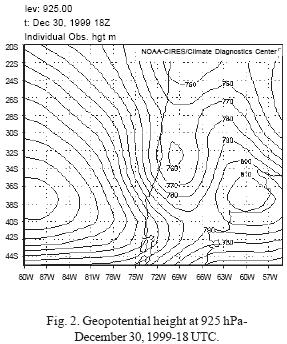
The 925 hPa level was selected as was the most representative of the surface level for the zone under study.
3. Results
The synoptic situation during previous days of the event showed a persistent and intense warm and humid air advection at lower levels in Mendoza region, coming from the northeast of the country.
The high values of dew point temperature at surface, between 17 °C and 19 °C, telltale this situation, as well as the dew point depression at 850 hPa; all these were above the normal values for the season and are characteristic of a tropical air mass. A weak circulation from the east –southeast sector was also observed, associated with the southward displacement of the NAL.
The storm produced large amount of precipitation, but it was not all rain because hail was registered but not close to SAME. The newspapers reported hail at 40 km to the east of SAME, and also said that some trees and electrical wires fell because of the severe storm.
3.1. Synoptic and thermodinamic analysis
3.1.1 December 30 – 18 UTC
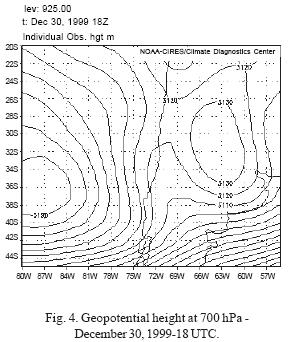
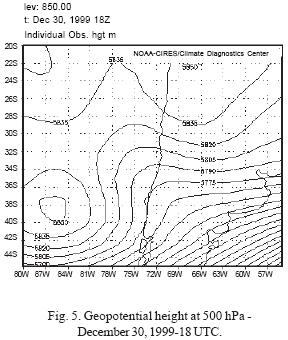
Warm and humid air advection was observed at low levels determined by the presence, at 925 hPa (Fig. 2) and at 850 hPa (Fig. 3), of a high pressure system centered approximately over 37° S 60° W, and by the displacement of the NAL toward the south, with respect to its climatological mean position. A similar synoptic structure was observed at 700 hPa (Fig. 4), with the anticyclone centered over 31° S 61° W. At 500 hPa (Fig. 5), a trough axis with northwest–southeast orientation advanced over the zone under study.
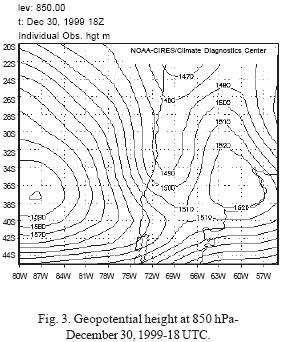
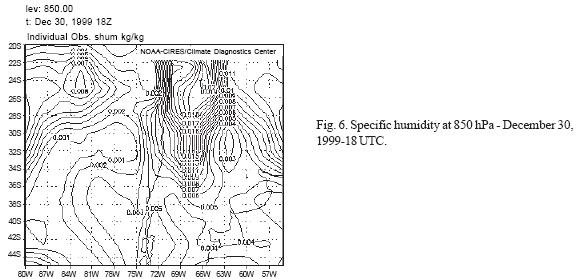
The q field at 850 hPa (Fig. 6) showed a humidity inj ection in north–south direction, bordering the oriental slope of the Andes Cordillera and reaching 38° S approximately, a similar configuration (not shown) was observed at 925 hPa and 700 hPa. The EPT at the surface presented a maximum value of 310 °K, the amount of precipitable water reached 20 kg/m2 and the LI index a value of–4 °K over the affected zone.
3.1.2 December 31 – 18 UTC
The high pressure system at surface was displaced toward the north, centering at 34° S and 60° W, contributing to the intensification of the warm and humid air advection at the lower layers. The humidity injection persisted, with the same configuration of the previous day, at 925 hPa and 850 hPa (not shown). At 500 hPa the front part of the trough begun affecting the region (Fig. 7) and the omega field at 700 hPa presented a maximum of ascending speed of–0.175 hPa/s (not shown). The configuration and the values of EPT, precipitable water and LI on surface were similar to that of December 30, 18 UTC (not shown).
3.1.3 January 1 – 00 UTC
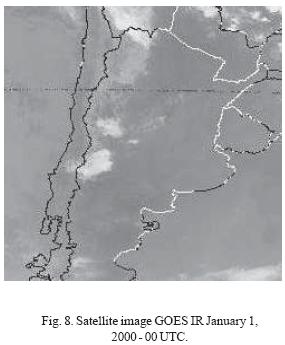
The infrared image of GOES satellite from January 1 at 00 UTC is shown (Fig. 8), where isolated convective activity can be observed in the northern Mendoza province. Although it is possible to observe a larger organization in the southern zone, this activity is not associated to any system at synoptic scale (front) or at mesoscale (squall lines).
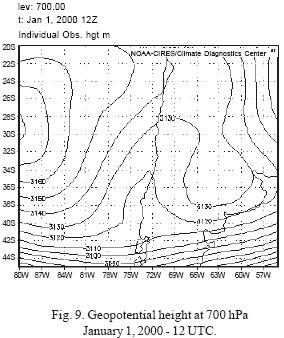
3.1.4 January 1 – 12 UTC
Warm and humid air advection remained at levels very close to surface. At 700 hPa (Fig. 9) and 500 hPa (Fig. 10) the influence of the trough prevailed in the area, with its axis leaning to the east, with 500 hPa structure advanced with regard to 700 hPa due to the modification that Andes Cordillera produces on the westerly flow.
The q and EPT fields at surface kept their configuration, but precipitable water values and LI index diminished, this last one showing positive values.
SAME sounding of December 31 at 12 UTC (Fig. 11) shows a null dew point depression at middle levels (700 hPA) and a convective available potential energy (CAPE) of 22.43 J/kg.

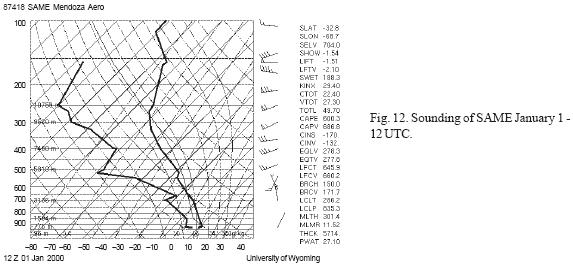
In January 1 at 12 UTC (Fig. 12) the sounding show a more unstable vertical profile but with less humidity at middle levels, and it is remarkable the increasing CAPE value, reaching 600.3 J/kg.
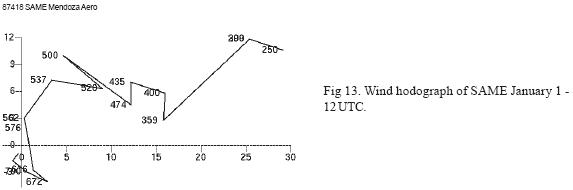
Wind hodograph (Fig. 13) shows similar characteristics to Class I (Weisman and Clemp, 1986) that is like average wind hodographs for weak isolated storms.
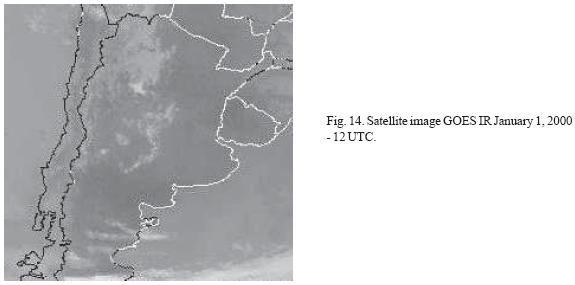
GOES IR satellite image at 12 UTC (Fig. 14) shows no convective developments neither surface nor upper–level synoptic systems that can favour convection at this time. In spite of this, the forecast statistical model for convection (Simonelli, 2000), that indentifies the FM index as the best predictor and that was initialized with data from 12 UTC, corresponding to the surface pressure field and the radiosoundings from SAME and Quintero (Chile), forecasted the occurrence of convection with percentages higher than 90%.
3.1.5 January 1 – 18 UTC:
The more relevant characteristics of the synoptic conditions were the intensification of the zonal horizontal gradient between Andes Cordillera and Río de la Plata and the presence of a warm tongue bordering the oriental slopes of Precordillera and Andes Cordillera, reaching its maximum value at 850 hPa around 40° S 68° W (Fig. 15a).
The trough axis remained at 500 hPa (Fig. 15b) with a northeast–southwest orientation and a short wave trough was observed over Andes Cordillera. The omega field at 700 hPa (Fig. 15c) shows that the region affected by the storm is in the area under the highest values. At 850 hPa the q field indicated a maximum closed nucleus located above the zone of occurrence of the severe storm (Fig. 15d). These conditions could have favored the forced ascent over the Precordillera slope, with the orography bringing a significant contribution to the initiation and development of the convection.
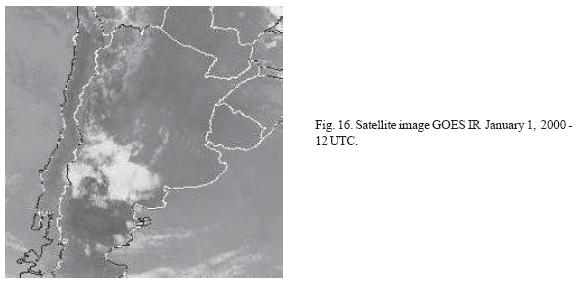
3.1.6 January 1 – 21 UTC
As observed in the GOES IR satellite image (Fig. 16), convective developments were found in the northern zone of Mendoza province and some cells had moved toward the south and southeast. This configuration corresponds, among other causes, to the high humidity concentrations in the lower layers and to the steering current at 500 hPa in the vertical of the studied zone. The storm began around 22:45 UTC, reaching its maximum approximately at 23:20 UTC, with very intense rainfall. The record measured at SAME until January 2 at 00 UTC was 55.8 mm.
3.1.7 January 2 – 00 UTC
No significant changes were observed in similar fields analyzed for January 1 at 18 UTC. The geopotential zonal horizontal gradient remained at 850 hPa between Andes Cordillera and Río de la Plata, as well as the presence of a warm tongue (Fig. 17a). The trough axis had a northeast–southwest orientation and the short wave trough remained at 500 hPa (Fig. 17b). Omega field at 700 hPa, even though similar, showed a weak intensification (Fig. 17c) and of the q field at 850 hPa (Fig. 17d) the configuration was maintained with a slight decrease of values.
January 2 – 06 UTC
The convective activity ended at this time having produced 66.1 mm.
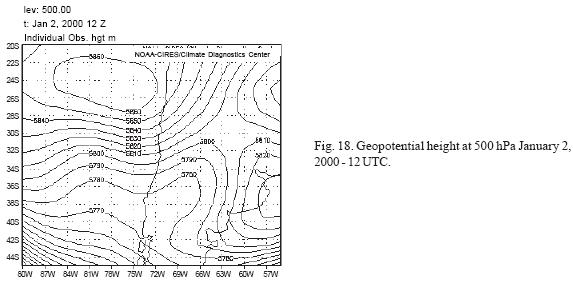
January 2 – 12 UTC
Identical synoptic structure continued with marked decrease of the zonal horizontal gradient in the lower layers. The omega field was positive at all levels (descending motions) indicating stability. The most relevant aspect was the disappearance of the short wave trough at 500 hPa, replaced by a ridge axis (Fig. 18).
3.2 Cross sections of equivalent potential temperature and meridional component of wind
Cross sections of (Fig. 19) EPT (shaded) and wind meridional componet (V) were analyzed for December 31 January 1 (figures not shown) and January 2 at 00 UTC (the highest black bars belongs to Andes Cordillera profile at 32° S latitude).
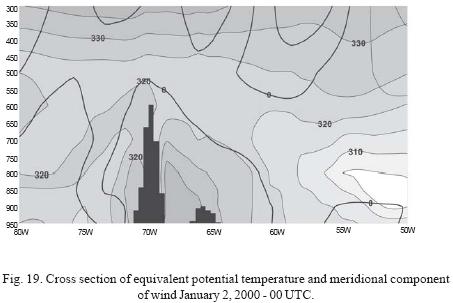
In general there is a north wind channel very close to the Andes and a thermodynamic instability zone between 750 hPa and 400 hPa. There are no changes during the analyzed period, but instability is stronger on January 2. The delay of start of severe convection could be occured by stability conditions between December 31 and January 1. There is small cooling and drying between surface and 540 hPa level, and a small warming near 500 hPa level, besides there are no changes in the wind.
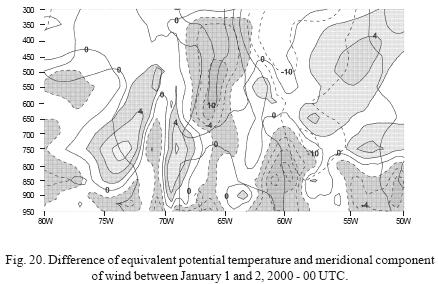
Fig. 20 shows the diference among January 1 and January 2 of the same parameters. The EPT values are higher in low levels and smaller in middle and high levels. There is a notorius change in V values at high troposphere because of the trough.
3.3. Temporal variability of temperature, dew point temperature, atmospheric pressure, speed and direction of wind
The daily temperature, dew point and atmospheric pressure station in SAME between December 30 at 00 UTC and January 2 at 23 UTC are shown in Figure 21.
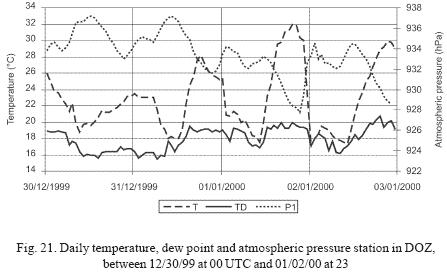
During this period the temperature oscillated between 17 and 32 °C, representing a mean temperature of 24.5 °C. The dew point temperature remained above 15.5 °C, reaching a maximum of 20 °C, surpassing the mean values, but not the extreme ones recorded for the 1981/1990 period. The atmospheric pressure at station level remained between 927.8 hPa and 937.2 hPa, not going beyond the extreme values. This evolution clearly shows that during the analyzed period there was no record of a frontal system passing over Mendoza, and that the moment of highest convective activity (last hours of January 1) coincided with the maximum temperature and dew point temperature, and, minimum pressure at the station level.
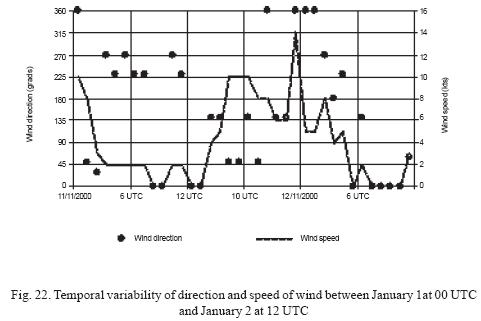
Figure 22 shows the temporal variability of speed and direction of wind between January 1 at 00 UTC and January 2 at 12 UTC, the higher winds reported were north direction with 14 kts at 23 UTC when the storm was affecting the area. It is possible that the downdraft from cumulonimbus clouds caused damages, mentioned in local newspapers, in areas without meteorological data.
3.4 Some aspects of January precipitation
The statistical data corresponding to the monthly mean, the maximum mean and the daily maximum precipitation during the 1981/1990 period for SAME, OBS and SMA are shown in Table II.
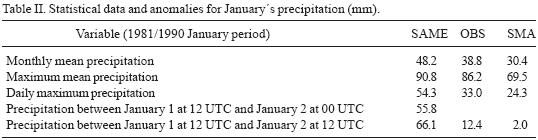
During one hour of the storm the record in SAME was 66.1 mm, surpassing the historical daily and hourly maximum. In OBS the record was 12.4 mm and in SMA only 2.0 mm.
In Figure 23 are compared the record during the storm with the monthly mean precipitation, the monthly mean maximum precipitation and the daily maximum precipitation for December and January for the 1981/1990 period.
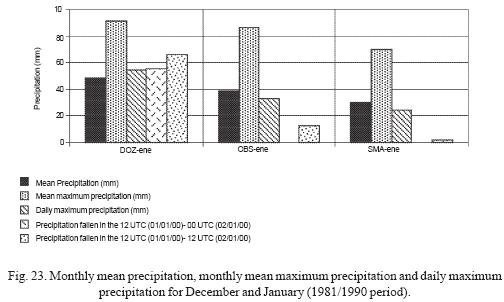
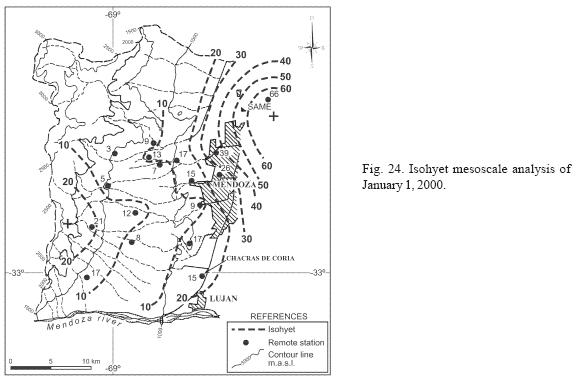
Figure 24 shows the isohyet mesoscale analysis; with this map and newspapers information we can infer that the maximum precipitation were registered in an area located southeast from SAME.
4. Concluding remarks
The factors contributing to the development of the storm were the high thermodynamic instability of the air mass (high temperature and humidity values, and instability indexes with critical values) resulting from the intense and persistent warm advection provoked by the intensification and displacement of the south of NAL and the establishment of an anticyclone east of Mendoza.
The mechanism triggering the initiation of convection was the passage of a short wave trough in the atmosphere middle levels. The modification that Andes Cordillera gives to the air flow determined a seemingly anomalous advance of the trough axis at 500 hPa with respect to its position at 700 hPa.
The FM instability index identified by SDA as a first group of predictor variables functioned clearly in the probability occurrence of this storm.
There is not a climatology of the storms in the area, but we can infer that the severe storm of January 1, 2000 had some characteristics of the group named ''air mass storm'', and it was not associated neither to the passage of a cold front nor to the advance of a squall line. This is a very interesting feature considering that the studied region is close to mid–latitudes where convective events are generally associated to major scale forcing.
The trough passage in high levels provoked a temperature descent increasing thermodynamic instability and upstreams on the higher levels.
The high pressure system during previous days made possible warm and humid advection and also inhibit upwards movements, increasing CAPE values.
Nevertheless, wind hodograph shows the characteristics of a weak isolated storm, the intensity was enhancement by a dynamic trigger represented by the trough.
Even though the phenomenon does not differ from the usual storms with respect to the time of occurrence and duration, it had extraordinary features in regards to precipitation intensity, that surpassed the historical daily values at SAME.
The storm intensity produced troubles such as the interruption of electricity, tree branches fallen because of the rain (no strong wind gusts were observed), overflowing of irrigation ditches, collapsing of precarious dwellings, not only on the city but also in the suburban sectors of nearby districts.
5. Recommendations
It is possible now to predict in the area the initiation of similar convection using tools like the ''Statistical model for convection prediction for the northern zone of Mendoza province'' (see references) and the Regional ETA model recently adapted from CPTEC Brazil.
It is necessary to improve research to about the physical mechanism of the storms and its climatology for better indentification and predictions, and also to understand the mechanisms that led to the production of intense precipitation.
Acknowledgements
To Rafael Bottero for making, ordering and setting ready the graphic material. To Julio Cristaldo for searching the appropriated meteorological material. To María Elena Soler for translating into English.
References
Garreaud R. D., 1999. Multiscale analysis of the summertime precipitation over the Central Andes. Mon. Wea. Rev. 127, 901–921. [ Links ]
Ghidella de Hurtis, M. and M. E. Saluzzi, 1979. Estudio de un modelo numérico de nube convectiva. Geoacta 10, 111–112. [ Links ]
Ghidella de Hurtis, M. and M. E. Saluzzi. 1980. Estudio de un modelo parametrizado de nube convectiva a través de su aplicación a casos reales de convección severa. Comisión Nacional de Investigaciones Espaciales – Programa Nacional de Lucha Antigranizo. [ Links ]
Grandoso H. and J. Iribarne, 1963. Experiencia de modificación artificial de granizadas en Mendoza. Temporadas 1959–60, 1960–61 y 1961–62. Fascículo 3, Informes. [ Links ]
Grandoso H. and J. Iribarne, 1965. Experiencia de modificación artificial de granizadas en Mendoza. Temporadas 1962–63, 1963–64 e Informe Final. Cinco Temporadas. Serie Meteorología 1, 5. [ Links ]
Grandoso H., J. Iribarne and J. M Nuñez, 1965. Estudio de los campos de flujo y de temperatura de la capa inferior de la atmósfera en la provincia de Mendoza. Serie Meteorología 1, 6. [ Links ]
Hirsch J. H., 1971. Computer modeling of cumulus clouds during projet Cloud Catcher. Report 71–1, South Dakota School of Mines and Technology. [ Links ]
Grandoso H. N., 1966. Distribución temporal y geográfica del granizo en la provincia de Mendoza y su relación con algunos parámetros meteorológicos. Serie Meteorología 1, 7. [ Links ]
Grandoso H. N., I. Zawadski and A. Sielecki, 1966a. Influencia del viento en altura sobre el desarrollo de tormentas. Serie Meteorología, 1, 8. [ Links ]
Grandoso H. N., I. Zawadski and A. Sielecki 1966b. Mesosanálisis de tres tormentas típicas en Mendoza. Serie Meteorología 1, 9. Universidad de Buenos Aires. Facultad de Ciencias Exactas y Naturales Contribuciones Científicas. [ Links ]
Kalnay E., M. Kanamitsu, R. Kistler, W. Collins, L. Deaven, L. Gandin, M. Iredell, S. Saha, J. Woolen, Y. Zhu, M. Chelliah, W. Ebizuzaki, W. Higgins, J. Janowiak, K. Mo, Ch. Ropelewski, J. Wang, A. Leetmaa, R. Reynolds, J. Roy and J. Dennis, 1996. The NCEP/NCAR 40–year reanalysis Project. Bulletin of the American Meteorological Society 77, 437–472. [ Links ]
Köppen W., 1948. Climatología, con un estudio de los climas de la tierra. Fondo de Cultura Económica. México – Buenos Aires. 460 p. [ Links ]
Lichtenstein E. R., 1980. La Depresión del Noroeste Argentino – Tesis Doctoral. Facultad de Ciencias. Exactas y Naturales, Universidad de Buenos Aires. 130 p. [ Links ]
Lichtenstein E. R. and M. L. A. Schwarzkopf, 1970a. Aspectos estadísticos de las líneas de inestabilidad en la Argentina. Meteorológica, 1, 3–12. [ Links ]
Lichtenstein E. R and M. L. A Schwarzkopf, 1970b. Condiciones meteorológicas asociadas a la ocurrencia de líneas de inestabilidad. Meteorológica, 1, 79–89. [ Links ]
Nicolini M. and F. Norte, 1978. Análisis en tiempo diferido de las situaciones sinópticas correspondientes a los días de tormenta convectiva en la Provincia de Mendoza. Informe de la temporada granicera 1976–77, 26–43. [ Links ]
Nicolini M., 1980. Aplicación y comparación de distintos métodos para estimar la velocidad de desplazamiento de tormentas convectivas en Mendoza. Comisión Nacional de Investigaciones Espaciales. [ Links ]
Nicolini M., 1987a. Efecto de una cortante vertical constante del viento en la convección "no profunda". Parte I: Descripción del modelo y discusión de la dinámica de las soluciones numéricas. Geoacta 14, 1–14. [ Links ]
Nicolini M., 1987b. Efecto de una cortante vertical constante del viento en la convección "no profunda". Parte II: Desarrollo de las ecuaciones energéticas y discusión de la evolución energética de la convección. Geoacta 14, 15–26. [ Links ]
Nicolini M. and F. Norte, 1978. Análisis en tiempo diferido de las situaciones sinópticas correspondientes a los días de tormenta convectiva en la provincia de Mendoza. Informe de la temporada granicera 1976–77, 26–43. [ Links ]
Nicolini M. and F. Norte, 1979. Estudio del comportamiento de algunas tormentas convectivas (Mendoza). Geoacta 10, 205–220. [ Links ]
Nicolini M. and F. Norte, 1980. Characteristics of Mendoza hailstorms and their environment. Proceding of the III° WMO Scientific Conference on Weather Modification – Clermont Ferrand – Francia, 641–648. [ Links ]
Nicolini M., C. Saulo, M. Torres Brizuela and J. C. Torres, 1997. Simulation and prediction of mesoscale precipitating systems at CIMA. World Meteorological Organization – CAS/JSC Working group on numerical experimentation. Research activities in atmospheric and oceanic modelling. Report N° 25 WMO/TD–N° 792, 5.25–5.26 p. [ Links ]
Norte F., 1980. Clasificación sinóptica de las tormentas convectivas y su relación con las tareas operativas en el área de defensa. Informe de las primeras experiencias de ajuste de defensa. Temporada granicera 1978–1979. Tomo 2 Pag. 51–95. Programa Nacional de Lucha Antigranizo. Comisión Nacional de Investigaciones Espaciales. [ Links ]
Norte F., 1988. Características del viento zonda en la región de Cuyo. Tesis de doctorado. Universidad de Buenos Aires. 220 p. [ Links ]
Norte F. and M. O. Silva, 1990. Métodos objetivos de predicción de heladas en Mendoza. Parte I: Aplicados al oasis de San Rafael con solo información de superficie. XVI Reunión Científica de la AAGG, Bahía Blanca. Resúmenes 88. [ Links ]
Norte F., M. O Silva and J. Cristaldo, 1991. Métodos Objetivos de predicción de heladas en Mendoza. Parte II: Aplicados a tres oasis distintos, incluyendo información de la estructura vertical de la atmósfera. Anales Congremet VI, 43–44 p. [ Links ]
Norte F., 1995. Condiciones meteorológicas favorables a la contaminación atmosférica en Mendoza. Mendoza Ambiental, Instituto Argentino de Investigación en Zonas Áridas (IADIZA), Centro Regional de Investigaciones Científicas y Técnicas (CRICYT), Consejo Nacional de Investigaciones Científicas y Tecnológicas de Argentina (CONICET), Ministerio de Medio Ambiente Urbanismo y Vivienda, 197–206. [ Links ]
Saluzzi M. E., 1980. Conditions of ocurrence of severe convective storms lewards of the Andes in Mendoza. National Commission on Space Research, Bs. As., Argentina. Sec. III, 4.16, 515–517. [ Links ]
Saluzzi M. E., 1983. Aspectos físicos de la convección severa en Mendoza – Tesis de Doctorado –Universidad de Buenos Aires, 115 p. [ Links ]
Schwarzkopf M. L. A., 1989. Climatología de los efectos de la convección severa en la Argentina. Tesis de Doctorado – Universidad de Buenos Aires. [ Links ]
Seluchi M. and F. Norte, 1994. Métodos objetivos de predicción de heladas en Mendoza. Parte III: Heladas tardías en San Rafael, incluyendo información de la estructura vertical y horizontal de la atmósfera. Meteorológica 19, 13–21. [ Links ]
Simonelli S., 2000. Modelo estadístico de pronóstico de convección para la zona norte de la Provincia de Mendoza. Tesis de Doctorado – Universidad de Buenos Aires. 158 p. [ Links ]
Velasco I., 1994. Complejos convectivos de mesoescala en Sud–América. Tesis de Doctorado. Universidad de Buenos Aires. 102 p. [ Links ]
Weisman M. L. and J. B. Klemp, 1986. Characteristics of isolated convective storm. Chapter 15, Mesoscale Meteorology and Forecasting (Peters S. Ray Eds.), American Meteorological Society, 331–358. [ Links ]

