


Services on Demand
Journal
Article
 English (pdf)
 Article in xml format
 Article references
 Send this article by e-mail
Indicators
-
 Cited by SciELO
 -
 Access statistics
Related links
-
 Similars in
SciELO
Similars in
SciELO
Share

 Permalink
Atmósfera
Print version ISSN 0187-6236
Atmósfera vol.19 n.3 Ciudad de México Jul. 2006
Spatial influence and oceanic thermal response to Santa Ana events
along the Baja California Peninsula
R. CASTRO
Facultad de Ciencias Marinas, Universidad Autónoma de Baja California,
Ensenada, Baja California, C. P. 22800 México
Corresponding autor e–mail: rubenc@uabc.mx
A. MASCARENHAS, Á. MARTÍNEZ–DÍAZ–DE–LEÓN
Instituto de Investigaciones Oceanológicas, Universidad Autónoma de Baja California,
Ensenada, Baja California,C. P. 22800 México
R. DURAZO
Facultad de Ciencias Marinas, Universidad Autónoma de Baja California,
Ensenada, Baja California, C. P. 22800 México
E. GIL–SILVA
Instituto de Investigaciones Oceanológicas, Universidad Autónoma de Baja California,
Ensenada, Baja California, C. P. 22800 México
Received June 17, 2005; accepted February 9, 2006
RESUMEN
Con el propósito de estudiar la influencia espacial de condiciones Santa Ana a lo largo de la península de Baja California, se registraron datos meteorológicos en ocho estaciones localizadas en el lado del Pacífico y tres estaciones en el Golfo de California. En febrero de 2002 ocurrieron dos eventos Santa Ana, uno entre el 9 y el 12, y otro entre el 2l y el 22. El primer evento Santa Ana, en términos de velocidad del viento fue más fuerte que el segundo, sin embargo, la humedad relativa y la temperatura del aire tuvieron un comportamiento similar en ambos eventos para algunas estaciones. En el lado del Pacífico, los datos mostraron la condición Santa Ana típica: incremento de la velocidad del viento y la temperatura, opuesto a un decremento de la humedad relativa. En el lado del Golfo de California el típico incremento en temperatura de una condición Santa Ana no fue observado, pero sí un decrecimiento en la amplitud de la variabilidad diurna tanto de la temperatura como de la humedad relativa, además de un notable incremento en la velocidad del viento. La dirección del viento durante los eventos Santa Ana en el lado del Pacífico fue del cuadrante del NE mientras que en el Golfo de California la dirección media fue del NO. Los vientos del NE fueron asociados al cambio de posición del centro de alta presión del Pacífico Norte, el cual se desplaza hacia el continente. Las observaciones sugieren que la humedad relativa podría ser el mejor parámetro para monitorear la ocurrencia y duración de una condición Santa Ana en el lado del Pacífico. Las condiciones normales mostraron una diferencia negativa de temperatura aire–mar, pero durante ambos eventos Santa Ana las diferencias fueron positivas y excedieron los 10 °C. Los flujos de calor latente y sensible se incrementaron drásticamente durante los eventos, alcanzando valores de más de tres veces los de condiciones normales, lo cual fue debido a la combinación de los fuertes vientos y una masa de aire más seca y más caliente sobre el océano.
ABSTRACT
Meteorological data were recorded at eight stations located along the coast of the Pacific Ocean and three along the coast of the Gulf of California, aimed to assess the spatial influence of Santa Ana weather conditions in the Baja California peninsula. February 2002 featured two Santa Ana events: one from the 9 to the 12 and another from the 21 to the 22. The first Santa Ana event had the strongest winds, however relative humidity and temperature behaved similarly on both events at some stations. Data from the Pacific Ocean showed typical Santa Ana condition patterns: wind speed and temperature increase opposed to decreased relative humidity values. Data from the Gulf of California did not show the typical temperature rise of a Santa Ana condition, but there was a decrease on the amplitude of the diurnal variability of air temperature and relative humidity as well as a marked increase on wind strength. Wind direction during the Santa Ana events on the Pacific side was NE and NW on the Gulf of California. NE winds are associated to the shift on the position of the North Pacific High Pressure Center, which moves towards the continent. Data suggest that relative humidity may be the best parameter to monitor both occurrence and length of Santa Ana conditions on the Pacific side. Normal weather conditions show a negative air–sea temperature difference, but during both Santa Ana events this difference was positive and higher than 10 °C. Latent and sensible heat fluxes drastically increased during both events, reaching values more than three times higher than those for normal conditions, which is due to the presence of strong winds combined with a drier and hotter air mass over the ocean.
Keywords: Santa Ana condition, meteorological stations, Pacific and Gulf of California, heat fluxes.
1. Introduction
Atmospheric circulation along the coast of California and Baja California is influenced by both the position and intensity of the North Pacific High Pressure Center, which seasonally migrates from its southerly position (28° N, 130° W) in February to its northerly position (38° N, 150° W) in August. Its surface central pressure increases from winter to summer, when it reaches a maximum of  1028 mb. During most of the year, the pressure distribution produces a geostrophic wind component towards the equator (south of 40° N). A detailed discussion of the atmospheric circulation over the east Pacific is found in Huyer (1983), Strub et al. (1987) and Strub and James (2002).
A particular situation is observed when the prevailing winds over southern California blow from the northeast quadrant associated to an anticyclone located over the Great Basin and a surface low pressure system off the California coast (Raphael, 2003). The Great Basin High develops when a cold front, linked with a trough aloft, passes through California (Schroeder et al., 1964). The air mass flowing from the higher Sierra Nevada range, in the west and the Rocky Mountains in the east toward the Pacific, is funneled through passages in the southern California coastal ranges (Sommers, 1978; Westerling et al, 2004). Compression of the air mass as it moves through the mountain passages causes the wind speed to increase, while the descent along mountain slopes increases its temperature and reduces its relative humidity due to adiabatic processes. This particular situation is known as a Santa Ana weather condition. Santa Ana conditions are similar to the so–called "Föhn" winds in Europe. A Föhn wind is a warm dry wind blowing down the slopes of the Alps. Winds that depict features such as a Föhn have been given a variety of names in other parts of the world; such is the case of the "Chinook" wind, which occurs at the lee of the Rocky Mountains (Glenn, 1961).
Studies related to Santa Ana wind events along the Pacific coast of the Baja California peninsula are scarce, but studies comparing their simultaneous occurrence on both the Pacific coast and the Gulf of California are nonexistent. Santa Ana wind episodes have been reported along the pacific coast of Baja California mainly during the fall and winter seasons associated to strong winds from the east–northeast (Álvarez–Sánchez, 1977; Pavía and Reyes, 1983; Trasviña et al, 2003; Castro et al, 2003; Sosa–Ávalos et al, 2005). The offshore influence of Santa Ana winds was studied by Svejkosvsky (1985), who tracked smoke plumes in California and Baja California using AVHRR images during the severe eastern winds of November 26 to 30 in 1980. The smoke from the wild fires followed the 700 mb line and was evident on images, more than 1100 km (26° N, 15° W) southwest off the source.
Based on wind data from the QuikScat satellite, Castro et al. (2003) showed that a Santa Ana occurred during February 9–12,2002 affecting a large portion of the Baja California Pacific coast (700 km off the coast) and most of the Gulf of California. An AVHRR image of sea surface temperature for February 10, 2002 was also used to observe the dispersion of Santa Ana winds over the ocean. These winds lifted a large amount of dust that obstructed the temperature sensor, making the dispersion easy to follow.
A SeaWiFS image taken on February 10,2002 (Fig. 1a, http://eob.gsfc.nasa.gov/Natural/Hazards/), showed a large amount of sand and dust transported towards the sea. The extension and direction of the winds can be inferred from the dust plumes on the regions of Rosarito, Ensenada, Punta Colonet, south of El Rosario and Santa Rosaliíta, Baja California; and on Bahía de Tortugas, south of Punta Abreojos, Baja California Sur. Some wild fires along the Baja California peninsula showed the same pattern. Dust plumes reached Guadalupe and Cedros islands, indicating the extent of the event over the sea. Local meteorological measurements also show this pattern. Figure 1b shows the chlorophyll–a concentration values measured on the same date. Plumes of chlorophyll–a off Baja California show indirectly the wind distribution over the ocean.
Sosa–Ávalos et al. (2005) evaluated the effect of Santa Ana winds on bio–optical parameters off Baj a California in October, 1999. They found that the absorption coefficient of detritus in surfaces samples was ten–fold higher in October than in other periods such as January, April, and August of the same year. These high values were caused by inorganic material driven by the wind during two Santa Ana events in October, one from 9 to 11 and the other from 17 to 20. However, regional chlorophyll estimates from water column bio–optical information were not greatly affected by wind–borne dust during those Santa Ana events.
Trasviña et al. (2003) have found that Santa Ana winds cause upwelling off the west coast of Baja California, reporting cold water filaments and estimating vertical water speeds of 20 m/day. These observations are consistent on both time and location with those structures observed on thermal imagery.
Despite the relevance of Santa Ana conditions along the Baja California Peninsula, documentation based on in situ measurements is scarce. The purpose of this study is to document and analyze the spatial behavior of Santa Ana events, focusing on those occurred on February 2002. The events occurred on November 2002 are discussed, as well as their associated oceanic thermal response in February.
2. Meteorological and oceanographic data
Wildfires in southern California during autumn and winter are often linked to Santa Ana weather events (Westerling et al., 2004). The University of California in San Diego reports a Santa Ana Index (SAI) computed by considering surface pressure differences between the Great Basin and southern California along with air humidity and wind direction in southern California. When pressure differences are high, humidity is low and wind flows north–northeasterly, a Santa Ana flag is turned on (http://meteora.ucsd.edu/weather.html).
The SAI shows that Santa Ana conditions occurred in California during February 9–12 and 21–22; November 3, 6, 12–13, 15–16, 18–22 and 26–29, 2002; considering that these events affected the Baja California peninsula as well, we analyzed simultaneous observations retrieved from automatic meteorological weather stations during these events (but focused on February) along the Baja California Pacific and Gulf coasts.
Geographical locations of the meteorological stations are shown in Figure 2. Source and height of all stations are listed in Table I. The names of the stations on the Pacific side are: One in Rosarito (RO); four in Ensenada: Punta Morro (PM), Todos Santos Island (TSI), Coastal Monitoring Buoy (CMB) moored at a local depth of 18 m and 2.7 km in Todos Santos Bay and Ensenada Dam (ED) 6 km inland; San Quintín (SQ) 6.2 km inland; Guadalupe Island (GI) 180 km distance off Baja California coast; Cedros Island (CI). The stations on the side of the Gulf of California are: San Felipe (SF), Bahía de Los Angeles (BA) and Santa Rosalía (SR). SR is located approximately in the middle of the Baja California Peninsula.
All meteorological stations measured hourly wind speed (ms–1), maximum wind speed (ms–1). wind direction (azimuth), air temperature (°C), relative humidity (%), and surface atmospheric pressure (mb). The CMB also provided information of water temperature (°C) at 1.5 m depth. The RO station provided water temperature (°C) at 2 m depth.
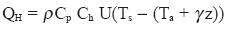
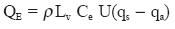
The response of the ocean to the Santa Ana events were evaluated using air–sea heat fluxes. Sensible (QH) and latent (QE) heat (Wm–2), were computed for RO and CMB using the bulk formulae of the AIR_SEA Toolbox (http://sea–mat.whoi.edu/) (Fairall et al., 1996), by the bulk formulae:
 ..........................................(1)
 .....................................................(2)
where U (ms–1) the wind speed;  =1.25 Kgm–3 is the density of the air; Ts (°C), the sea surface temperature; Ta(°C), the air surface temperature with corrections for the adiabatic lapse rate,
  , and the height at which the air temperature was measured (z); Cp=1004.6(1+0.8375 qa) (JKg–1K–1) the air specific heat at constant pressure; Lv=(2.501x10⁶–2.3x10³ Ts) (JKg–1) the latent heat of vaporization; Ch=0.83–1.1x10⁻³ and Ce=1.5x10⁻³ are dimensionless coefficients; qs is the specific humidity (saturated) at sea surface temperature and qa is the specific humidity at air temperature (Gill, 1982).
3. Results
3.1 Atmospheric response
Raw and filtered (running mean low pass filter) wind data of wind components (u and v) recorded at stations on the Pacific side on February 5–25, 2002 are shown in Figure 3. Figure 4 shows components for stations on the Gulf side. Gaps observed in time series are due to intermittent instrumentation failure, but these data are still useful for the purposes of this work. Positive values for the u component indicate that winds are from the east; for the v component, positive values indicate that the wind blows from the north. In general, data from all stations display the typical sea breeze diurnal cycle. However, it is possible to see a marked increase on wind speed and a sudden change on wind direction for days 9–12 and 21–22 at all stations but SQ, where the wind veered during the Santa Ana event, coming from the northeast on the Pacific and the northwest on the Gulf side. According to the SAI, these changes identify the occurrence of Santa Ana events during these dates in Baja California, albeit they are more evident when the data were filtered.
Wind velocity components (Figs. 3 and 4) show that the first Santa Ana event was stronger in terms of wind speed than the second. Whereas in the first event, maximum wind speeds (not shown) recorded at RO reached 22 ms–1. The second event had maximum but weak wind speeds at RO (below 8 ms–1). It is also evident that the Santa Ana events caused stronger winds on the northern stations at both sides of the Baja California peninsula. The Santa Ana signal was more marked for the north–south wind component along the Gulf's stations. Other events can be noticed, as in BA (Fig. 4, c and d).
Surrounded by an oceanic environment, GI contrasts with the rest of the stations (Fig. 3, k and l). Wind speeds are relatively strong for most of the period. GI shows the east–west component increased slightly and the north–south component does not show a noticeable change during the first Santa Ana event. Also, wind direction changed to easterly. Surprisingly, the second Santa Ana event was not evident at GI.
The Santa Ana events in SQ are not noticeable from the wind records. However, as we will see later, changes in temperature and relative humidity are evident.
Mean wind velocity magnitude (mean gust) and mean direction for both normal and Santa Ana conditions are summarized in Table II. As observed, all but the SQ station showed a significant increase on mean wind speed during the Santa Ana compared with periods of normal conditions. RO displays the highest values, 10.0 (20.1) m s–1 for the Pacific side and SF 9.3 (12.4) m s–1 for the Gulf side. Mean wind direction during the Santa Ana event for the Pacific coast stations was from the northeast quadrant, while for the Gulf stations was from the northwest. It is important to notice that wind speed during normal conditions at GI is almost twice the speed recorded at other stations. During normal conditions, mean wind direction was from the northwest quadrant at all Pacific stations, with the exception of ED and CI, which where affected by local conditions with easterlies at both stations. On the Gulf side, mean wind direction is from the northwest quadrant, with the exception of SF.
Regarding humidity, data show a drier environment on the Gulf of California, contrasting with the more humid conditions on the Pacific coast (Figs. 5 and 6, left columns) for the entire period observed. The Gulf showed relative humidity values below 50%, whereas humidity on the Pacific side shifted between 70 and 90%. It is possible to identify a drastic drop in humidity in all stations of the Pacific side during Santa Ana events, reaching values well below 20%. The exception is GI (Fig. 5k), where the second Santa Ana did not cause any relevant change in humidity. As we will discuss later, this could suggest that this particular Santa Ana event was not strong enough to reach as far west as the GI station. Another interesting feature is that during the onset of a Santa Ana event, wind speed increases as humidity decreases suddenly; and during its decay phase the wind speed decreases suddenly again, but humidity takes longer to return to its normal values. The Gulf side features desert climate and low humidity most of the year and these particular Santa Ana events did not cause a noticeable change in humidity (Figs. 6, a, c and e). As on the Pacific side, events are noticeable because of an attenuation of the amplitude of diurnal variability.
Air temperature time series for stations on the Pacific side (Fig. 5, right column) also show a sudden temperature increase in most of the stations. This increase is clearly associated to Santa Ana events. Again, GI distinguished itself by a lack of drastic changes on air temperature during the second Santa Ana. Atmosphere temperature for stations on the Gulf side (Fig. 6, right column) was relatively higher than at stations of the same latitude on the Pacific side (Fig. 5, b, d, f and h), probably due to the topographic barrier that separates the Pacific from the Gulf environment, i.e. the dry air mass from aloft that reaches the surface in the Pacific side does not do so on the Gulf side, leaving the original air mass on its place and minimizing humidity and temperature changes. This across–peninsula temperature differences decreases at stations further south (Fig. 5, l and n), possible due to a decrease on the height of the topographic barrier (Fig. 2).
Despite the lack of sudden changes during Santa Ana events on the Gulf side, it is possible to identify a decrease on the diurnal variability of air temperature. This could probably be caused by the increase on wind speed which stimulates mixing, but does not allow the air to heat during the day and, as a consequence, there is no irradiative cooling at night.
3.2 Oceanic thermal response
During both Santa Ana events, air–sea temperature differences were positive (Fig. 7a). During the first event, air–sea temperature differences at RO (Rosarito) and CMB (Ensenada) were of 10 °C, which was not the case for the second event, where air–sea temperature differences were higher at RO (15° C) in contrast to CMB. As we mention later, this may be the consequence of higher air temperature at RO, as observed in Figure 5b, combined with lower sea surface temperature (Trasviña et al., 2003).
We assume that fluxes from the ocean to the atmosphere are negative. Sensible and latent heat fluxes (Fig. 7b and c, where humidity from PM was used to infer heat fluxes at CMB) showed a sudden change during both Santa Ana events. On the first event, QH and QE reached values of 150 Wm–2 and 400 Wm–2, respectively. However, during the second event, changes were more drastic at RO, with QH and QE values of 250 Wm–2 and 310 Wm–2 respectively, whereas, at CMB they only reached about 60 Wm–2 and 120 Wm–2 respectively. It is interesting to notice that during the first event the latent heat flux reached maximum values of 460 Wm–2, suggesting that during some Santa Ana events, the loss of latent heat could exhibit a five–fold increase compared to that at normal conditions.
Large latent heat fluxes during the Santa Ana events considered here produced a drastic increase on evaporation rate associated to strong winds and low relative humidity. Average evaporation rate was 1.18x10⁻⁴ kg m–2s–1(9.9x10⁻³mday–1) and 8.2x10⁻⁵ kg m–2s–1 (6.9x10⁻³mday–1) for RO, and 8.5x10⁻⁵ kg m–2s–1(7.2x10⁻³ mday–1) and 1.8x10⁻⁵ kg m–2s–1 (1.5x10⁻³ mday–1) for CMB during the first and second Santa Ana events respectively. These values represent fluxes of up to two orders of magnitude larger than those under normal conditions.
A better description of the air–sea fluxes can be achieved by using the Bowen ratio (Bowen, 1926), BR = QH/QE. The time series of BR (not shown here) characterizes two regimes; one where the BR is negative (minimum value 1.2) corresponding to normal conditions most of the time, and positive BR (maximum value 0.6), corresponding to Santa Ana conditions. It can be seen that BR, as function of air–sea temperature differences (ΔT) (Fig. 7d), can be used to define Santa Ana conditions. Manabe (1957) found high values of BR and ΔT during cold air outbreaks over the Japan Sea. Data showed a warm air outbreak with BR and ΔT values of –1.5 and 15 °C, respectively.
In spite of not making directs measurements, a manifestation of the ocean response to Santa Ana events can be inferred from chlorophyll–a, image acquired on February 10 (Fig. 1b) when the first event was taking place. The image shows plumes of high chlorophyll–a concentration spreading off Baja California. The geographical location of these plumes is highly correlated with the location of the dust plumes observed on the visible image shown in Figure 1a, suggesting that the strong winds flowing off shore were responsible for upwelling of, in consequence, cold, high productivity, sub–surface water masses that favorably affect local fisheries.
4. Discussion
Meteorological and sea surface temperature data retrieved from the Pacific and Gulf sides of the Baja California peninsula clearly show the occurrence of two Santa Ana events during February 2002. Wind speeds increased and wind direction suddenly changed on both sides of the peninsula. However, humidity decreased as temperature increased on the Pacific side. On the Gulf side, only a reduced variability on these variables was observed during both events.
Due to the fact that prevailing northerly surface winds are a frequent condition in the Gulf during the winter (Badán–Dangon et al., 1991; Marinone et al., 2004), any Santa Ana condition could be obscured. Furthermore, these conditions over the Gulf are referred by locals as "Nortes" (northerns) and not as Santa Ana conditions.
During the onset of a Santa Ana event, wind speed increased on both sides of the peninsula. However, it is possible to notice a lag of several hours in the occurrence between the Gulf and the Pacific stations. In particular, the first event was perceived in San Felipe (Gulf side) on February 9 between 0400 and 0500 PST, whereas its arrival to the northern Pacific stations was two hours late (RO, CMB, PM and ED), six hours to the southernmost station (CI), and 20 hours (February 10, 0100 am) at Guadalupe Island, the southwestern offshore station. Although not shown here, higher atmospheric pressures in SF and time lags can be clearly observed in atmospheric pressure data recorded at different stations. This time lag between the onsets of the Santa Ana observations at different stations is related to the North Pacific High displacement towards the continent. SF is the meteorological station closer to the North Pacific High once it has moved, whereas the northern stations on the Pacific side are farther from it. The role of the North Pacific High on the wind distribution is shown in Trasviña et al. (2003), who analyzed two synoptic maps of sea level pressure for the first February 2002 event.
In contrast with stations on the Pacific, a decrease on diurnal air temperature variability may be identified on the Gulf stations during a Santa Ana event, suggesting the presence of homogeneous air masses that obscure local diurnal variability. This might be due to the fact that the air mass flowing along the Gulf does not experiment any topographic (adiabatic) effect. When winds flow over the mountains towards the Pacific, they descend on the lee side, thus, the Pacific side has air from aloft reaching the surface, while this does not occur on the Gulf side. Also, the air mass, while being funneled through mountain passages, increases its intensity, as clearly observed in Figure 1a.
Another consequence of the mountain chain along the Baja California peninsula is that it causes significant spatial and temporal wind variability. This is clearly observed when we compare wind speed at SQ (Fig. 3i and j) against that at Cedros Island (Fig. 3m and n). While the altitude of the mountains behind SQ is the highest in the area (>1500 m, Fig. 2) making it difficult for the wind to pass, near to CI the altitude on the peninsula is below 700 m and eases the passage of the wind. As already mentioned, this mountain–induced spatial variability is observed as dust jets flowing offshore in Figure 1. Also, the mountain height spatial variability along the peninsula could cause time variability on the Santa Ana arrival to the different stations. The humidity field that shows the first Santa Ana event arriving 18 hours earlier at CI than at SQ is a good example (Fig. 5i and m).
It is interesting to notice that the variability on relative humidity and temperature was less drastic in GI compared to the variability of all coastal stations. This could be due to the fact that the air mass had to travel over the cold sea for about 200 km before reaching the island, modifying its humidity and temperature. The higher the wind speed, as in the first event, the less time the air will be in contact with the sea before reaching the island, retaining most of its Santa Ana characteristics and resulting in a more noticeable change on relative humidity and temperature at the island station.
Regarding the ocean response to the second Santa Ana event, heat fluxes were more drastic at RO than at CMB. Since sensible heat flux is a function of wind speed and air–sea temperature differences (Eq. 1), and latent heat flux is a function of wind speed and humidity (Eq. 2), these differences are a result of wind speed and air temperature being higher at Rosarito than at CMB, producing more sensible heat fluxes. In addition to higher wind speeds, latent heat flux and humidity was slightly lower (Fig. 5a and c) at RO. On the other hand, dry air combined with strong winds during the Santa Ana conditions produced high levels of evaporation, particularly during the first event. These evaporation values were even higher than those observed at other geographical locations known by their high evaporation rates, such as the Gulf of California, which has an average annual mean evaporation rate of 1 m year–1 (2.7x10⁻³ m day–1). However, we must state that this high rate evaporation lasts only a few days on Santa Ana events.
According to chlorophyll–a imagery (Fig. 1b), it is evident that some Santa Ana events can play an important role inducing upwelling on the west coast of Baja California, which increases ocean's primary productivity. Particularly, the analysis of a sequence of chlorophyll–a imagery before and during the first Santa Ana event shows that coastal values of chlorophyll–a increased from 0.9 to 3.4 mg m–3 within the plumes. Another interesting feature that can be noticed from Figure 1b is the spatial extension of the highly chlorophyll–a concentrated waters, which can move up to 300 km offshore.
It is important to mention that the meteorological response to Santa Ana conditions is not always the same. We have observed that in some cases, although drastic changes can be observed in relative humidity and air temperature, wind speed does not always change significantly. To show this, we present a series of records of four Santa Ana events occurred during November 12–13, 15–16, 18–22 and 26–29 2002 (Fig. 8), where only measurements at PM, TSI and GI stations are considered. During these Santa Ana conditions, changes in wind speed were not too drastic and did not last very long. There was only a slight increase on wind speed at the beginning of each event. However, changes on relative humidity, air temperature, and particularly relative humidity (Fig. 8g) were larger and lasted longer.
5. Conclusions
Records of meteorological parameters showed that Santa Ana conditions reached Guadalupe Island. While all stations located on the Pacific side showed the classical Santa Ana condition behavior (wind and temperature increase and relative humidity decrease), stations on the Gulf side did not show a clear change on the local weather conditions despite a marked increase on wind speed. All stations but San Quintín showed a significant increase on wind speed during the Santa Ana event when compared with periods of normal conditions. Rosarito showed the highest values of mean wind speed (gusts), 10.0 (20.1) ms–1, on the Pacific side and San Felipe with 9.3 (12.4) ms–1 on the Gulf of California side. Mean wind direction during the Santa Ana events on the Pacific side were from the NE, whereas on the Gulf were from the NW. Observations suggest that relative humidity might be the best parameter to monitor the occurrence and duration of a Santa Ana condition along the Pacific, especially at places where the wind field may be obstructed by topography. Such is the case of San Quintín, on the Pacific side, where drastic changes were observed on humidity and air temperature but not on wind. The oceanic response to Santa Ana events showed three–fold increases on sensible and latent fluxes. Chlorophyll–a concentration showed a considerable increase in the coastal waters of the Pacific Ocean.
Acknowledgements
This research was supported by UABC projects 311, 323, 1354 and 1361. We thank Comisión Nacional del Agua (specially to M. Colima Sánchez), Secretaría de Marina, Fox Studios, and CICESE (particularly M. Lavín and V. Godínez) for providing data from their meteorological stations. The Sea–Viewing Wide image was obtained by courtesy of the SeaWiFS Project, NASA/Goddard Space Flight Center, and ORBIMAGE. E. Santamaría gently provided the clorophyl–a of SeaWiFS LAC image, which was processed at Facultad de Ciencias Marinas, UABC. We thank two anonymous reviewers for suggestions that improved the manuscript. R. Castro is currently at CICESE as sabbatical research.
References
Álvarez–Sánchez L. G., 1977. Vientos en la Bahía de Todos Santos, Baja California. Ciencias Marinas, 4, 81–89. [ Links ]
Badan–Dangon A., C. E. Dorman, M. Merrifield and C. D. Winant, 1991. The lower atmosphere over the Gulf of California. J. Geophys. Res. 96, 16877–16896. [ Links ]
Bowen I. S., 1926. The ratio of heat losses by conduction and by evaporation from any water surface. Phys. Rev. 27, 779–787. [ Links ]
Castro R., A. Parés–Sierra and S. G. Marinone, 2003. Evolución y extensión de los vientos Santa Ana de febrero de 2002, en el océano frente a California y Baja California. Ciencias Marinas, 29, 275–281. [ Links ]
Fairall C. W., E. F. Bradley, D. P. Rogers, J. B. Edson and G.. S. Young, 1996. Bulk parameterization of air–sea fluxes for Tropical Ocean–Atmosphere Response Experiment. J. Geophys. Res. 101, 3447–3764. [ Links ]
Gill A., 1982. Atmosphere–Ocean Dynamics. Academic Press, Inc., Orlando, Florida, 662 p. [ Links ]
Glenn L. C., 1961. The Chinook. Weatherwise, 175–182. [ Links ]
Huyer A., 1983. Coastal upwelling in the California Current System, Prog. Oceanography 12, 259–284. [ Links ]
Manabe S., 1957. On the modification of air–mass over the Japan Sea when the outburst of cold air predominates. J. Met. Soc. Japan, 35, 311–326. [ Links ]
Marinone S. G., A. Parés–Sierra, R. Castro and A. Mascarenhas, 2004. A note about the article "Temporal and Spatial variation of the surface winds in the Gulf of California". Geophys. Res. Letters 31, L10305, doi: 10.1029/2004GL020064, 2004. [ Links ]
Pavía E. and S. Reyes, 1983. Variaciones espaciales y estacionales del viento superficial en la Bahía de Todos Santos, B. C., Ciencias Marinas 9, 151–167. [ Links ]
Raphael M. N., 2003. The Santa Ana winds of California. Earth Interactions (AMS) 7, 1–13. [ Links ]
Schroeder M. J., 1964. Synoptic weather types associated with critical fire weather, in Pacific southwest forest and range experiment station, Berkeley Press, Berkeley, California, pp. 264–274. [ Links ]
Sommers W. T., 1978. LMF forecast variables related to Santa Ana wind occurrences. Mon. Wea. Rev. 106, 1307–1316. [ Links ]
Sosa–Ávalos R., G. Gaxiola–Castro, R. Durazo and B.G. Mitchell, 2004. Effect of Santa Ana winds on bio–optical properties off Baja California. Ciencias Marinas 31, 339–348. [ Links ]
Strub P. T., J. S. Allen, A. Huyer, R. L Smith and R. C. Beardsley, 1987. Seasonal cycles of currents, temperatures, winds, and sea level over the northeast Pacific continental shelf: 35° N to 48° N. J. Geophys. Res. 92, 1507–1526. [ Links ]
Strub P. T. and C. James, 2002. Altimeter–derived surface circulation in the large–scale NE Pacific gyres: Part 1. Seasonal variability. Prog. in Oceanogr. 53, 163–183. [ Links ]
Svejkovsky J., 1985. Santa Ana airflow observed from wildfire smoke patterns in satellite imagery. Mon. Wea. Rev. 113, 902–906. [ Links ]
Trasviña A., M. Ortiz–Figueroa, H. Herrera, M. A. Cosío and E. González, 2003. 'Santa Ana' winds and upwelling filaments off northern Baja California. Dyn. Atmosph. Oceans 37, 113–129. [ Links ]
Westerling A. L., D. R. Cayan, T. J. Brown, B. L. Hall and G. R. Laurence, 2004. Climate, Santana winds and autumn wildfires in southern California. EOS, Transactions, American Geophysical Union, 85. [ Links ]

