


Services on Demand
Journal
Article
 English (pdf)
 Article in xml format
 Article references
 Send this article by e-mail
Indicators
-
 Cited by SciELO
 -
 Access statistics
Related links
-
 Similars in
SciELO
Similars in
SciELO
Share

 Permalink
Atmósfera
Print version ISSN 0187-6236
Atmósfera vol.18 n.3 Ciudad de México Jul. 2005
Urban effects on precipitation in Ankara
I. ÇIÇEK and N. TURKOGLU
Department of Geography, Faculty of Letters, Ankara University, Turkey
Corresponding author's e-mail: cicek@humanity.ankara.edu.tr
Received May 3, 2004; accepted May 5, 2005
RESUMEN
En este estudio se investigaron las tendencias de las clases de los días de precipitación para el periodo caliente (mayo-septiembre) en Ankara. Los datos obtenidos de la Estación Meteorológica de Ankara (AMS), de características urbanas, y los de la Estación Meteorológica de Esenboga (EMS), de características rurales, se analizaron estadísticamente para conocer las tendencias de las clases de los días de precipitación. En ambas estaciones, con los años, se observó un aumento de los días de precipitación y de los días de precipitación ligera. Sin embargo, el número de días con precipitación abundante se incrementó en la estación de características urbanas (AMS) y disminuyó en la de características rurales (EMS). Se observó un incremento de 50% en el número de los días con precipitación abundante (AMS), en comparación con el número de días para este mismo parámetro de la estación rural (EMS). En ambas estaciones la tendencia al aumento en la precipitación y en los días de precipitación ligera puede estar relacionado con cambios en el clima. Sin embargo, el incremento en los días de precipitación abundante únicamente en la estación urbana (AMS) puede deberse a la urbanización.
ABSTRACT
In this study, trends of the precipitation day classes in the warm period (May-September) were investigated for Ankara. Data collected by Ankara Meteorology Station (AMS) which has urban characters, and Esenboga Meteorology Station (EMS) which has rural characters, were statistically analyzed to understand the trends of the precipitation day classes. At both, the urban and rural stations, an increase was observed in the number of precipitation days and light precipitation days within years. However, the number of heavy precipitation days increased at the station with urban character (AMS), while it decreased at the station with rural character (EMS). A 50% increase was observed in the number of heavy precipitation days at the urban station (AMS) in comparison with that of the rural station (EMS). The increasing trend in the precipitation and light precipitation days at both stations may be related to the changes in climate. However, the increase in the number of heavy precipitation days only at the station with urban character (AMS) may be due to urbanization.
Key words: Ankara, precipitation, classification of precipitation days, urbanization, precipitation trends.
1. Introduction
Urbanization is increasing in parallel with the increase in population. As a result of urbanization and population increase, the energy consumption has also been increasing due to heating, traffic and industrialization. These are causing remarkable changes in the meteorological conditions, and climate of cities and neighboring areas. The most salient impact of urbanization on the climate can be observed on temperature. It is apparent that in all cities located in the tropics and in the Polar Regions, the temperature has increased. However, the impact of urbanization on precipitation varies with time and area. In various investigations, it was found that both, the number of precipitation days and the intensity of precipitation, have changed due to urbanization especially in mid-latitude countries (Atkinson, 1971; Lowry and Probáld, 1978; Yonetani, 1982; Shafir and Alpert, 1990; Changnon et al., 1991; Jáuregui and Romales, 1996; Changnon, 2001; Bornstein and Lin, 2000).
Chandler (1965) summarized the probable effects of cities on precipitation under three main headings such as the mechanic turbulence caused by the increasing surface roughness, additional sensible heat caused by urban heat islands, and the plenty of condensation nuclei in the atmosphere of cities. Similar results were also obtained in the study carried out by Changnon et al. (1976) in the Metropolitan Meteorological Experiment Project (METROMEX). In the METROMEX project, which is one of the important researches done on urban climatology, it was observed that there is a statistically meaningful increase in summer precipitation in St. Louis (heavy showers, thunderstorm, and hail) due to urbanization (Changnon et al., 1976). In this project, it was also observed that the urban influence on the heavy showers is felt mostly in June, but it is diminished gradually in July and August. The METROMEX proj ect proved that the number of days with showers in summer months increases by 45% due to the urban effect. It was also observed that the urban influence is evident on all weather types producing precipitation (Changnon, 1978). In the light of the analysis of METROMEX data, it was understood that showers are concentrated in the center and especially in the downwind areas of cities. Atkinson (1971) showed that urbanization affects the development of convective clouds and the path of these clouds in London. In Chicago, a significant increase in the number of heavy precipitation days was recorded in spring and summer, and a 12% increase in precipitation was observed in the urban area when compared to the rural areas (Changnon, 2001). Lowry (1998) reviewed the studies about the effects of urbanization on the local climate. The methods used to analyze the effects of urbanization on precipitation are also summarized in this review article.
Studies on the changes in precipitation trends in Turkey were carried out on a regional basis. In a few studies, the relation between urbanization and the change in precipitation was investigated, and no significant relation was found between urbanization and precipitation change. Tayanç and Toros (1997) investigated the effects of urbanization on the regional climate change in four big cities in Turkey. They observed a significant relation between temperature and urbanization, but they found no relation between annual precipitation and urbanization. Hence, they argued that the cities are not big enough to affect the precipitation trends. Kadioglu (1997) investigated the influence of urbanization on precipitation in the Marmara region, and found that there was an increase in the number of precipitation days because of the increase in the number of condensation nuclei in the cities. It was also observed that the number of heavy precipitation days (> 30 mm day1) decreased. They explained this decrease as a result of the fact that with the increase in the number of the precipitation days, the water vapor falls down more often, and its concentration in the atmosphere does not reach to a point that is enough to feed heavy rains. It is also pointed out in this article that there is a remarkable increase in the number of precipitation days in the downwind eastern parts of big cities such as Istanbul and Bursa.
In warm seasons of recent years there have been many floods in big cities such as Istanbul, Ankara and Izmir. These floods have been explained only as a result of the synoptic conditions and topographic changes due to urbanization. However, they may be at least partly due to the increase in the intensity of precipitation in the warm season as a result of urbanization. In this study, the relations between urbanization and precipitation in the warm season were investigated for Ankara.
2. Research area and stations used
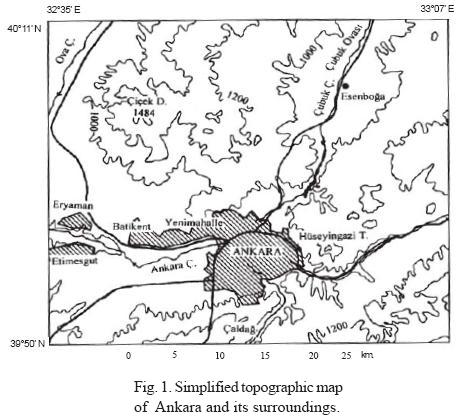
The metropolitan city area of Ankara is located between 39° 50' and 40° 00' north latitude and 32° 35' and 33° 00' east longitude. The city of Ankara is located at Ankara plain which has an altitude of 800-850 meters. Ankara plain is formed by Çubuk stream and its branches. This plain is surrounded from the north by the Çiçek Mountain, which forms the south parts of Mire Mountain, from the east by the west remainings of Idris Mountain, and from the south by Çaldagi and Elmadag (Fig. 1). The plain is open to the west and is connected to Mürted plain which is formed by the Ova stream. These topographic characteristics determine the distribution of the settlement areas and cause significant changes on the continental climate which is dominant in Ankara.
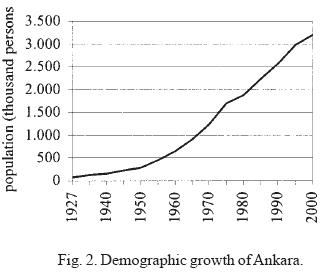
In Turkey, the first census was held in 1927, and since then the annual population increase has always been over 2%, except in the Second World War years and in year 2000. The population increased from 13,348,270 in 1927 to 67,803,927 in 2000. As a result of this rapid population increase and due to industrialization in the 1950s, a heavy migration to cities has taken place and the population of this settlements increased rapidly. The city population, which was 23% of the total population in 1950, surpassed the village population for the first time in 1985. In year 2000, the city population in the wholw country reached 64.9% of the total population. The population growth in Ankara was similar to that in Turkey. Ankara, which was a small town with a population of 74,553 in 1927, reached a population of 3,203,362 in 2000 (Fig. 2). The annual population increase rate in Ankara was recorded over 5% between the years 1927 and 2000. This rate was nearly two times the average population increase rate in Turkey in the same period. While in Turkey the population increase rate was 2% between 1990 and 2000, in Ankara it was 8.8% within the same period. In parallel with the population growth, the urban area also expanded rapidly in Ankara, from 3 km2 to 2020 km2 in the 1927-2002 period; this corresponds to a 673 times expansion.
According to Thornthwaite classification, the climate in Ankara is a first degree mesothermal semi-arid climate (D B'1, s2 b'3) with intensive water shortage in summer months (Çiçek, 1996). The mean temperature of Ankara and its surroundings is above 20.0°C in three months (June, July and August), it is between 10.0-20.0 °C in four months (April, May, September and October) and it is below 10.0°C in five months of the year (November, December, January, February and March) (Çiçek, 2000). The values of some meteorological parameters for Ankara are as follow: The annual mean temperature is 11.7 °C, the mean temperature in January is -0.1 °C, the mean temperature in July is 23.1 °C, the mean annual precipitation is 377.6 mm, the mean annual relative humidity is 60 %, the mean annual vapor pressure is 8.2 hPa, the mean annual wind-speed is 2.1 m sec-1, and the mean annual sunshine duration is 4066.6 h.
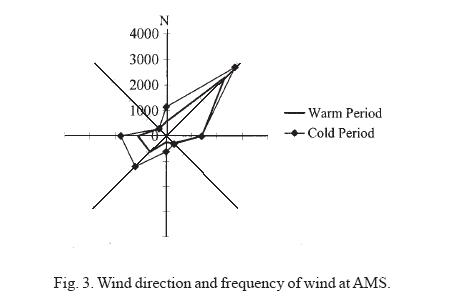
In Ankara and its surroundings, in the cold period, there are heavily cyclonic activities. As a result of this, frontal precipitation is effective in the cold period. However, in the warm period, anticyclonic conditions are dominant. Because of this, convective precipitation occurs in the warm period. As seen in Figure 3, at both stations considered and in all Ankara, the north-eastern directional wind is dominant through the whole year.
There are five meteorology stations in Ankara and in the near vicinity. However, only two of these stations have a continuous long term observation history. Therefore, these two stations were chosen for the study of the effects of urbanization on precipitation in Ankara. One of these stations is Ankara Meteorology Station (AMS), which is located in the city and considered reflecting the city characteristics in many respects. The other station is the Esenboga Meteorology Station (EMS) which is located outside Ankara and hence it is considered to have rural characteristics. AMS is located to the north of Ankara at an altitude of 891 meters, at 39° 38' north latitude and 32° 41' east longitude, and has been active since 1926. AMS is not in the center of the city, however it is close to it and there is a heavy urbanization around. Especially in the last 30 years, urbanization around AMS increased considerably. Thus, AMS can be considered as a station that reflects the urban characteristics. EMS is located at Esenboga Airport in the Çubuk plain to the north of Ankara. The altitude of EMS is 949 meters. In the whole year, and especially in the warm season in and around Ankara, a wind with northeast direction is dominant. In this wind direction, EMS is located upwind of the city. Therefore, the effects of urbanization of Ankara on precipitation at EMS can be considered negligible.
3. Data and methodology
Because the effect of urbanization is more effective on summer precipitation, the daily precipitation in the warm seasons at AMS and EMS (May-September) was investigated. The daily precipitation of these stations was analyzed in terms of the classification of Huff and Changnon (1970), that classify the precipitation days as follows:
> 0.25 mm day -1: precipitation day;
> 2.5 mm day -1: light precipitation day;
> 6.25 mm day -1: moderate precipitation day;
> 12.5 mm day -1: heavy precipitation day.
However, in this study > 0.1 mm day -1 was considered as a precipitation day to cover all cases and to be consistent with the precipitation day classification of the State General Directorate of Meteorology Affairs.
Parametrical methods cannot be used for the analysis of precipitation data since these do not have a normal distribution. Hence, non-parametrical methods were employed for the analysis (Sneyers, 1990; WMO, 1966). The basic feature of these methods is that the samples which do not have normal distribution can also be used. In non-parametrical methods, the real values of the variables are not used, but the order of the variables' values in the sequence (Gamgam, 1998).
For the analysis of the data, the non-parametrical Kruskal-Wallis H test was used in order to determine whether there are differences in certain periods in the data series. Under the null hypothesis "there is no change between precipitation values and the number of precipitation days over the years", H sample value (C -1) is approximately distributed as X2 with independence number. The rejection or acceptance of this null hypothesis is based on the value of critical X2 which is compared with f = (C - 1) at the required level of significance. In this study, the sample dimension for the sub-periods was taken as nj = 15 and the null hypothesis was tested at the significance of level 90% and 95%. According to this test, the null hypothesis in the number of precipitation days (> 0.1 mm day -1) at AMS was rejected at a 95% significance level and significant changes were found especially after 1970. In the same way, the null hypothesis was rejected at 90% significance level in the class of light precipitation day (> 2.5 mm day -1) and significant changes were found in this class after 1985. No statistically significant difference was found between the sub-periods of other precipitation day classes at AMS. On the other hand, the null hypothesis was rejected at 90% significance level only in the class of precipitation day at EMS and no difference was observed between sub-periods in the other precipitation classes.
To determine the trends of the precipitation data, the method of Mann-Kendall serial correlation was applied to the number of precipitation days. In a time series, for each element yi , the number ni of elements yj preceding it (i > j) is determined such that yi > yj.
The test value is then calculated by

The test value has nearly a Gaussian normal distribution. The mean of the distribution function and its variance are calculated as follow:

A trend can be seen for high values of  with
with

This principle can be extended to the backward series, and ui' = - u(ti') can be obtained. The intersection of u(t) and u'(t) curves denotes approximately the beginning of a trend. This is called the rank version of the Mann-Kendall test (WMO, 1966; Sneyers, 1990).
If the calculated u(t) value is significant at a level of 90% and 95%, it is concluded that an increasing or decreasing trend is statistically meaningful. By using the sample values of u(t) and u'(t) obtained from the successive analysis by the Mann-Kendall trend test, the trends in the classes of precipitation day were sketched. The overlap of u(t) and u'(t) curves several times in the diagram of the Mann-Kendall test indicates that there is no trend in the sequence. The divergence of these curves from each other indicates that there is a significant trend. Points where the curves intersect and then depart can be used to determine the starting date of any increasing or decreasing trend.
4. Analysis of the classes of precipitation days in Ankara
In order to determine precipitation differences between AMS and EMS in the warm season of the year (May-September), the precipitation data for the 1956-2001 period (except 1972) was statistically analyzed using the methods described above. When Table 1 is analyzed, it is seen that the number of precipitation days and the number of light precipitation days at EMS are greater than that at AMS, but the number of moderate precipitation days and the number of heavy precipitation days at AMS are greater than that at EMS. When the ratios of the number of the precipitation days, light precipitation days, moderate precipitation days and heavy precipitation days of AMS to EMS are calculated, 0.9, 0.9, 1.1, and 1.2 are obtained, respectively. As seen, at the station with urban characters (AMS), the number of moderate and heavy precipitation days are higher than that at the EMS which has rural characters. At AMS, the precipitation over 50.0 mm day-1 repeated three times in the period investigated. However, no daily precipitation over 50.0 mm was seen at EMS. Two of the three precipitation days over 50.0 mm day-1 at AMS occurred after 1995. The maximum daily precipitation of 88.9 mm occurred on 11.06.1997 at AMS, and the maximum daily precipitation of 38.2 mm was recorded on 12.09.1957 at EMS. It is also seen in Table 1 that at AMS the total precipitation is also higher than that at EMS. These show that the urbanization has caused increases in both the number of moderate and heavy precipitation days and in the total precipitation in Ankara in the warm season. A similar observation was made in the Marmara region by Kadioglu (1997).

Another important effect of the urbanization is the variation of the precipitation across the days of a week. In different studies, it was observed that weekdays receive more precipitation than weekends. Generally on Mondays least precipitation was recorded than among weekdays, and toward the end of the week, the amount of precipitation increases (Dettwiller and Landsberg, 1974). This is attributed to the fact that at weekends the economical activities are reduced and, as a result, less condensation nuclei form in the atmosphere and thus the amount of precipitation decreases.
To investigate the distribution of precipitation over the days of a week, two subperiods were analyzed in the warm period. These subperiods were chosen as the first five years and the last five years of the period analyzed for AMS and EMS. At AMS, it was observed that Sundays were days with the highest precipitation (20.9%) between 1926-1930. In the same period Saturdays, with 8.7%, were the days with least precipitation (Fig. 4). In the 1996-2000 period, in which the urbanization may be thought to be influential, Wednesdays were the days with highest precipitation with a value of 23%. In this period, Fridays were the least precipitation days with a value of 9.9%. During the week, there is a gradual increase in the precipitation from Monday to Wednesday. After the maximum precipitation on Wednesday, the precipitation suddenly decreases to a value of 10.3%. The fact that at AMS Friday was a generally least precipitation day and Wednesday was the day with most precipitation is not consistent with the findings of Dettwiller and Landsberg (1974) for Paris. The condensation nuclei that are carried over the center of the City by winds prevent the water accumulation in the clouds. Therefore, the water vapor in the atmosphere of the city transforms into precipitation in a shorter time. This causes an increase in the amount of total precipitation in the city. At AMS, between 1996-2000, Wednesdays were the least precipitation days in number, but the intensity of precipitation on Wednesdays was the highest. On the other hand in the same period, the number of Fridays with precipitation was the highest but the intensity of precipitation on these days was the lowest (Table 2). Such distribution of data shows that low intensity precipitation falls on the last days of the week, but more intense precipitation falls by the middle of the week. This could be related to the fact that the condensation nuclei, which accumulate in the city atmosphere by the end of the week, cause too much of drizzling. However, a more detailed research on the periodical change of condensation nuclei in the urban atmosphere is necessary to further prove this fact.

For EMS, it is not possible to say that there is a clear trend in precipitation over the day of a week between the years 1956-1960. While Mondays and Fridays were the least precipitation days, Thursdays and Sundays were the days of the week receiving most of the precipitation at EMS. Between the years 1995-2000, Tuesdays and Saturdays were the least precipitation days, while Wednesdays were the days with most precipitation. Monday, Thursday and Sunday were days receiving very similar amounts of precipitation (Fig. 4). As seen, there is not a regular distribution of precipitation over the days of the week at EMS.
To observe the variations in the number of each class of precipitation day at AMS and at EMS, they are plotted in Figure 5. Since the data recording by AMS was started in 1926 and data recording by EMS started in 1956, the graphics for AMS cover the period of 1926-2000, and the graphics for EMS cover the period of 1956-2000. To see the number of precipitation days in shorter periods, the averages for each fifteen years are also shown in the graphics. At both AMS and EMS, the number of the precipitation days (> 0.1 mm day -1) and light precipitation days (> 2.5 mm day -1) increase with years (Fig. 5). This shows that there is an increase in the number of low intensity precipitation days around Ankara, which may be due to the change in climate. Çiçek (2003) analyzed the long-term monthly precipitation in Ankara and concluded that there was an increasing trend in the annual and monthly precipitation except for March and September. This increase is statistically significant in April, August and September including the annual precipitation. Türkes (1995, 1996), however, found significant increases in summer precipitation in the Central Anatolian Region. At AMS, the increase in the classes of moderate precipitation (> 6.25 mm day -1) and heavy precipitation (> 2.5 mm day -1) days has continued since 1970. However, there has been a decreasing trend in the classes of moderate and heavy precipitation days since 1985 at EMS. These different trends of moderate and heavy precipitation day classes at AMS and at EMS indicate that due to the urbanization, the number of high intensity precipitation days increased in Ankara.
The classes of precipitation days at two stations were analyzed applying the Mann-Kendall rank correlation test. An increasing trend was observed in the number of precipitation days (> 0.1 mm day -1) starting with 1960 at AMS, and this trend was statistically meaningful at the 95% significance level starting with 1983. The increasing trend at EMS started in 1987 and has been significant at the level of 95% since 1998 (Fig. 6). At AMS, there was an increase in the number of light precipitation days (> 2.5 mm day -1) with a significance level of 95%, since 1988 to the present day. Although there was an increasing trend after the year 1964, it was not statistically significant at EMS. The increasing trend in the number of moderate (> 6.25 mm day -1) and heavy precipitation days (> 12.5 mm day -1) after 1980s at AMS were found not to be statistically meaningful. There was a significant difference between the two stations. As there was an increasing trend at AMS, there was no trend in the class of moderate precipitation days (> 62.5 mm day :) and a decreasing trend in heavy precipitation days (> 12.5 mm day -1) after 1983 at EMS. This remarkable difference in trend of classes of high intensity precipitation days between these two nearby stations can not be accounted for a climatic change. Therefore, it can be concluded that the urbanization induces an increase in the high intensity precipitation day classes in Ankara.
5. Conclusions
The outcomes of the analyses of the precipitation-intensity classes in the warm period (May-September) may be summarized as follows:
• The number of precipitation days at AMS is not higher than that of EMS. However, there is an increase in the total amount of precipitation at AMS in the warm period studied. There is a considerable increase in the number of heavy precipitation days at AMS (the urban station), and this is 50% higher than that in the rural area.
• At AMS Wednesday is the day of the week with most precipitation, however in urban areas the day with least precipitation is Friday. This is related with the increasing condensation nuclei in the atmosphere of the city by the middle of the week. The distribution of precipitation across the days of the week is random in the rural areas.
• In urban areas the days on which there is a risk of heavy precipitation are Tuesday and Wednesday.
• Although there is no salient difference between AMS and EMS with reference to the classes of low intensity precipitation days (0.1 mm day -1 and 2.5 mm day -1) in the long-term, the difference becomes evident in the moderate and heavy classes of precipitation days. This indicates that urbanization has effects on high intensity precipitation rather than on low intensity precipitation. This outcome seems to be in contrast with the findings of Kadioglu (1997). He pointed out that the extreme pollution decreases precipitation and causes significant decreases in extreme preicipitation in the cities. The differences between the results of Kadioglu (1997) and the present study may be due to the fact that Kadioglu studied the whole year. However, only the warm period was considered in the present study. Therefore, a research on the warm period in the Marmara Region may yield different results. Urbanization in the tropics and mid-latitudes was found to be influential on convectional precipitation. It is natural that this may be seen in Istanbul also.
• There was an increasing trend in the number of moderate and heavy precipitation days at the urban station (AMS), but there is a decreasing trend at the rural station (EMS). This difference proves that the increase at AMS was related to urbanization rather than to a climatic change.
• The fact that urbanization increases precipitation in the warm period in an area with a continental climate such as Ankara indicates that these precipitations are rather convectional. The increase in the number of moderate and heavy precipitation days also supports this claim. However, the pluviograph nets should be refined in order to fully determine this in Ankara.
• The increasing effect of urbanization on the number of heavy precipitation days also brings about the problem of floods. Therefore, before implementing the projects such as infrastructure systems which require great investment, the frequency and rate of intense precipitation should be determined in the metropolitan area of Ankara.
• Since the cities in the future will get bigger as a result of increasing population and economic development, the impact of urbanization on precipitation will also be greater. Therefore, it is important that investigations on the urban climatology should be initiated soon.
References
Atkinson, B.W., 1971. The effect of an urban area on the precipitation from a moving thunderstorm. J. Appl. Met. 10, 47-55. [ Links ]
Bornstein, R. and Q. Lin, 2000. Urban heat island and summertime convective thunderstorms in Atlanta: Three case studies. Atmos. Environ. 34, 507-516. [ Links ]
Chandler, T., 1965. The climate of London. Hutchinson, London, 122 p. [ Links ]
Changnon, S. A, R.G.. Semonin and F. A. Huff, 1976. A hypothesis for urban rainfall anomalies. J. Appl.Met 15, 544-560. [ Links ]
Changnon, S. A., 1978. Urban effects on severe local storm at St Louis. J. Appl. Met. 17, 578-586. [ Links ]
Changnon, S. A., R. Shealy and R. Scott, 1991. Precipitation changes in fall, winter and spring caused by St. Louis. J. Appl. Met. 30, 126-134. [ Links ]
Changnon, S. A., 2001. Assessment of historical thunderstorm data for urban effects: The Chicago case. Climatic Change 49, 161-169. [ Links ]
Çiçek, I., 1996. Thorthwaite Metoduna Göre Türkiye'de Iklim Tipleri. Ankara Üniversitesi, Dil ve Tarih-Cografya Fakültesi, Cografya Arasturmalari Dergisi 12, 33-71 [ Links ]
Çiçek, Ý., 2000. Türkiye'de Termik Dönemlerin Yayilisi ve Süreleri. Ankara Üniversitesi, Dil ve Tarih-Cografya Fakültesi Dergisi 40, 1-2, 189-212 [ Links ]
Çiçek, I., 2003. The Statistical Analysis of Precipitation in Ankara, Turkey. Firat Üniversitesi, Sosyal Bilimler Dergisi 13, 1-20. [ Links ]
Dettwiller, I. and H. E. Landsberg, 1974. Inadvertent atmospheric modification, Weather and Climate Modification, Wilmot N. Hess, Ed. John Willy & Sons 755 p. [ Links ]
Gamgam, H., 1998. Parametrik Olmayan Istatistiksel Teknikler. Gazi Üniv. Yay. No: 140, Fen-Ed.Fak. Yay. No: 21. [ Links ]
Huff, F. A. and S. A. Changnon, 1970. Urban effects on daily rainfall distribution. Second Nat. Conf. Weather Modification, Santa Barbara, Amer. Met. Soc., 215-220. [ Links ]
Kadioglu, M., 1997. Sehirlesmenin Marmara Bölgesindeki yagislara etkisi. Su ve Çevre Sempozyumu'97, 2-5 Haziran 1997, TMMOB JMO, Genel yay No. 46, Ist. Sub. Yay. No. 1, 37-46. [ Links ]
Jáuregui, E. and E. Romales, 1996. Urban effects on convective precipitation in México City. Atmos. Environ. 30, 3383-3389. [ Links ]
Lowry, W. P. and F. Probáld, 1978. An attempt to detect the effect of a steelworks on precipitation amounts in Central Hungary. J. Appl. Met. 17, 964-975. [ Links ]
Lowry, W. P., 1998. Urban effects on precipitation amounth. Progress in Physical Geography 22, 477-520. [ Links ]
Sneyers, R., 1990. On the statistical analysis of series of observations. WMO Technical Note 143, Geneva. [ Links ]
Shafir, H. and P. Alpert, 1990. On the urban orographic rainfall anomaly in Jerusalem: a numerical study. Atmos. Environ. 24(B), 365-375. [ Links ]
Tayanç, M. and M. Toros, 1997. Urbanization effects on regional climate change in the case of four large cities in Turkey. Clim. Change. 35, 501-524. [ Links ]
Türkes, M., 1995. Türkiye' de yillik ve mevsimlik yagis verilerindeki egilimler ve dalgalanmalar. Türk Haritaciliginin Yüzüncü Yili TJJB ve TUFUAB Kongreleri Bildiri Kitabi 1-5 Mayis 1995, Ankara C: 3, 694-706. [ Links ]
Türkes, M., 1996. Spatial and temporal analysis of annual rainfall variations in Turkey. Int. J. Climatol. 16, 1057-1076. [ Links ]
Yonetani, T., 1982. Increase in number of days with heavy precipitation in Tokyo urban area. J. Appl. Met. 21, 1466-1471. [ Links ]
WMO, 1966. Climatic Change. WMO Technical Note 79, Geneva. [ Links ]

