


Serviços Personalizados
Journal

Artigo
 Inglês (pdf)
 Artigo em XML
 Referências do artigo
 Enviar este artigo por email
Indicadores
 Citado por SciELO
 Links relacionados
-
 Similares em
SciELO
Similares em
SciELO
Compartilhar

 Permalink
Atmósfera
versão impressa ISSN 0187-6236
Atmósfera vol.18 no.1 Ciudad de México Jan. 2005
Surface energy balance measurements in the
México City region: a review.
A. TEJEDA MARTÍNEZ
Licenciatura en Ciencias Atmosféricas, Universidad Veracruzana, Xalapa, Ver., México
Corresponding author, e-mail: atejeda@uv.mx
E. JÁUREGUI OSTOS
Centro de Ciencias de la Atmósfera, UNAM, Ciudad Universitaria, México, D. F., México
e-mail: ejos@atmosfera.unam.mx
Received July 14, 2003; accepted May 20, 2004
RESUMEN
Las primeras mediciones de balance energético en la Ciudad de México se realizaron en 1985 en un suburbio al poniente de la ciudad (el observatorio de Tacubaya). Ya en la década de los años noventa del siglo XX, dichas observaciones se multiplicaron tanto en el centro histórico (antigua Escuela de Minas y en el edificio de la Preparatoria No. 7), como en otros sitios al sur (en terrenos de Ciudad Universitaria) y en la periferia rural (Plan Texcoco). El propósito de estas mediciones ha sido tener un mejor entendimiento de las alteraciones climáticas debidas a la urbanización. En este trabajo se presenta una revisión de dichas campañas. El reparto de la energía solar disponible es semejante al observado en otras ciudades de latitudes templadas. El contraste máximo se observó entre Texcoco, donde el mayor consumo de energía se emplea en evaporación (durante la estación lluviosa) y el Palacio de Minería donde el flujo de calor latente es tan bajo como en un desierto. La correlación entre las diversas componentes muestra que éstas se pueden estimar por medio de ecuaciones de regresión a partir del valor de la radiación neta. Estos mismos coeficientes constituyen una especie de huella digital que caracteriza el tipo de ambiente: urbano, suburbano o rural.
ABSTRACT
During the last decade of the 20th Century, diverse campaigns for measuring the atmospheric energy balance were performed in downtown México City (School of Mines and Preparatory School No. 7), in the southern suburbs (University Reserve) and in the surrounding rural areas (Plan Texcoco), in addition to a campaign carried out in 1985 in the Tacubaya district, a suburban western peripheral site. The objective was to obtain data for a better understanding of the climatic alterations due to urbanization, particularly to describe the role that the modification of the natural ground cover has played as a result of paving and the construction of urban canyons. In this paper, a review of these campaigns is presented. Energy partitioning in some areas (Tacubaya and Preparatory School No.7) is similar to that observed in urban centers of middle latitudes, whereas the major contrast was observed between Texcoco, with a maximum energy consumption through evaporation, and School of Mines, where the latent heat is as low as in a desert. From the values of the correlations among the different components of energy balance, it may be possible to attempt the modeling of the diverse components of energy balance by means of regression equations starting from the net radiation. Those same coefficients distinguish the type of environment: urban, suburban or rural.
Key words: Land use, energy balance, México City.
1. Introduction
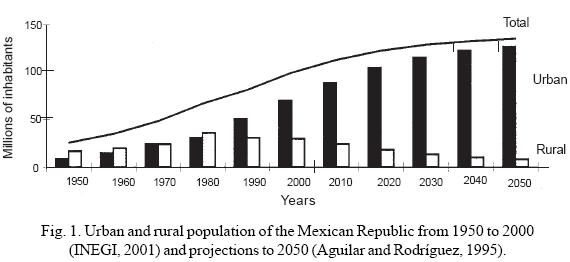
Due to the worldwide growth of urbanization during the 20th Century, the importance of urban climatology has become self-evident. We avoid repeating in worldwide statistics previously published (see for instance Brown and Flavin, 1999), Figure 1 shows the population growth of México from 1950 to 2000 and its projection for 2050. In relative terms, the process is similar to that of any other developing country. The urban population of México was nearly 9 million in 1950 (against 17 million in rural areas); in 2000 it had grown to 60 million (against almost 35 million in rural areas) and, according to Aguilar and Rodríguez (1995). In 2050, 127 million Mexicans will live in cities, with only 8 million in rural areas.
The impact of urbanization on climate has been studied in some detail in the middle latitudes, but there has not been sufficient studied from the point of view of physical climatology, and even less so in tropical latitudes. A bibliographic review on urban climatology for the period 1981-1995 (Jáuregui, 1996) produced more than 800 references, of which 26% may be catalogued as physical climatology, but only 6% of those correspond to tropical and subtropical areas (Table 1). For the México Basin, and for the period 1941-1997, Tejeda and Cervantes (2001) compiled 131 references of publications related to urban climatology, with only 15% referring to physical climatology all practically concentrated within the last two decades of the 20th Century.
Cities are laboratories of atmospheric physics and chemistry. In physics in general, and in the atmosphere in particular, the main interest is to quantify how the laws of the conservation of matter, energy and the mechanical momentum are expresed. The aim of the physical model is, above all, to give form to these general concepts. This is, at the same time, the best way to explain and predict the behavior of atmospheric phenomena.
Oke (1987) refers to it in the following terms: "The classical climatology practiced in the first half of the twentieth century was almost entirely concerned with the distribution of the principal climatological parameters (e.g. air temperature and humidity) in time and space. While this information conveys a useful impression of the state of the atmosphere at a location it does little to explain how this came about. Such parameters are really only indirect measures of more fundamental quantities. Air temperature and humidity are really a gauge of the thermal energy and water status of the atmosphere respectively, and these are tied to fundamental energy and water cycles of the Earth-Atmosphere-system. Study of these cycles, involving the processes by which energy and mass are transferred, converted and stored, forms the basis of modern physical climatology".
Schönwiese (1994) summarizes the alterations of climates due to urbanization in middle latitudes as follows: A decrease in solar radiation from the effects of urban atmospheric contamination, an increase of temperature in the city center with respect to the surroundings, less relative humidity, more annual rainfall, but with a decrease in the frequency of snow; wind velocity decreases but turbulence increases; gases and polluting particles augment, as do condensation nuclei, but atmospheric pollen diminishes.
Such modifications are not necessarily repeated in subtropical or tropical latitudes. In arid zones, through the actions of man, cities may behave as an oasis with lower temperatures, more humidity, fewer polluting particles (due to fewer dust sources), and more solar radiation because of clean air, etcetera. On the other hand, it may be expected that tropical cities surrounded by vegetation suffer modifications like those pointed out by Schönwiese (1994), with some variations originated by both latitudinal and socio-economic differences with respect to the cities in temperate latitudes: a lower height of urban structures; more solar radiation resulting in higher temperatures (with frequent need for cooling rather than heating) and more formation of photochemical smog; less annual thermal contrast, difficulties that may result from less rigid environmental legislation than in developed countries (Niewolt, 1986).
Where, then, theoretically speaking, are we to find the difference that determines the occurrence, or non-occurrence, of urban warmth relative to rural surroundings, the so-called heat island? Fundamentally in the energy balance, that is, how the law of energy conservation behaves. In urban areas surrounded by vegetation, contrasts appear because solar radiation in the rural environment is mainly consumed by the evaporation of water, whereas in cities whose surface areas have less water, the energy is employed mostly to heat structures, which, in turn, is released in part to the atmosphere at night. Thus, it is necessary to get to the bottom of the matter and to analyze how the conservation energy law is expressed at the surface/atmosphere interface in rural and urban environments, as a prior step to the establishment of basis for future modeling of climatic alterations due to urbanization in terms of a conservative variable (energy) in addition to a descriptive variable (like temperature or rainfall). Budyko (1981) considers that one should start from the concept of energy balance in order to postulate eventually a dynamic climatic classification.
Although the campaigns to measure the energy balance that will be discussed in this article are very localized and in no way represent all of Mexico City and its surroundings, they will serve to monitor some parts of the mosaic constituting the city, in order to understand the impact of urban growth and modification in land use on the climate. This is a necessary first step to the modeling of atmospheric energy balance (Ross and Oke, 1988), or of other urban climatic elements, such as the intensity of the heat island that has been simulated by Johnson et al. (1991) and Oke et al. (1991), based on energy balance data. To model the circulation of local urban winds, Sievers and Zdunkowski (1986) and Kerschgens and Kraus (1990) recognize the need for knowledge of the estimates of atmospheric heat and water. On the other hand, Richardone and Brusasca (1989) use the turbulent sensible heat (its diurnal variation and the difference between rural and urban points) to achieve this, in addition to the vertical atmospheric stability and the size of the city. Specifically, for México City, Jazcilevich et al. (2000), have used as parameters of the equation of energy balance to generate the historic evolution of air temperature in the canopy layer in terms of the evolution of urban sprawl and the replanting of the eastern part of the city.
2. Surface layer and data
This investigation explores some of the relationships in the land-atmosphere physical interaction -particularly in the so-called surface boundary layer- at certain points of México City and its rural surroundings. In order to carry out studies of energy balance or of atmospheric stability the thickness of layers that one is able to monitor, should be taken into account. There is no single answer, because each layer or sub-layer is of intrinsic importance in the knowledge of the physical processes in the atmosphere. The surface layer may be deep enough to enable one to visualize the diffusion of contaminants in the local environment, but the dispersion of desert dust or ashes from some volcanic eruption anywhere on the planet goes beyond the planetary layer.
The measuring instruments constitute another restriction. Measuring the energy balance of a large region is feasible with satellite images, but for details it is best to make a direct measurement of the balance components. In urban climatology, provided sufficient sensors to measure vertical and horizontal energy flows are available, it is possible to quantify the energy balance in urban canyons. Núñez and Oke (1977) used the following instruments connected to pen recorders for an urban canyon consisting of a street 7.5 meters wide limited by buildings 5 meters high: 16 radiometers (to measure solar and terrestrial radiation), one lysimeter, 7 net radiometers (for net radiation, to be defined in the following section) and 8 thermometers. They could quantify the role played by the materials and orientation of walls, the surface cover of the street (in this case, grass) and the width and height of the urban canyon in the energy balance. However, the complexity was such that this type of study did not proliferate for long. Nevertheless, they did establish the basis for the theoretical formulation of the problem (Voogt and Oke, 1991; Oke, 1988). Recently, campaigns to measure vertical profiles of wind, temperature and radiation within and above urban canyons, have been performed on the arid urban Negev region in Israel (Pearlmutter et al., 1999), and on a middle latitude city in Switzerland by means of the Basel Urban Boundary Layer Experiment, BUBBLE (Rotach, 2002; Christen et al. 2003; Roth et al., 2003).
A more economical option is to evaluate the energy balance at the upper limit of the urban canyon, that is, from 6 to 10 meters above the flat roofs of the buildings. This intermediate point of view between the global one and the very specific one has the advantage of integrating all elements that are seen in detail in the urban canyon, but also provides fundamental data to calibrate aerial or satellite images or geographical information systems (Grimmond and Souch, 1994) that are useful for studies of the energy balance on a wider scale.
Thus, the data on the energy balance discussed in this work were obtained from the flat roofs of buildings with the exception of the rural and suburban surveys (Fig. 2, Plan Texcoco, and University Reserve), where the rural and suburban surface or roughness layers, respectively, were monitored (Table 2). Comments on the instruments used and the monitoring periods are discussed later.
3. Methods
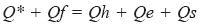
The energy balances discussed in this paper involve the vertical exchanges that result from the partitioning of net radiation (Q*), which is the sum of the turbulent sensible heat (Qh), the turbulent latent heat flux due to evaporation (Qe) and the heat stored in the near surface layer (Qs). Other energy inputs in the system that should be considered in urban atmospheres are the radiation that is absorbed by the smog layer, plus the heat of anthropogenic origin (Qf). Thus, the resulting equation is (Sellers, 1965):
 ...........................................................(1)
Pioneer works in the evaluation of the equation for energy balance in urban places were produced during the 1970's decade, by Núñez and Oke (1977) and Terjung and O'Rourke (1980) e.g. a comparison of energy balance components between urban and rural environments was the experiment conducted in Maryland in 1973 (Landsberg, 1981). It was applied to the urban boundary layer, where the contrasts of ground temperature were clearly observed (26°C in the rural environment against 47°C in the urban environment for the daytime period) and the role of the latent heat from evaporation is 200 times higher in the rural environment than in the urban one. Observations in the urban canopy layer using methods and instruments similar to those discussed for the present paper, have been undertaken by Kalanda et al. (1980), Oke et al. (1992), and Schmid et al. (1991). These authors agree that a short period of measurements (during several weeks) is illustrative if the interpretation of the results fits the synoptic situation prevailing during the measurements.
A point frequently mentioned in the literature (Oke, 1979; Balling and Brazel, 1987; Grimmond and Oke, 1991) emphasizes the role that evapotranspiration plays in the energy balance, above all because urbanization implies changes (e.g. reduction) in the vegetation cover. Thus natural landscapes with vegetation may become barren plains of cement, or in other cases cities with abundant vegetation and water may sprout in the middle of arid areas. In both cases Qe may be different between the rural and urban environment.
With regard to the energy balance campaigns conducted in the Valley of México between 1993 and 1998 ( Table 2), the methods of evaluation and the characteristics of the instruments used in the campaigns are first discussed, and finally the diverse components of the energy balance are compared. The aim is to show that, based on energy balance information from other areas of the city, it may be possible to establish a statistical model of the energy balance in México City.
The methods used to measure the energy balance were the Bowen ratio and turbulent covariance techniques (Tanner, 1988). The data, which will be commented on in this and following sections were stored in memory storage units (21X, Campbell Scientific Inc.), which in turn were employed to program the equipment. The samples were at frequencies of 20 Hertz and the average data from every 15 minutes were stored.
In urban environments the contribution of anthropogenic heat varies from very large to small: for instance, Tokyo (Ichinose, 1999) may reach 400 Wm-2 at noon, and in winter may reach peaks of 1590 Wm-2, but this flux is more typically of the order of 15 to 50 Wm-2 (Oke, 1988). In this paper it was considered that Qf is a remainder absorbed in the other measured components (Table 2).
3.1 Bowen ratio
As it may be observed in Table 2, in field measurements of Plan Texcoco (rural vegetated site) and University Reserve (suburban vegetated), a Bowen ratio energy balance system was used (β), according to the expression:
 ....................................(2)
where Qh is the sensible heat flux and Qe is the latent heat flux from evaporation, ρ is the air density, T is the air temperature in Celsius degrees, q is the specific humidity, z is the height, Lv is the latent heat from evaporation, cp is the specific heat of air at constant pressure, T1'2 are the temperature (°K) at levels 1 and 2 (0.75 m and 2.75 m above ground level), e1'2 are the pressure of water vapor (hPa) values at levels 1 and 2. Kh and Ke are the turbulent exchange coefficients of sensible heat and water vapour respectively, which have been assumed to be equal to each other. The coefficient of 0.508 was calculated for the mean atmospheric pressure in México City.
Both, University Reserve, and Plan Texcoco measurements of Q* (with a net radiometer, Swissteco MKII) and of Qs (through heat flux plates CSIRO, Campbell Scientific Inc.) were available, so that, by combining equations 1 and 2, all terms of Eq. (1) were known.
The Bowen ratio system used (Campbell Scientific Inc.) consists of two temperature chrome-constantan-thermopairs sensors and only one dew point temperature sensor, from which the vapor pressure was derived from the reflection of a light beam off a mirror that becomes blurred when water vapor condenses on its surface. Every five minutes, a pump alternatively sucked air from both, lower level and the upper levels, so the measurements of e1 and e2 in Eq. 2 are not rigorously simultaneous. The different input channels of the data logger Campbell 21 X were calibrated by placing all sensors at the same level in an insulated room, in an attempt to make measurements of temperature and the two of vapor pressure match (Barradas et al., 1999).
It is clear that all signals are actually voltages stored in the acquisition system. These voltages (differences of potential) lead to an external physical ground or to the negative pole at the point of entry of the current that feeds the system; in addition, the data-logger Campbell 21X contains 16 channels where sensors can be installed. Table 3 shows the results of 43 experimental tests carried out in the laboratory. It may be noted that the readings range from highly satisfactory to highly inexact. Thus, during the Plan Texcoco and University Reserve campaigns, the installation of this equipment was done according to the best level of adjustment (minimum standard error of comparison an maximum coefficient of correlation), which, of course, must be previously checked prior to field measurements, so that the standard error in the vapor pressure would be of 0.002 hPa and of 0.006 °C of temperature, if measurements were done simultaneous.
3.2 Eddy covariance
During the field measurements at Preparatory School No.7 and School of Mines (urban sites), the eddy covariance approach was used according to the following expressions:
 .....................................................................................(3)
 ......................................................................................(4)
where ρ is the air density, cp is the air specific heat and Lv is the latent heat of vaporization;  and
and  are the statistical covariances between the vertical wind velocity (w) and the temperature (T), and the specific moisture (q).
The sonic anemometer (Campbell Scientific) can measure vertical wind speeds (w) up to 50 Hz. It is connected to a thermocouple (for measuring T) and to a krypton hygrometer (q), and Q* was measured with the net radiometers, and Qs was obtained by residual in Eq. (1).
3.3 Net radiometer
During the campaigns performed at School of Mines (December of 1993) and Plan Texcoco (August of 1994), some measurements of the net radiation were taken simultaneously every 15 minutes during 10 days; in each case two net radiometers (Swissteco MKII) were placed at heights of 2 and 8 meters over a flat roof (at School of Mines) and over grass (in Texcoco).
Figure 3 shows the results for School of Mines (urban). There is a highly significant linear correspondence between both measurements and the slope of the straight line is 1.1. However, there is and additional term to the net radiation at 2 meters, which indicates that, at that height, the net radiation is underestimated by 9.1 Wm-2, on the average, with respect to that at 8 m. That means that at greater height, the visual field of the instruments involves different surfaces including urban canyons, where the radiation stored in the surface is greater than in a flat surface. It is also remarkable that during the nocturnal period (negative values of net radiation) the adjustment is less good than for the diurnal period, which reinforces the supposition that heterogeneous urban areas produce a heterogeneous mosaic in storing energy. For Texcoco (rural vegetated), on the other hand, the correlation between both sensors was almost perfect, with an independent term close to zero; this means that on homogeneous ground, the height of the net radiometer, at least between 2 and 8 meters for this kind of surface, has practically no influence.
4. Results
4.1 Energy balance
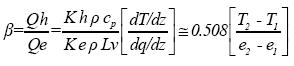
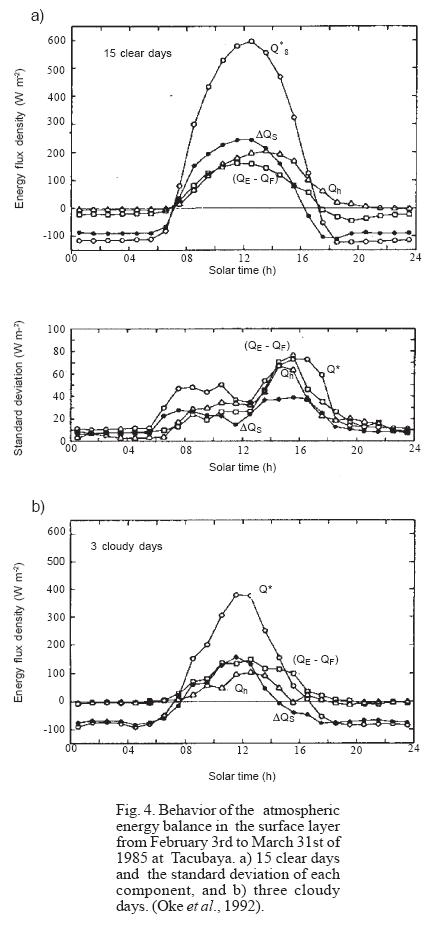
Between February and March of 1985, a tower with instruments reaching 20 meters above street level was installed at the meteorological observatory of Tacubaya (urban site); this was about 8 meters higher than the roof top of the Central Meteorological Observatory or slightly above the upper limit of the roughness layer and already within the surface layer (Oke et al., 1992). The positioning of the sensors of turbulent vertical flows at the other urban stations reported here -school of Mines and Preparatory School No. 7- were very similar.
In the Tacubaya survey a net radiometer was used, and the turbulent heat flux was measured with a sonic anemometer with an attached thermometer, and the flow of latent heat flux was estimated as a residual in the energy balance. The storage of heat in the surface was parameterized and the anthropogenic contribution was estimated at 20 Wm-2. Results are shown in Figure 4. It was observed that for both cloudy and clear days, the orders of magnitude of the vertical sensible and latent heat flows, as well as the storage term, are comparable; and that between the maximum net radiation and the maximum turbulent activity (values higher than the standard deviation of vertical flows) there is a delay of four hours, approximately (Oke et al., 1992).
Discussion of results of the measurements of atmospheric energy balance, carried out in the Valley of México during the last decade of the 20th Century, are shown in Table 2. Measurements were taken at School of Mines (urban) in December of 1993. Most of the days were clear, except at night and at dawn. This can be considered as a campaign representative of the urban environment in the dry season (beneath the sensors, there were flat roofs with red waterproofing; the area is commercial/residential, with scarce vegetation, and the prevailing height of the buildings being 2 and 5 stories).
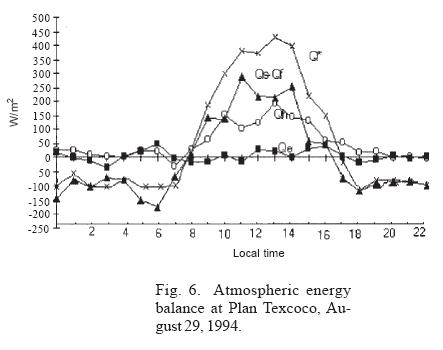
In the summer of 1994 (August) an experiment was conducted at Plan Texcoco (rural vegetated) on swampy ground covered with grass. Since it was the wet season of the year, the days were partially cloudy with occasional rain. The site represents the up wind rural eastern part of Mexico City. The University Reserve is less rural and its surface is of volcanic rock covered with underbrush, on which the measurements were performed during the transition from spring (dry) to summer (wet) in 1995.
Preparatory School No. 7 (urban) is located in an urban area with high density of closely packed 3 to 4 story high buildings, paved ground in more than 90% of the area, and almost without vegetation. Measurements were taken from the 1st to the 14th of December 1998, with clear days and without rain. The wind was weak (around 2 m/s). A net radiometer, one sonic anemometer and a krypton hygrometer were used. Temperature was measured at 0.75, 3.5, 8 and 30 m over the flat roof (which is 10 meters above street level); the relative humidity was measured at 3 m, but the specific humidity at 8 m, and the horizontal wind was also sampled at 8 m.
Some aspects of energy balance observations at School of Mines have already been reported by Oke et al. (1999). Figure 5 shows the daily succession of the components of the energy balance and of the wind at School of Mines. At School of Mines the latent heat from evaporation is clearly less than at Tacubaya (Fig. 4), but at both sites the stored net heat flux is close to the turbulent sensible heat. Finally, both Tacubaya and School of Mines differ markedly from the energy partitioning observed at Plan Texcoco (Fig. 6), where the swampy ground makes the latent heat much greater than the surface sensible and storage heat fluxes.
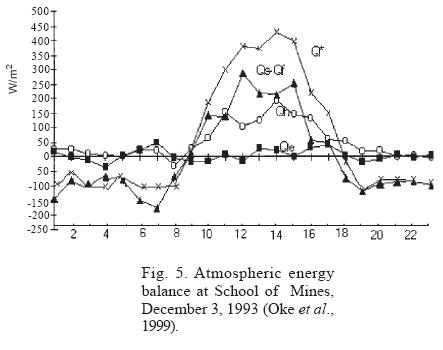
The larger heat storage term at School of Mines (in comparison with Texcoco experimental location) is explained by the surface morphology surrounding the site characterized by closely packed massive buildings and the relative absence of green evaporating areas. This is also evident in the cumulative rates of cooling and heating curves (Figs. 7 and 8). It is also worth noting that atmospheric cooling and heating at Texcoco are more rapid and are circumscribed to the first five or six hours of the day or night (depending on the case), without any further accumulation (heating or cooling) in subsequent hours. At the School of Mines site, on the other hand, the process is more prolonged.
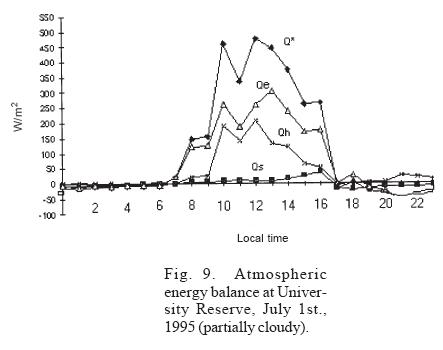
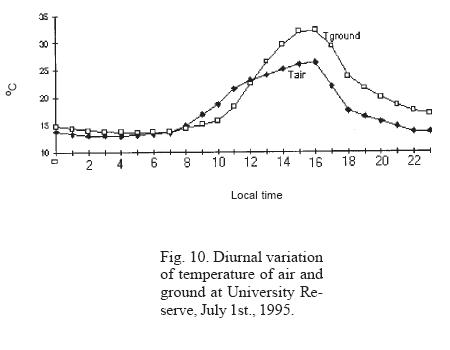
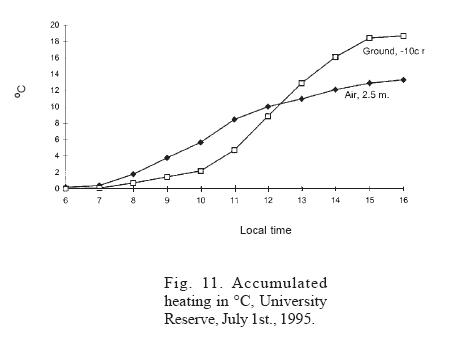
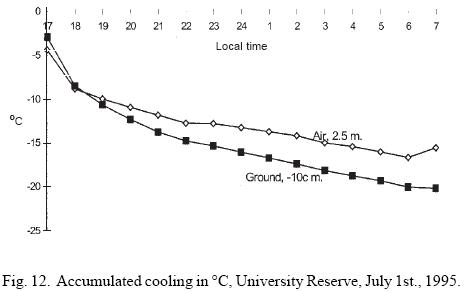
As Barradas et al. (1999) have shown, the behavior of the energy balance in suburban areas with vegetation in México City varies according to the season of the year. The energy partitioning at the University Reserve during a cloudy summer day (rainy season) is illustrated in Figure 9. As illustrated by the Texcoco site (Fig. 6), the heat stored in the surface is rather low, but not so different from sensible and latent heat fluxes. Figure 10 shows that the thermal wave from the ground is notably broader than that of the air; this may be due to the volcanic character of the rock, which has less thermal inertia than the air. Therefore, the cooling and heating rates in the ground are greater than in the air (Figs. 11 and 12).
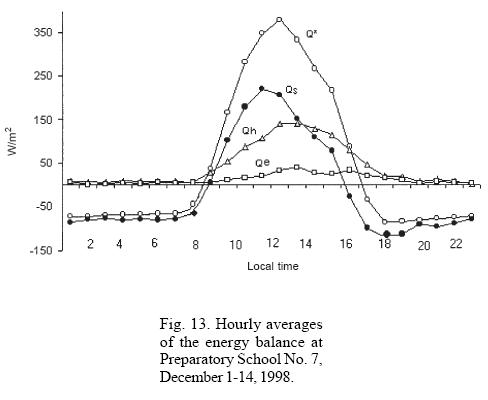
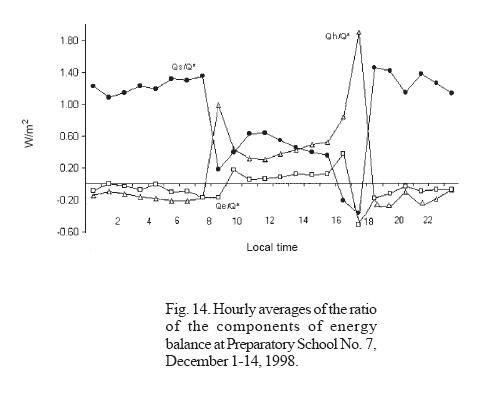
Preparatory School No. 7 (Fig. 13) presents a daily heat flux similar to that of School of Mines (Fig. 5), not only because both surveys were carried out during the cool dry season of the year (December), but also because the areas of influence of the sensors were almost devoid of vegetation, this not withstanding the greater depth of the urban canyon at School of Mines, as was already noted. The sub-surface heating did not exceed 50%, while the expenditure of energy for evaporation was not greater than 20%. The curves for the normalized values of each of the components of the energy balance are shown in Figure 14. The nocturnal value of the heat stored in the surface is clearly noticeable; it is even greater than the absolute value of net radiation and so the quotient Qs/Q* is positive and greater than one, which explains the presence of the nocturnal heat island. During the day the ratio Qe/Q* is positive.
Also during most of the daytime, vertical thermal stability is present, i.e., the temperature at 30 m is higher than the temperature at a height of 3.5 m above the flat roof, except from 12:00 to 16:00 o'clock when the surface sublayer is unstable. Between a height of 3.5 m and 0.75 m, however, a positive (unstable) average difference was maintained; this indicates that the flat roof definitely influences the first 0.75 m layer, but not beyond a level of 3.5 m (Fig. 15). Nevertheless, the vertical component of wind does not show any significant correlation with the different components of the energy balance nor with the vertical thermal gradient between 30 m and 3.5 m over the flat roof (Table 4).
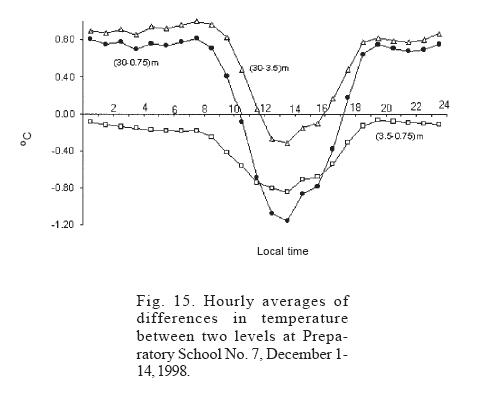
Table 5 summarizes the foregoing observations. Tacubaya and Preparatory School No. 7 showed similar behavior to that detected in the mid-1980's by Oke (1988) in middle latitude urban environments (with larger green areas than those prevailing in the cities of developing countries), the effect of urbanization was attenuated by the proximity of Chapultepec park (450 ha), in the case of Tacubaya, and by the low density of buildings at Preparatory School No. 7. School of Mines, on the other hand, shows a greater impact from the effects of urbanization: The Bowen ratio is very high (8.5), the net expenditure of energy for surface heating is also high (60%), but energy consumption for evaporation is low (5% of net radiation).
In contrast, a high consumption of energy for evaporation (76%) was observed at the Texcoco site, located near a large pond (800 Ha) in swampy terrain during the wet season when measurements were taken. At University Reserve, wet season measurements showed similarly high energy consumption for evaporation (70%); in contrast to those prevailing to Texcoco, however, heat storage by the ground was very low, in all probability because the surface at University Reserve is volcanic rock covered with vegetation. There is a striking similarity in the values of the Bowen ratio for an arid environment between the rural surroundings of Tucson and for the downtown area of México City.
Table 6 illustrates the linear correlation coefficients between each component of the energy balance and net radiation. Considering the large amount of data used to estimate the correlation, the level of reliability turns out to be over 95%. It can be said that, the larger the quantitative relevance of any component (see Table 5), the greater its correlation with net radiation. In other words, the correlation coefficient between the different terms of the equation of balance could be used to classify the environment as urban, suburban or rural. Consequently, by the use of data from other field surveys, it would be possible to implement a statistical model, down by net all-wave radiation, to simulate the spatial and temporal behavior of the energy balance components for the diverse uses and characteristics of the urban surface.
4.2 Hysteresis
Grimmond and Oke (1999) suggest that it is possible to obtain a linear parameter of Qs as a function of Q* and of the temporal variation of Q* (that is, dQ*/dt), thus:
 .......................................................(5)
Eq. (6) is known as an hysteresis equation because it evaluates the lag of sub-surface heating with respect to the course of net radiation. Parameters A, B and C were calculated through regression for the 24 hours of the day corresponding to the complete periods of observation for School of Mines, Texcoco and University Reserve, with
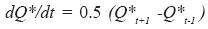 ..........................................................(6)
where Q*t+1 and Q*t-1 indicate that the data are one hour ahead and one hour before, respectively, with respect to the instant for which the evaluation was made. A in Eq. (6) indicates the degree of association between Q* and Qs (at maximum when A = 1); B is the coefficient of retardation of Qs with respect to Q* (0 means there is no retardation), and C is the displacement of the Qs zero point with respect to Q*.
Table 7 shows some comparisons for sites in other latitudes. As noted in previous sections, the heat stored in the ground at Texcoco and University Reserve sites is practically independent of net radiation because Qs is small, due to the reduced relevance of the A value. Likewise, Texcoco and University Reserve shows a relatively low level of adjustment (R2 less than at other sites).
The observed phase-lag between Q* and Qs for Preparatory School No. 7 may be explained by the low proportion of green areas, where sites with vegetation show negative values (which would mean that Q* laggs behind with respect to Qs). It should be noted, however, that the value of Qs is negligible for these sites: less than 10% of Q* for diurnal periods against values of 40% to 60% for the rest of the sites (Table 8). For this reason the estimated lag of Q* relative to Qs is not physically significant.
5. Conclusions
The magnitudes and variations of the atmospheric energy balance at Tacubaya and Preparatory School No. 7 sites are similar to those observed in middle latitudes (with a greater proportion of green areas than in tropical urban centers), due to the proximity of Chapultepec park at the Tacubaya site and to the low density of buildings around Preparatory School No. 7. The high Bowen ratio value at School of Mines (8.5) may be explained by the greater urbanization and the greater depth of urban canyons than at Tacubaya and Preparatory School No. 7. Note that in downtown México City the Bowen ratio is similar to that observed in rural desert environments (the surroundings of Tucson, for example).
The marshy ground at the Plan Texcoco site during the wet season and the vegetation covering the volcanic rocks at University Reserve site explain the evaporative energy consumption at these sites higher than 70% of the net radiation.
Likewise, the large observed hysteresis or phase-lag (retardation between the maxima of Q* and Qs) that occurs in the city center (Preparatory School No. 7 and School of Mines sites) is due to the scarcity of green areas. In contrast, for sites covered with vegetation (University Reserve and Texcoco) hysteresis is very small and negative but lacks physical significance, due to the low values of Qs.
Starting from the values of the correlations between the various components of the energy balance (Table 6), one perceives the possibility of attempting to model the diverse components of the energy balance by means of regression equations, with the net radiation as the downward flux. Those same coefficients are actually almost distinctive of the type of environment: urban, suburban or rural.
At the Preparatory School No. 7 site, the positive values that are greater than one for the ratio Qs/ Q* are the result of the storage of heat in the city center that gives rise to the urban heat island (for more details, see Jáuregui and Luyando, 1998). In the surface layer, vertical stability is not significantly related to the ascent or decent of air; therefore, it may be concluded that, in this layer, convection at the site stems mainly from forcing by roughness rather than from the availability of thermal energy
Acknowledgements
The authors are grateful to E. Luyando, D. Rivas-Camargo and M. Casasola for handling of data and making of tables and graphics. Monitoring of the experiments was responsibility of V. Zarraluqui and W. Gutiérrez (Preparatory School No. 7), R. Saldaña and U. Miranda (School of Mines and Texcoco), and V. Barradas (University Reserve). The authors are grateful for the translation to Mrs. Irene Marquina S. and Mr. Warren Haid, and would like to thank to Dr. D. Fitzjarvald one of the reviewers for his suggestions to improve the text.
References
Aguilar, A. G. and F. Rodríguez, 1995. The dispersal of urban growth in Mexico, 1970-1990, J. United Nations Center for Regional Development 1, 1-26. [ Links ]
Barradas, V. L., A. Tejeda-Martínez and E. Jáuregui, 1999. Energy balance measurements in a suburban vegeted area in Mexico City. Atmos. Environ. 22, 4109-4113. [ Links ]
Balling Jr., R. C. and S. W. Brazel, 1987. The impact of rapid urbanization on pan evaporation in Phoenix, Arizona, J. Climatol. 7, 593-597. [ Links ]
Brown, L. R. and C. Flavin, 1999. A new economy for a new Century. In State of the World 1999. A Worldwatch Institute Report on Progress Toward a Sustainable Society. (Starke, L. Editor). WW. Norton and Company, NY. 3-21. [ Links ]
Budyko, M. I., 1981. The Earth's climate: past and future. Academic Press, N. Y. 320 p. [ Links ]
Christen A., C. Bernhofer, E. Parlow, M. W. Rotach, and R. Vogt, 2003. Partitioning of turbulent fluxes over different urban surfaces. Fifth International Conference on Urban Climate, September 1-5 2003, Lodz, Poland. Paper O.10.4, 4p. [ Links ]
Grimmond, S., 1991. Comparisons of measured summer suburban and rural energy balances for a hot dry city, Tucson, Arizona. Preprints of 10th. Conference on Biometeorology and Aaerobiology. Salt Lake City, September, 10, 69-72. [ Links ]
Grimmond, S. and T. R. Oke, 1991. An evapotranspiration-interception model for urban areas. Water Res. 27, 1739-1755. [ Links ]
Grimmond, C. S. B. and C. Souch, 1994. Surface description for urban climate studies: a GIS based methodology. Geocarto International 1, 47-58. [ Links ]
Grimmond, C. S. B. and T. R. Oke, 1999. Heat storage in urban areas: local-scale observations and evaluation of a simple model J. Appl. Met. 38, 922-940. [ Links ]
Ichinose, T., K. Shimodozono and K. Hanaki, 1999. Impact of anthropogenic heat on urban climate in Tokyo. Atmos. Environ. 33, 3897-3909. [ Links ]
INEGI (2001). XI Censo general de población y vivienda 1990 and XII Censo general de población y vivienda 2000. http://www.inegi.gob.mx (reviewed 03/02/2003). [ Links ]
Jáuregui, E., 1996. Bibliography of urban climatology for the period 1992-1995. World Meteorological Organization WMO/TD No. 759. Geneva, 61 p. [ Links ]
Jáuregui, E. and E. Luyando, 1998. Long-term association between pan evaporation and the urban heat island in México City. Atmósfera 11, 45-60. [ Links ]
Jazcilevich, A., V. Fuentes, E. Jáuregui and E. Luna, 2000. Simulated urban climate response to historical land use modification in the basin of México. Clim. Change 44, 515-536. [ Links ]
Johnson, G. T., T. R. Oke, T. J. Lyons, D. G. Steyn, I. D. Watson and J. A. Voogt, 1991. Simulation of surface urban heat islands under 'ideal' conditions at night: theory and tests against field data. Boundary-Layer Met. 56, 275-294. [ Links ]
Kalanda, B. D., T. R. Oke and D. L. Spittlehouse, 1980. Suburban energy balance estimates for Vancouver, B.C., using the Bowen Ratio-Energy Balance approach. J. Apl. Meteor. 19, 791-802. [ Links ]
Kerschgens, M. J. and H. Kraus, 1990. On the energetics of the urban canopy layer. Atmos. Environ. 24, 321-328. [ Links ]
Landsberg, H. E., 1981. The urban climate. Academic Press, N.Y. 275 p. [ Links ]
Niewolt, S., 1986. Design for climate in hot humid cities. In: Urban climatology and its applications with special regard to tropical areas. WMO No. 652., 514-534 p. [ Links ]
Núñez, M. and T. R. Oke, 1977. The energy balance of an urban canyon. J. Appl. Meteor. 16, 11-19. [ Links ]
Oke, T. R., 1979. Advectively-assisted evapotranspiration from irrigated urban vegetation. Boundary-Layer Met. 17, 167-173. [ Links ]
Oke, T. R., 1987. Boundary layer climates. Mathuen, New York, 435 p. [ Links ]
Oke, T. R., 1988. The urban energy balance. Progress in Phys. Geogr. 12, 471-508. [ Links ]
Oke, T. R., G. T. Johnson, D. G. Steyn and I. D. Watson, 1991. Simulation of surface urban heat islands under 'ideal' conditions at night: diagnosis of causation. Boundary-Layer Met. 56, 339-358. [ Links ]
Oke, T. R., G. Zeuner and E. Jáuregui, 1992. The surface energy balance in Mexico City. Atmos. Environ. 26, 433-444. [ Links ]
Oke, T. R., R. A. Spronken-Smith, E. Jáuregui and C. S. B. Grimmond, 1999. The energy balance of central Mexico City during the dry season. Atmos. Envir. 22, 3919-3930. [ Links ]
Pearlmutter, D., A. Bitan and P. Berliner, 1999. Microclimate analysis of "compact" urban canyons in an arid zone. Atmos. Envir. 33, 4143-4150. [ Links ]
Richiardone, R. and G. Brusasca, 1989. Numerical experiments on urban heat island intensity. Q. J. R. Meteorol. Soc. 115, 983-995. [ Links ]
Ross, A. L. and T. R. Oke, 1988. Tests of three urban energy balance models. Boundary-Layer Met. 44, 73-96. [ Links ]
Rotach, M. W., 2002. Overview of the Basel urban Boundary Layer Experiment. Proc. 4th Sym. Urban Envir., Norfolk VA, 25-26. [ Links ]
Roth, M., J. Salmond, A. N. V. Satyanarayana, A. Christen, R. Vogt and. T. R. Oke, 2003. Turbulence characteristics, similarity and CO2 (co)spectra over an urban canyon. Fifth International Conference on Urban Climate, September 1-5 2003, Lodz, Poland. Paper O.10.1, 3 p. [ Links ]
Schmid, H. P., H. A. Cleugh, C. S. B. Grimmond and T. R. Oke, 1991. Spatial variability of energy fluxes in suburban terrain. Boundary-Layer Met. 54, 249-276. [ Links ]
Schönwiese, C. D., 1994. Klimatologie. Verlag Eugen Ulmer Stuttgart. Stuttgart, 350 p. [ Links ]
Sellers, W. D., 1965. Physical climatology. University of Chicago Press, 272 p. [ Links ]
Sievers, U. and G. Zdunkowski, 1986. A microscale urban climate model. Beitr. Phys.Atmosph. 59, 3-40. [ Links ]
Tanner, B. D., 1988. User requirements for Bowen Ratio and eddy correlation determination for evapotranspiration. Proc. of the 1988 Speciality Conf. of the Irrigation and Drainage Division, Am. Soc. of Civil Engineers. 11p. [ Links ]
Tejeda, A. and J. Cervantes, 2001. Una (re)visión bibliográfica de la climatología del Valle de México; 1941-1997. Serie Varia (Nueva Época), Núm. 2, Instituto de Geografía, UNAM, 51 p. [ Links ]
Terjung, W. H. and P. O'Rourke, 1980. Influences of physical structures on urban energy budgets. Boundary-Layer Met. 19, 421-439. [ Links ]
Voogt, J. A. and T. R. Oke, 1991. Validation of an urban canyon radiation model for nocturnal longwave fluxes. Boundary-Layer Met. 54, 347-361. [ Links ]

