


Servicios Personalizados
Revista
Articulo
 Inglés (pdf)
 Artículo en XML
 Referencias del artículo
 Enviar artículo por email
Indicadores
-
 Citado por SciELO
 -
 Accesos
Links relacionados
-
 Similares en
SciELO
Similares en
SciELO
Compartir

 Permalink
Atmósfera
versión impresa ISSN 0187-6236
Atmósfera vol.17 no.4 Ciudad de México oct. 2004
ENSO-tuna relations in the eastern Pacific Ocean and its
prediction as a non-linear dynamic system
J. SUÁREZ SÁNCHEZ
Posgrado en Ciencias Ambientales, Departamento de Agrobiología,
Universidad Autónoma de Tlaxcala
Av. Universidad 1, Tlaxcala, Tlax., 90000, México,
W. RITTER ORTIZ, C. GAY GARCÍA
Centro de Ciencias de la Atmósfera, UNAM, Ciudad. Universitaria, D. F., 04510, México
e-mail: walter@atmosfera.unam.mx
J. TORRES JÁCOME
Posgrado en Ciencias Ambientales, Benemérita Universidad Autónoma de Puebla
Puebla, México
RESUMEN
Utilizando la información del periodo de 1967 a 1994 de las abundancias trimestrales del atún aleta amarilla (Thunnus albacares) para el Océano Pacífico Oriental (OPO), publicadas por la Comisión Interamericana del Atún Tropical (CIAT) y expresadas en número de individuos por grupo de edad y cohorte se calculó la biomasa por trimestre de esta especie. A esta información se le aplicaron métodos gráficos (gráficas de datos crudos, de espacio de fases, de subseries por trimestre y promedios anuales) para identificar el comportamiento de la dinámica de esta variable y utilizando la información sobre la presencia del Niño-Oscilación del Sur (ENOS) para ese mismo periodo, se identifican las relaciones entre la dinámica de la biomasa del atún en el OPO y ENOS, observándose que la presencia de ENOS clasificados como fuertes corresponden a descensos en la biomasa del atún seguidos por un incremento rápido de esta variable en una relación en tiempo de 3:1. Es decir que el tiempo que dura el descenso de la biomasa es de tres unidades en relación a la recuperación a valores similares o superiores. Una vez identificadas las relaciones entre ENOS-atún se procedió a ajustar dos tipos de modelos a la información de la biomasa del atún: redes neuronales y ARIMA, observándose que los dos modelos describen de manera adecuada la dinámica de la biomasa del atún y que el modelo ARIMA también permite pronosticar adecuadamente el comportamiento de dicha variable, destacando que con este modelo se pronosticó correctamente la presencia de ENOS de 1997.
ABSTRACT
During the years between 1967 and 1994 the trimestral abundance of the yellowfin tuna fish (Thunnus albacares), expressed as the number of individuals per group age and cohort, for the Eastern Pacific Ocean (EPO), was used to calculate the biomass of this species per trimester. This information was obtained from the Inter-American Tropical Tuna Commission publications (ITTC). Graphic methods were applied to this data (crude data, phase space, subseries per trimester as well as annual averages) in order to identify the behavior of the dynamics of this variable; this data was correlated with information on the presence of El Niño Southern Oscillation (ENSO) for the same period. The analysis suggests that the presence of strong ENSO events correlate with the decline of tuna fish biomass, which is followed by a rapid increase of this variable in a 3:1 time ratio; this means that it takes three times as long for the biomass to decrease than it does to recover and return to similar or higher values. After the ENSO-tuna fish biomass relations were established, two types of models were adjusted to the tuna fish biomass information: neuronal network and ARIMA. Both models described adequately the tuna fish biomass dynamics; however, the ARIMA model also permitted an adequate prediction of the behavior of ENSO variable, emphasizing that this model correctly predicted the presence of 1997 ENSO.
Key words: Yellowfin tuna fish (Thunnus albacares), El Niño/Southern Oscillation (ENSO), non-linear dynamic system.
1. Introduction
The El Niño Southern Oscillation (ENSO) phenomenon is considered the main cause for inter-annual climatic variability around the globe. The economies of many countries, mainly in tropical regions, depend on the presence of this phenomenon. Therefore, it is important to have the means to allow predictions regarding time, intensity and potential damage.
This phenomenon can last from a few months to one or two years, with catastrophic consequences for the fishing industry. On dry land, these changes are accompanied by increased rainfall which devastates crops, causes soil displacement and floods in coastal regions, as well as droughts in places where rainfall is common, etc.
The periodicity of the anomaly is not cyclic, with lapses between events of three to seven years; its life cycle also varies between one event and the next. The variability of ENSO regarding the time of occurrence, duration, intensity and recurrence seriously complicates the possibility of prediction.
The ENSO phenomenon is mainly due to the coupling of the ocean and the atmosphere in the tropical Pacific Ocean, where crucial interaction takes place.
Various species of economically important fish, such as yellowfin tuna fish (Thunnus albacares), can be found in the tropical Pacific Ocean. The abundance of this species, both in space and time, is highly related to water temperature and food availability. To a certain degree, the water movement related to ENSO in the Eastern Pacific Ocean (EPO) determines the distribution of water temperature and the abundance and food availability for tuna fish in this area.
The purpose of this study is to identify this relationship in the EPO by correlating the distribution of tuna-fish biomass with ENSO. For this purpose, non-linear dynamic system prediction techniques were used to evaluate tuna fish biomass and to predict, based upon the identified relationships, tuna fish production as well as the presence of global interaction with ENSO.
2. Factors that determine tuna fish distribution and abundance
Species distribution and abundance are determined by their natural environment. Each environmental condition has its optimal point and its tolerance limits, and any factor outside the optimal margin will cause tension, which may limit growth, reproduction or even threaten the survival of the population. There is a limiting factor to each population and when, for some reason, this factor is displaced towards its optimal point, another limiting factor immediately arises (Nebel and Wrigth, 1999).
Tuna fish distribution and abundance mainly depends on two environmental factors: water temperature and food availability (Blackburn, 1965, 1969; Ritter et al., 1982; Díaz, 1992; Lehodey et al., 1997; Ortega, 1998).
2.1 Temperature
Through the analysis of fishery and environmental variables using a multivariate analysis technique, it has been established that tuna fish distribution and abundance is closely associated with physical changes in the ocean, such as temperature changes, storms (length and magnitude or intensity) and ENSO, as well as with variations in the mixing depth layer and disturbances caused by the wind (Díaz, 1992).
Tuna fish can be found between 17°C and 31°C with a mode at 28°C, although it is generally distributed in places where the temperature is above 20°C without considering the presence of food (Ortega, 1998). On a larger scale, tuna fish distribution is determined by ocean temperature (Mullen, 1992). Surface temperature and depth of the 20°C and 15°C isotherms are environmental variables significantly related to tuna fish abundance (Ortega, 1998). There is a strong relation between tuna fish abundance and thermal structure (surface temperature, depth of the mixing depth layer, depth and strength of the thermocline).
Tuna fish spawn between 26° N and 14° S, and from the littoral to 140° W. between 0° and 20° N it occurs continuously throughout the year, without marked variations in its intensity. To the north of 20°N spawning takes place mainly between July and November, when the sea surface temperature (SST) surpasses 24°C. The proportion of reproductively active females in this area correlates with the monthly SST. The 85.3% of the spawning occurs between 26°C and 30°C (Ueyanagi, 1978; Schaefer, 1998).
2.2. Food availability
Because tuna fish is attracted by food, their distribution in the water column is determined by the amount of food available (Shimada and Schaefer, 1956). Tuna concentrates in high productivity areas, such as upwelling zones, around islands or at current interfaces (Joseph, 1970; Lehodey et al., 1997); so the relative densities of the fish follow the distribution of primary production with different delays in time interval (Ritter and Guzmán, 1982; Ortega, 1998).
3. El Niño and the Southern Oscillation (ENSO)
During the 1960 's and 70 's, most oceanographers referred to the large scale warming of the western and central equatorial Pacific as El Niño. This anomalous warming was later associated with anomalies in the thermal structure of the surface of the ocean throughout the equatorial Pacific. At the same time, scientists discovered that the southern oscillation was closely related to the large scale changes in the tropical Pacific Ocean. In other words, the southern oscillation represents the variability of the Walker circulation in the tropics of the Indo-Pacific and manifests as a displacement of the convection above the continent, while being associated with large scale anomalies in the superficial winds and sea level pressure throughout the tropical Pacific (and within the Indian Ocean).
At the beginning of the 1980's, it became clear that El Niño and the Southern Oscillation were closely related, that the large scale warming (El Niño) was coordinated with a relaxation of the trade winds throughout the Pacific Ocean and the displacement of the atmospheric convection of the central Pacific and the continent. Scientists named this inter-annual climatic phenomenon ENSO. In this same decade, theoretical studies revealed that ENSO is a phenomenon that results from the coupling of the ocean and the atmosphere, and that the crucial interactions occur in the tropical Pacific (Battisti and Sarachik, 1995).
In the presence of EN, the surface temperatures of the Pacific show positive deviations with respect to the mean which are lower in the western region in comparison to the east; the sea level also shows positive deviations with respect to the mean in the eastern region, while they are negative in the west.
4. Fishery modeling
Even though fishing has been a human activity since the beginning of civilization, its scientific management is quite recent. The pioneering models on fishery management were proposed by Verhulst (1938) and Schaefer (1954), the first based on logistic equations while the second on production. Modifications of these two models have arisen, such as those proposed by Fox (1975) on Verhulst, and those set forth by Pella and Tomlinson (1969), Walter (1969) and Schnute (1977, 1985) carried out on Schaefer's production model.
In the beginning, the models used for the study of fisheries were based on the estimation of abundance; models that emerged included: tagging and recapture, capture by effort unit, differential mortality and virtual population (Watt, 1968). Later studies centered on population dynamics. Models for the analysis of fish population dynamics can be classified in four large groups: the surplus production model (Schaefer, 1954) which uses production as its only variable; the analytical model (Ricker, 1958), which considers the population as the sum of the implicit characteristics of its individuals; the time series models (Bazigos, 1983; González, 1986; Sun and Yeh, 1998), which use statistical methods to analyze the population's historical magnitudes; and the relationship models, which relate the resource with the environment (Ritter and Guzmán, 1979, 1982, 1984; Ritter et al., 1982,1985; Díaz, 1992; Ortega, 1998).
5. Methodology
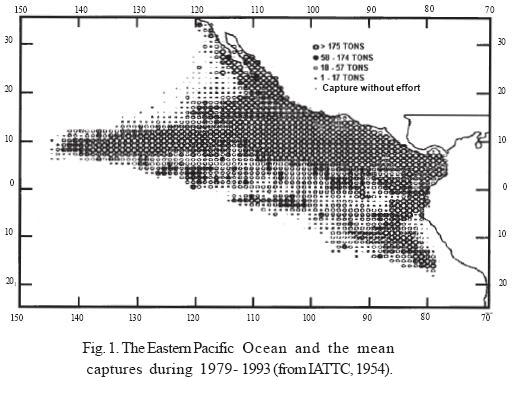
The study was carried out in the Eastern Pacific Ocean (EPO), defined as the area between the littoral of the Americas and 150°W and the latitudes comprised between northern Baja California (33°N) and northern Chile (20°S) (Fig. 1).
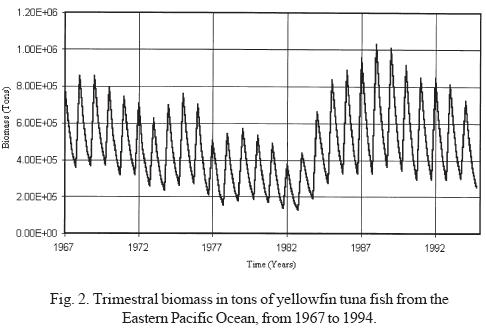
Yellowfin tuna fish biomass was estimated for the EPO at one trimester intervals (Fig. 2), comprising the period between 1967 and 1994, using data on the average number of tuna fish per age group and the weight-age ratio, as published by the Inter-American Tropical Tuna Commission (1995).
In order to identify behavioral patterns, graphs were elaborated using crude data of tuna biomass, subseries and phase spaces for each trimester as well as annual averages. The identified behavior was graphically related to the presence of ENSO events.
In order to simulate the behavior of tuna fish biomass dynamics, two models were adjusted at trimestral and yearly intervals: neuronal networks and ARIMA.
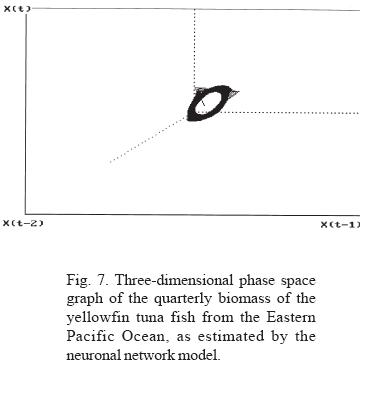
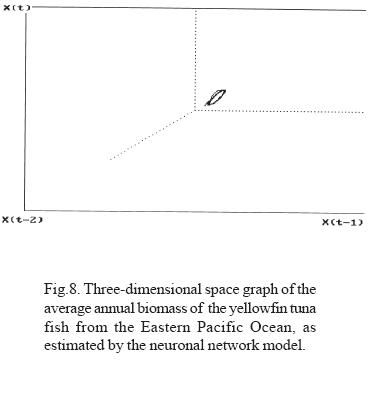
The neuronal network model was adjusted with the professional version of the Chaos Data Analyzer from the University of Wisconsin; this permits the analysis of a simple artificial neuronal net, where each term in a time series is supposed to be given by a superposition of the previous n terms and the weight is determined by the best possible adjustment of existing data. The net "learns" by varying the weight to minimize the error. Non-linearity is introduced by compressing the input data using a sigmoidal function with value limits in the range o -1 and 1. It uses the tanh(x) comprehension function. The network has only two layers (input and output) and no hidden layers. In order to adjust the ARIMA model, the Stat Graphics Plus Ver. 5.0 program was used. With the adjusted neuronal network, phase space graphs were elaborated to identify the long term behavior of the system.
Different lengths in the time series of the trimestral biomass were used to contrast the efficiency of the models estimated for the prediction.
6. Results and discussion
Through the analysis of the trimestral information on the biomass of the yellowfin tuna fish (Thunnus albacares) in EPO, in the period between 1967 and 1994, two types of fluctuations can be observed (Figs. 3, 4 and 5):
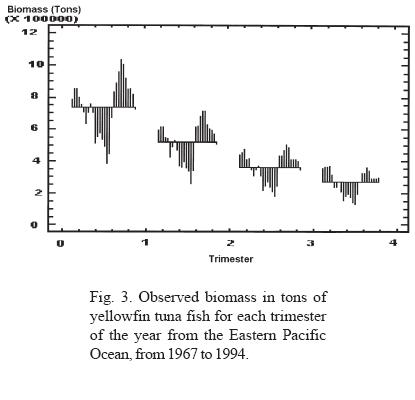
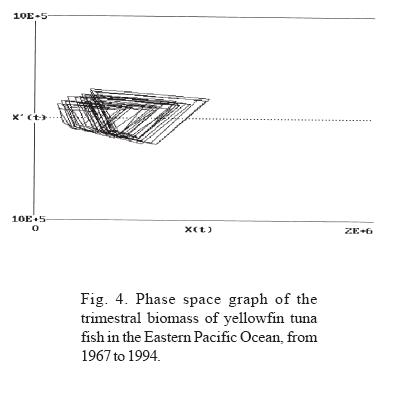
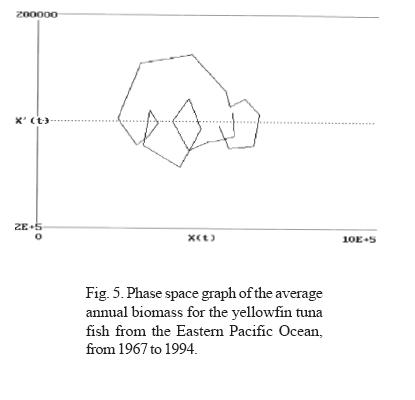
a) In all the years analyzed, an iterative annual fluctuation exists in which each trimester shows a severe decline, followed by a period of recovery that coincides with the first trimester of each year; time of year in which the highest values of phyto and zooplankton productivity are registered (Ritter and Guzmán, 1982; Ortega, 1998). This confirms that in the short term (one year), the highest concentration of tuna fish biomass depends on food availability. The annual periodicity is shown in the phase space graphs, where the formation of closed figures can also be observed.
b) Persistent oscillations with nine year duration and an alternate positive or negative manifestation are also observed (Fig. 3). From 1976 to 1983, negative anomalies with respect to the average values were manifested, while positive anomalies were observed from 1985 to 1993. Interestingly, the time period that corresponds to the negative anomalies includes some ENSO periods; it is observed that the beginning of the negative manifestation coincides with the ENSO period observed in 1976-77, and ends after the manifestation of a very strong ENSO in 1982-83, the year in which the highest values of the negative anomaly are obtained. These data allow us to infer that the ENSO phenomenon affects pelagic fisheries such as tuna. It could be said that the 1976-77 ENSO created the negative conditions that reinforced to become the strong ENSO of 1982. It may also be considered that the shadow of the strong 1982 ENSO was manifested with great anticipation until it gained its maximal expression; however, as soon as it stopped, the resilience of the return to conditions of equilibrium with a higher carrying capacity was strongly expressed, as can be seen in the time lapse between 1983 and 1988, when the carrying capacity showed conditions similar to or greater than those present before the beginning of the long decline beginning in 1969 (Figs. 2, 3 and 6). This power of recovery indicates that nature has long but slow periods of decline, but is very fast in its manifestations of recovery; it took 13 years for productivity to decline to its lowest levels, however maximum productivity was recovered in only three years to levels greater than those observed before.
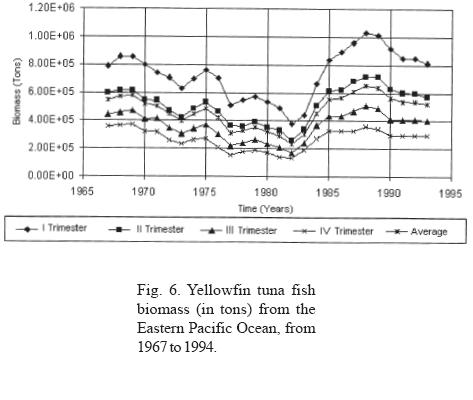
The average annual biomass data (Fig. 6) indicates that the lowest biomass values were obtained in 1982, coinciding with the presence of an ENSO phenomenon classified as strong. Likewise, the annual biomass phase space graph shows a periodicity of approximately 14 years (Fig. 5). If the average lapse between the beginning an the end of strong El Niño events recorded between 1763 and 1982 (Artz and Fahrbach, 1996) is calculated, we see that they occur on average every 12.17 years with a standard deviation of 4.54 years; this time lapse and that of the 14 years observed for biomass productivity are not statistically different. From this we can infer that periodicities are related.
Through the adjustment of the neuronal network model for biomass and its extrapolation, a toroid is produced in the phase space graph; Sametband (1994) demonstrated that this is the result of two forces, which we can assume to be the trimestral fluctuation of the phyto and zooplankton abundance, and the long term manifestation of strong ENSO. The relation between the periods of the observed toroid classify it as a cuasi-periodic dynamic system, an observation that coincides with Poincaré 's observations in 1899, that indicate that nature generally manifests itself as a system of this type. In these systems, the initial conditions determine the trajectory.
Different seasonalities were tested considering the observed periodicities in the dynamics of tuna fish biomass, showing that the models that best describe the trimestral and annual biomass dynamics were ARIMA (0,0,0,1,1,0)28 (Table 1) and ARIMA (0,0,0,1,1,0)7 (Table 2) respectively.
The different adjusted models describe the same behavioral pattern for tuna fish biomass dynamics, indicating that this pattern is not the result of the employed methods.
The analysis of the strength of the models employed shows that even though the neuronal network model describes well the behavior of both periodicities, the predictions vary when different lengths of time series are used. On the other hand, the ARIMA model describes well the behavior of the periodicities and the predictions are closer to each other even when different lengths in time series are used (Table 3, Figs. 9 and 10).
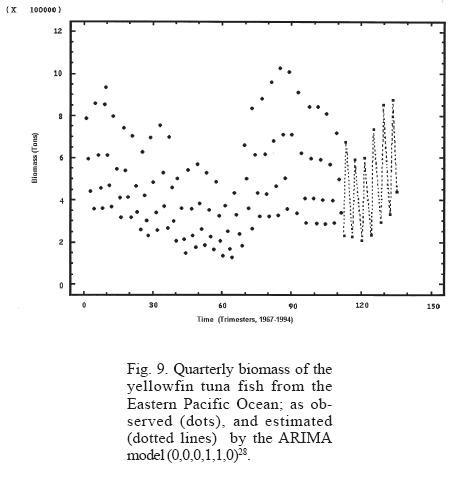
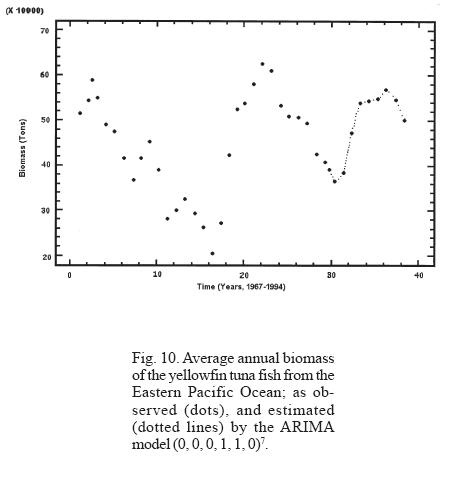
The neuronal network and the ARIMA model adjusted to the tuna fish biomass describe well the general features of the observed pattern; however, for the prediction of particular situations, the neuronal network model has the tendency of diverging from the real values in the course of time. In this sense, the use of the ARIMA model is more convenient and advisable for the purpose of predicting strong ENSO events and/or administrating the tuna fish resource.
An extraordinarily strong ENSO, similar to the one registered in 1982, occurred in 1997. The lack of up-to-date information (available information covers up to 1994) encouraged us to simulate and predict the behavior of tuna fish resource to the year 2004. The same type of slow but continuous decline in the abundance can be observed from the period of maximum recovery in 1988, until it reached its lowest point in 1997, a period lasting 9 years (Figs. 9 and 10). This dynamics is simulated and predicted almost exactly, even to its smallest detail, by the models used (neuronal networks and ARIMA), indicating the high consistency of non-linear statistical models for the representation of nature at the macroscale and long term levels. These results exceed by far the linear models that had been employed until now, as predicted by R. May during the 1970's (Suarez, 2000). We would have to wait many years to verify the usefulness of these methodologies under considerations of a drastic change of the characteristics of the initial conditions. Meanwhile, we wish to point out that a phenomenon as drastic as the 1997 ENSO could have been anticipated with these models at least three years in advance. This brings into consideration that a great disturbance is not necessary for it to affect tuna fish abundance, because when the tuna fish resource is considered in its totality, the manifestation of small environmental fluctuations are expressed in a magnitude similar to the decline in the abundance of this resource. It is important to point out that the models are sensitive enough to predict when the expected extreme value will occur and when the period observed between each decline differs by four years.
7. Conclusions
The following conclusions can be made from the analyzed results regarding the biomass dynamics of the yellowfin tuna fish (Thunnus albacares) in the Eastern Pacific Ocean and its relation to ENSO.
• The tuna fish biomass dynamics shows two periodicities: one annual and one of approximately 14 years. The first is associated with phyto and zooplankton fluctuations, and the second one to strong ENSO phenomena.
• Both periodicities show a slow and prolonged decline and a fast recovery, with a 3:1 rate in the time interval between decline and recovery.
• In the phase-space graph, tuna fish biomass describes a cuasi-periodic toroid (atractor), that behaves in a non-random manner and is sensitive to the initial conditions. Non-linear models, such as neuronal networks and ARIMA, identify and describe well these periodicities.
• Tuna fish abundance is influenced by the environment; through the prediction of this abundance and the use of the models described yield to the prediction of environmental manifestations, such as the strong 1997 ENSO, with an anticipation of at least three years.
• The ARIMA (0,0,0,1,1,0)28 and the ARIMA (0,0,0,1,1,0)7 are the best models to predict the tuna fish biomass dynamics per trimester and its annual average respectively.
• The identification and prognosis for the behavioral pattern of tuna fish biomass will allow us to analyze the dynamics of tuna fish biomass under different conditions of natural or man induced disturbances in order to develop a proposal towards a more rational use of this resource.
Aknowledgments
We would like to express our gratitude to the Inter American Tropical Tuna Commission for the information given and to Leonel O. Pérez Rodríguez, Efraín Briones Pérez and Justino Lezama Gutiérrez, students of Environmental Sciences Posgrade of the Universidad Autónoma de Tlaxcala, for their support during the process of this document.
References
Arntz, W. E. and Y E. Fahrbach, 1996. El Niño, experimento climático de la naturaleza. F. C. E. México. 312 p. [ Links ]
Batiste, D. S. and E. S. Sarachik, 1995. Understanding and predicting ENSO. U. S. National Report to IUGG, 1991-1994. Rev. Geophys. 33 Suppl., American Geophysical Union, 1367-1376. [ Links ]
Bazigos, G. P., 1983. Analysis of univariate fisheries, statistical time series. Fisheries information, data and statistical service fisheries department. Nicaragua. [ Links ]
Blackburn, M., 1965. Oceanography and the ecology of tunas. Oceanogr. Mar. Biol. Ann. Rev. 3, 229-332. [ Links ]
Blackburn, M., 1969. Conditions related to upwelling which determines distribution of tropical tunas off western Baja California. Fishery Bulletin 68, 147-176. [ Links ]
Díaz, P. J., 1992. Modelado de las pesquerías de túnidos en el Pacífico mexicano (atún aleta amarilla). Ms. Sc. Thesis, UNAM, México. 72 p. [ Links ]
González, C. J., 1986. Variabilidad y predictibilidad de las capacidades de sostén y su influencia en las abundancias poblacionales del atún aleta amarilla (Thunnus albacares) de las zonas históricas de producción pesquera del océano Pacífico oriental, a través del análisis de series de tiempo. Ms. Sc. Thesis, UNAM, México. 90 p. [ Links ]
Fox, W., 1975. Fitting the generalized stock-production model by least squares and equilibrium approximation. Fish. Bull. 73, 23-37. [ Links ]
Inter-American Tropical Tuna Commision. (1995). Annual Report. [ Links ]
Joseph, J., 1970. Managament of tropical tunas in Eastern Pacific Ocean. Trans. of the Amer. Fish. Soc. 99, 629-648. [ Links ]
Lehodey, P., M. Bertignac, J. Hampton, A. Lewis and J. Picaut, 1997. El Niño Southern Oscillation and Tuna in the Western Pacific. Nature 389, 715-717 [ Links ]
Mullen, A. J., 1992. Reaction diffusion models for dynamics distribution of yellowfin tuna. Ph. D. Thesis. University of London. [ Links ]
Nebel, B. J. and R. T. Wrigth, 1999. Ciencias Ambientales. Ecología y Desarrollo Sostenible. Prentice Hall, 6th ed., México, 698 p. [ Links ]
Ortega, G. S., 1998. Análisis de las fluctuaciones espacio temporales en la abundancia de atún en el Océano Pacífico Oriental. Fac. de Ciencias. UNAM. 186 pp. [ Links ]
Pella, J. J. and P. K. Tomlinson, 1969. A generalized stock production model. Inter-American Trop. Tuna Comm. Bull. 13, 421-496. [ Links ]
Ricker, W. E., 1958. Handbook of computations for biological statistic of fish populations. Bull. Fish. Res. Bd. Canada, 300 p. [ Links ]
Ritter, W., S. Guzmán, E. Buendía and T. Morales, 1979. Sobre la evaluación de los recursos naturales (aspectos ambientales en la productividad oceánica), Parte II. Anales del Instituto de Geofísica, 25, 135-152. [ Links ]
Ritter, W. and S. Guzmán, 1979. Preliminary results of the study of meteorological effects on the productivity of the Panama Bight. Geof. Int. 18, 177-195. [ Links ]
Ritter, W. and S. Guzmán, 1982. Efectos meteorológicos y oceanográficos en la productividad del Océano Pacífico del este. Geofísica 17, 23-39. [ Links ]
Ritter, W. and S. Guzmán, 1984. Modelo generalizado de producción pesquera con dependencia ambiental, una aplicación al golfo de Tehuantepec. Geofísica, 20, 21-29. [ Links ]
Ritter, W. R., Klimek and S. Guzmán, 1982. Sobre la abundancia, distribución y comportamiento del atún aleta amarilla en el Océano Pacífico del Este y su correlación a condiciones físico-ambientales. Geofísica, 17, 6-22. [ Links ]
Ritter, W., S. Guzmán and T. A. Morales, 1985. Efectos estocásticos sobre crecimiento poblacional en el Océano Pacífico del Este. Meteorologica XV, 113-129. [ Links ]
Sametband, M. J., 1994. Entre el orden y el caos: la complejidad. F.C.E. Argentina. [ Links ]
Schaefer, M. B., 1954. Some aspects of the dynamics of populations important to the management of the commercial marine fisheries. Inter-Amer. Trop. Tuna Comm. Bull. 1(2):25-56. [ Links ]
Schaefer , K. M., 1998. Biología reproductora del atún aleta amarilla (Thunnus alabacares) en el Océano Pacífico oriental. Inter.-American Tropical Tuna Com. Bul. 21, 222-272. [ Links ]
Schnute, J., 1977. Improved estimates for the Schaefer production model: theoretical considerations. J. Fish. Res. Bd. Canada 34, 583-603. [ Links ]
Schnute, J., 1981. A versatile growth model with statistically stable parameters. Can J. Fish. Aquat. Sci., 38, 1128-1140. [ Links ]
Schnute, J., 1985. A general theory for analysis of catch and effort data. Can. J. Fish. Aquat, Sci. 42, 414-429. [ Links ]
Shimada, B. M. and M. B. Schaefer, 1956. A study of changes in fishing effort, abundance and yield for yellowfin and skipjack tuna in the eastern tropical Pacific Ocean. Inter-Amer. Trop. Tuna Comm. Bull. 1, 352-449. [ Links ]
Suárez, S. J., 2000. Dinámica no-lineal de la biomasa del atún aleta amarilla en el Océano Pacífico oriental. Ms. Sc. Thesis, UNAM, México. [ Links ]
Sun, C. L. and S. Z. Yeh, 1998. ARIMA modeling and forecasting the albacore catch and CPU of the Taiwanese tuna logline fishery in the South Atlantic Ocean. Acta Oceanographica, 36, 125-137. [ Links ]
Ueyanagi, S., 1978. Recent tuna culture research in Japan. Inter. Ocean Develop. Conf. 5(CI), 23-39. [ Links ]
Walters, C. J., 1969. A generalized computer simulation model for fish populations studies. Trans. Amer. Fish Soc. 3, 505-512. [ Links ]
Watt, K. E., 1968. Ecology and resource management. McGraw-Hill. USA, 450 p. [ Links ]

