


Servicios Personalizados
Revista

Articulo
 Inglés (pdf)
 Artículo en XML
 Referencias del artículo
 Enviar artículo por email
Indicadores
 Citado por SciELO
 Links relacionados
-
 Similares en
SciELO
Similares en
SciELO
Compartir

 Permalink
Atmósfera
versión impresa ISSN 0187-6236
Atmósfera vol.17 no.2 Ciudad de México abr. 2004
A case study of orographic cyclogenesis over South America
B. Miky Funatsu, M.A. Gan*
E. Caetano**
*Brazilian Institute for Space Research (INPE)
Av. dos Astronautas, 1758, 12227-010, São José dos Campos, SP, Brazil
**Centro de Ciencias de la Atmósfera, Universidad Nacional Autónoma de México, México, D.F., 04510,
(Corresponding author)
E-mail: caetano@servidor.unam.mx
Received: January 13,2003.
Accepted: January 12,2004.
RESUMEN
Este estudio presenta el análisis sinóptico y dinámico de un evento de ciclogénesis que ocurrió sobre Uruguay entre el 8 y el 9 de julio de 1996, en la región de frecuencia máxima de ciclogénesis detectada en estudios previos. El estudio se basa en el análisis isobárico e isentrópico de variables meteorológicas y en la perspectiva del potencial de vorticidad. El desarrollo del ciclón ocurrió a partir de una baja segregada, preexistente en la troposfera media sobre el Océano Pacífico, que se propagó cruzando sobre los Andes al tiempo que se observó una fuerte advección térmica al oeste de la cadena montañosa. El análisis sinóptico de este caso reveló que el evento puede ser clasificado como una ciclogénesis de sotavento ya que la existencia de la barrera montañosa fue fundamental para la intensificación de labaroclinicidad de superficie, que a su vez llevó a la formación del ciclón extratropical. Asimismo, los Andes definen el techo vertical del sistema hacia el oeste, favoreciendo la advección de la vorticidad ciclónica en los niveles altos, sobre la advección térmica templada de los niveles bajos y, definen también, la configuración baroclínica final que alimenta el sistema en su etapa de mayor desarrollo. Utilizando la inversión del potencial de vorticidad fue posible evaluar cuantitativamente las contribuciones relativas de los niveles altos y bajos del potencial de vorticidad, así como las anomalías bajas de temperatura. Se observó que la anomalía baja de temperatura fue importante en las etapas iniciales de desarrollo, contribuyendo casi con el 100% de la circulación total. Con la profundización de la superficie ciclónica, las contribuciones de las anomalías de los niveles altos y bajos se hicieron mayores. En la etapa de máximo desarrollo del sistema pareció ocurrir una fase de cerramiento en los niveles altos y bajos, donde la advección del nivel alto de la vorticidad ciclónica, que indujo un flujo de superficie hacia el noreste, tuvo la mayor contribución.
ABSTRACT
This study presents a synoptic and dynamic analysis of a cyclogenesis event that occurred between July 8 and 9, 1996, over Uruguay, in the region of maximum frequency of cyclogenesis as detected in previous studies. The study is based on isobaric and isentropic analysis of meteorological variables, and also, on potential vorticity perspective. The development of the cyclone occurred as a pre-existent midtropospheric cut-off low, over the Pacific Ocean, which propagated crossing over the Andes at the same time as a strong thermal advection was observed to the west of the mountain ridge. The synoptic analysis of this case revealed that this event can be "classified" as a lee cyclogenesis, since the existence of the mountain barrier was fundamental for the intensification of the surface baroclinicity, which, in turn, led to the formation of the extratropical cyclone. Also, the Andes defined the vertical tilt of the system to the west, favoring the cyclonic vorticity advection at higher levels above the warm thermal advection at low levels, and it defined the final baroclinic configuration that fed the system in its greater development stage. By using potential vorticity inversion, it was possible to evaluate quantitatively the relative contributions of upper- and low-level potential vorticity, as well as bottom temperature anomalies. It was observed that the bottom temperature anomaly was important in the initial development stages, contributing to almost 100% of the total circulation. As the surface cyclone deepened, the contributions of low- and upper- level anomalies became greater. In the stage of maximum development of the system, a phase-locking at low and upper levels seems to occur, where the upper-level advection of cyclonic vorticity, inducing northeasterly flow at surface, had the greater contribution.
Keywords: Cyclogenesis, lee cyclogenesis.
1. Introduction
Mountain chains represent a physical barrier to the atmospheric flow, and as such, influence the atmospheric dynamics in their neighborhood. The major mountain barriers are in the Northern Hemisphere -the Rocky Mountains and the Himalayas-, located in midlatitudes and blocking the westerlies and the systems embedded on them. The Alps are not as huge, but they also exert a notorious influence on weather conditions in the adjacent regions, mainly on their southern side. The studies of lee cyclogenesis forthe Rockies and Alps are well documented (Buzzi et al., 1987; Tibaldi et al., 1990; Carlson 1991, etc.). These studies showed that, although the geometry of the Alps and the Rockies are different, some common features of lee cyclogenesis have been observed, such as: 1) the dissipation of the pre-existing low pressure system as it crosses the mountain barrier, and the development of a new one south to the position of the former, in the lee side; 2) the interaction of the topography and the cold front associated to the pre-existing cyclone may have an important role in the lee cyclogenesis, for it reduces the cold-air advection on the lee side and distorts the cold front structure such that a warm anomaly on the lee side appears (Buzzi and Tibaldi, 1978). The development of lee cyclones presents, in a first moment, an indirect circulation (Radinovic, 1986) and then, athermally direct circulation indicating a strong baroclinic component (McGinley, 1982).
In middle latitudes of the Southern Hemisphere there are not mountain chains comparable in dimension to those in the Northern Hemisphere. The Andes Cordillera (hereafter, Andes) extends along all the western side of South America, almost meridionally at ˜ 70° W. The Andes is broader and higher between 10° S and 30° S (tropics), with widths of ˜ 500 km, average height above 3000 m, and isolated peaks of more than 6000 m. To the south, in the extratropics, it becomes narrower, to around 200 km, and the average height is lower. Nevertheless, even being more "modest" than the huge mountain barriers of the Northern Hemisphere, the Andes interact with the transient systems that travel from the Pacific Ocean region, altering their magnitude and trajectories. The presence of a mountain chain induces a stationary Rossby wave, as predicted by the barotropic theory on a /3 plane. Bannon (1991) showed physically that winds with vertical shear, blowing "against" a mountain chain cause a weakening of the ridge of the stationary wave induced by the mountain (Kalnay et al., 1986; Robertson and Mechoso, 2000). However, Satyamurty et al. (1980) numerically showed the presence and position of a lee wave at the Andes, varying the vertical shear of the incident westerly wind.
Disturbances that propagate from the Pacific Ocean may interact with this wave pattern induced by the mountains changing their magnitude and pathway (Hsu, 1987; Gan and Rao, 1994). According to the theory of Hayes et al. (1987), this interaction explains lee cyclogenesis. Because the Andes are not as massive as the Rockies, but, on the contrary, have various high peaks (mainly in its northern portion), there is not such a strong flow obstruction as is observed in the case of the Rockies. This fact raised some doubts concerning the occurrence of the Andes' lee cyclogenesis. However, synoptic experience has shown that cold fronts and low pressure systems weaken as they approach the Andes and strengthened on its lee side (Gan, 1992).
Gan and Rao (1994, hereafter GR94) studied how the Andes influence the transient disturbances, using cross-correlational analysis of unfiltered and high-pass-filtered data. Their analysis of unfiltered data showed a wave pattern representative of low frequency anomalies, and also, that the interaction of these anomalies with the Andes led to distortions in the correlation isolines (in both filtered and unfiltered data). They also observed a slight westward tilt in the vertical over the Pacific Ocean as well as to the east of Andes indicating the baroclinic effect. In the case of the high-pass-filtered data, this inclination was about one-quarter wavelength between 1000 and 300 hPa levels. The increase in baroclinicity results in a baroclinic development, as suggested by Buzzi et al. (1987) in the context of the linear quasi-geostrophic theory. Results obtained by GR94 show that the disturbance's structure, when crossing the Andes, is similar to the normal mode structure when it approaches a mountain with meridional orientation, and confirm the occurrence of the Andes lee cyclogenesis.
This work aims to present a case study of lee cyclogenesis over South America using isentropic and potential vorticity (PV) analysis. We were motivated by the scarcity of observational studies of cyclones and cyclogenesis over South America and chose the present case as it may be considered representative of a classical case of cyclogenesis occuring when a precursor disturbance (midtropospheric cut-off low) over the Pacific Ocean crossed over the Andes. The cyclogenesis occurred over Uruguay, first found by Gan and Rao (1991) and also by Sinclair (1995) as a region of preferential occurrence of cyclogenesis over South America. Gan and Rao (1991) suggested that the reasons for that are likely to be both effects of baroclinic instability and orography. In the present work, we will show that, in fact, the Andes play a key role in the development of surface cyclogenesis.
2. Data and methodology
The dataset used in this work was the reanalysis data from National Centers for Environmental Prediction (NCEP), at 00, 06, 12 and 18 UTC (results are shown only for 00 and 12 UTC). The period analyzed was July 3-11, 1996. Data are disposed in a 2.5 ° x 2.5 ° lat/lon grid, and have vertical resolution of 17 levels. A full description of the data can be found in Kalnay et al.(1996). The synoptic analysis was made using isobaric and isentropic vertical coordinates. The NCEP data were interpolated linearly into 13 isentropic vertical coordinates, starting from 290 K level to 350 K level, with an interval of 5 K between each level. The concepts of PV on isentropic surfaces as presented by Hoskins et al. (1985) were used to visualize the dynamics of the events from a conservation point of view. In our analysis, we considered the value of -2 PVU as the so-called dynamical tropopause.
In isentropic coordinates, Ertel's PV (P) is given by
 ........................................................................(1)
where
 ........................................................................(2)
 is isentropic absolute vorticity
  and v is horizontal wind. Other symbols haver their usual meaning.
We also performed analyses of wind and geopotential obtained through piecewise PV inversion, following the methodology proposed by Davis and Emanuel (1991) (hereafter, DE91). After the comprehensive work of Hoskins et al. (1985) the idea of the invertibility of PV and its applications in explaining various aspects of dynamical meteorology (such as cyclogenesis, propagation of Rossby waves, baroclinic instability, and so forth) gained a renewed interest. The invertibility of PV is linked to the specification of the balance condition for the flow and adequate boundary conditions, so that the mass is conserved. In their work, DE91 assumed that the total PV perturbation h could be split into  contributions of distinct perturbations, and inverted the flow induced by each one. They pointed out, however, that the objective was not to decompose the perturbation ad infinitum, but to look for those parts that might be most important for the development of the system. DE91 proposed the partition of the total PV perturbation into three components associated with anomalies in PV at upper level (<=500 hPa) and lower levels PV (850 and 700 hPa) and with
  at the surface (
 ). In short, the method proposed by DE91 is based on the Charney balance equation (Charney, 1955), which, along with the PV equation, is a closed mathematical system. This diagnostic system can be solved by means of successive over-relaxation. A complete description of the methodology is in DE91. We describe it briefly as follows:
In a first step, the horizontal wind is decomposed into non-divergent ( the streamfunction) and irrotational components (
 the velocity potential), cf. Helmholtz Theorem. Then, it is assumed that the irrotational part is negligible compared to the non-divergent one. With this assumption, the balance condition expressed in spherical coordinates is:
 .........................................................(3)
 D is the geopotential height. Taking the terms proportional to vf, the expression for the PV in Exner coordinates is:
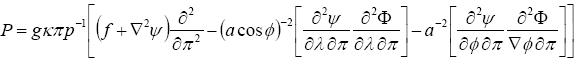 .............(4)
The equations (3) and (4) form a coupled non-linear system to be solved for and  . The prescribed boundary conditions were: at the upper and lower boundaries was prescribed, and the condition for was given by the hydrostatic equation. For , the geostrophic condition was adopted. At the lateral boundaries: the values of were taken directly from reanalysis data. In the methodology described by DE91, the boundary condition for is taken from integration of the following equation:
 ..............................................................................................(5)
where 'C' is a closed pathway coincident with the boundary, 'n' is the unit vector normal to the flow (positive vector to its left), and's' indicates direction along the boundary, in counter-clockwise motion and parallel to 'l'. In this study, however, we used simple geostrophic approximation as boundary condition for .
The integration was made on a grid with 21x21 points centered at the low-pressure system, and such that the lateral boundary was far away from the region of interest. Also, it was assumed that the "total" field of a variable can be partitioned into an average plus a perturbation relative to this average. We determine the average field according to Davis (1990): the average period that corresponds to the number of the days between the passage of two consecutive transient systems (or, two consecutive troughs at upper levels), or a multiple of that period. After inspection of the geopotential fields at 500 and 300 hPa in July 1996, we chose to take the average over 28 days since the synoptic systems have an average period of about 5 to 7 days at 35 ° S. By using this methodology, it was possible to obtain the fields of geopotential and wind associated to anomalies: of temperature at the lower boundary, PV at upper levels, and PV at low levels.
3. Synoptic and dynamical analysis
The case studied here occurred July 8-9, 1996, over Uruguay. Following, a brief overview of the event. At 00 UTC on July 7, a midtropospheric cut-off low, which extended to the surface was to the west side of the Andes. The cut-off low propagated eastwards passing over the Andes, and weakened. On July 9, the cut-off low was over eastern Argentina, as can be seen in the satellite picture (Fig. 1), and the surface low was on its mature stage. Two days later, the system as a whole was over the Atlantic ocean, in the decaying phase.

The extratropical cyclone over the continent formed between 00 and 12 UTC on July 9, with a central value below 1012 hPa, near 35° S-80° W (Uruguay), in the region of secondary maximum of cyclogenetic frequency over South America (Gan and Rao 1991, Sinclair 1995). This system caused moderate rainfall amounts over Paraguay and Southern Brazil, as indicated in the SYNOP data in this period.
Although the surface low formed in July 9, we will analyze the synoptic situation some days before (from July 3), as to focus on some important developments previous to cyclogenesis.
3.1 Precursor disturbance temporal evolution
The precursor cut-off low can be seen in the 400 hPa chart from at least July 3 at 00 UTC, close to 37.5° S - 115° W (Fig. 2a, signed A). A closed isobar at the mean sea level (MSL) can be seen, indicating that the cut-off low extended to the surface with an equivalent barotropic structure. There is another system at the 400 hPa level, near 45° S - 93° W (signed B). A vertical cross section of Ertel PV at 47.5° S (Fig. 2b) shows that the tropopause undulated and transported stratospheric air until -400 hPa. The penetration of stratospheric air in this case was shallow since the downward vertical flow was weak at the bottom of this undulation (maximum value around 0.1 Pa s hence July 3 at 12 UTC). In Fig. 2b, we can also see that the potential temperature profile at low levels, was very wavy, with warm anomaly over the center of the low pressure at the surface. Following the arguments presented by Hoskins et al. (1985), we can say that the surface cyclonic circulation was associated to this positive temperature anomaly.
The system A has maximum cyclonic vorticity concentrated in the mid- and high levels of the troposphere (Fig. 3a). The system B has stronger cyclonic vorticity values than system A, but the center of maximum ciclonic vorticity was concentrated in a shallower layer at lower levels in the troposphere (not shown). The vertical motion associated to system A does not correspond to the typical circulation associated to cut-off lows, with cold air descending on the center and warm air rising in the periphery (Gan, 1992). Rather, the vertical motion is consistent with that described by the quasi-geostrophic vorticity equation in the case of baroclinic growth, although the profile of isentropic relative vorticity (Fig. 3a) shows a clearly barotropic structure. At low levels, there is convergence downstream and divergence upstream, while at high levels the opposite holds (Fig. 3b). In this aspect, this event differs from the midtropospheric cut-off low studied by Bell and Bosart (1990), who concluded that the divergence associated to the formation of a warm air pool right over the cyclone (and not in the backward) at levels was the dominant thermodynamical feature throughout the event.
The ascending air downstream and the low-level system transports moisture to the higher levels; consequently, condensation of water vapor and latent heat release is expected. Consistently, the ridge amplifies above the region of condensation, and the surface cyclone strengthens. This corresponds to sinks and sources, respectively, of PV by diabatic heating (Hoskins, 1990).
Systems A and B traveled through the Pacific Ocean following a long wave in which they were embedded while maintaining the main characteristics described above, fairly unchanged (in terms of structure, not of magnitude). System Amoved eastward, and system B moved southward, being further incorporated to the stratospheric reservoir of high latitudes. Henceforward, we concentrate on system A since it ultimately reached the western coast of South America, and became the precursor disturbance of the Andes lee cyclogenesis.
While the system moved eastward, it weakened and "opened" as a narrow trough. Also, the system acquired a slight westward tilt with height between July 4 at 00 UTC and July 6 at 18 UTC (not shown). This tilt coincides with the vertical profile of a baroclinic wave of wave number 6 studied by Randel and Stanford (1985). Although the case studied by Randel and Stanford (1985) was a summer event, the temporal evolution studied in this case was very similar, which suggests that baroclinic processes were important in this event.
On July 7, the system reached the western coast of South America, and at 12UTC, the trough was cut-off again in the midtroposphere, this can be seen (Fig. 4), in ˜ 37.5° S 75° W, as well as a jetstreak above the trough. Bell and Keyser (1993) found that the propagation of a jetstreak-shortwave system defined the structure and maturation of the cut-off low in 500 hPa, through the conversion of shear-potential vorticity (associated to the jet) to curvature-potential vorticity (associated to the shape of the trough). The formation of the cut-off low at upper levels in our case resembles that observed by Bell and Keyser (1993) in several ways, such as the elongation of the trough before the detachment of the low and further cut-off of the trough forming the closed low at the same time that the jet streak positioned over the basis of the trough.
3.2 The crossing of the system over the Andes
The cut-off low decoupled from the surface low over the Pacific Ocean near the Chilean coast on July 7 at 12 UTC due to the mountain barrier effect. At this time, we also note the prevalence of a strong, northerly low-level jet in the lee side of the Andes (Byerle and Paegle, 2002), bringing warm and moist air from the Amazon to the region close to Paraguay (Fig. 4c). An analysis of the thermal advection field (Fig. 5) shows strong warm advection at low levels on July 7. On this day, at 00 UTC there is a core of warm-air advection near ˜ 25° - 58° W, with values greater than 8K/day at 925hPa. The thermal advection becomes stronger 12 hours later, but the core is displaced to the south, near ˜ 32° S - 58° W, reaching values greater than lOK/day. This strong thermal advection is also detected in 850 hPa (not shown).
In the sequence shown in Fig. 6 we can clearly observe that the system tilted to the east in the vertical, and there was a decoupling of the system in upper and low levels. Meanwhile, cyclonic circulation showed up at low levels in the lee side of Andes (Fig. 7a). On July 8, at 00 UTC, the system, at upper levels, had an equivalent barotropic structure and was placed between the system at low levels in the western side of the Andes (which could not transpose the barrier) and the system that was developing to the east of the Andes (Fig. 6c). The surface low in the Pacific Ocean moved southward, following the Chilean Coast, and weakened in the subsequent hours (not shown). This agrees with Carlson's (1991) description of the track of a surface low when it reaches a mountain barrier. During the propagation of the cut-off low over the Andes (08Jul/00-12UTC), it got in phase with the stationary ridge induced by the mountain barrier, and the system weakened as a whole.
The undulation of the temperature field (July 7 at 12 UTC) is consistent with the warm anomalies over the continent at low levels before the cut-off low passed over the Andes, which was a decisive factor for the cyclogenesis on July 9, within 00-12 UTC. In this sense, this event can be classified as an orographic cyclogenesis, since the mountain played a key role in the evolution of the system and formation of the surface cyclone.
On July 8 at 12 UTC, the cut-off low was placed southwest of the low in 850 hPa, and the upward motion is strongest in the middle atmosphere, reaching values up to 0.3 Pa·s-1 (not shown).
3.3 Maturation of the system
Between 00 UTC of July 8 and 9, there was no longer the northern wind "channel" to the east of the Andes, where the cyclonic circulation of the surface low already dominated (Fig. 7b,c). On the other hand, after July 9 at 00 UTC, the cyclonic circulation itself amplified the thermal wave, and a jetstreak appeared at southeast of the cyclone at 850 hPa (Fig. 7d).
At higher levels, the cut-off low intensified after crossing the Andes as it moved towards the trough axis of the stationary wave induced by the mountain. The tropopause undulation found in this case, resembles that described by Hirshberg and Fritsch (1991a). Namely, there is a warm air pool at 200 hPa over the basis of the trough at this level, aligned almost perpendicularly to the flow (Fig. 8a) which causes a strong temperature advection to the east of this trough (Fig. 8b), and a minimum PV core that is coincident with the region of maximum temperature (Fig. 8c). The temperature advection in this case, however, is generally one order of magnitude smaller than that presented by Hirshberg and Fritsch (1991), and the undulation did not go deeper than 400 hPa.
On July 9 at 00 UTC, the rising motion in the eastern side of the system began to intensify, reaching values above 0.7 Pa·s-1 in the middle troposphere at 12 UTC of the same day (Fig. 9). The vertical structure resembles that shown in Fig. 25 of Hirshberg and Fritsch (1991b). At this time of maximum growth, the midtropospheric cut-off low and the surface cyclone location differed by about 8 degrees of longitude, revealing the baroclinic nature of the growth (Fig. 10). This "configuration" is analogous to the baroclinic growth described by Hoskins et al.(1985) in which two disturbances lagged in the vertical, can be locked to each other and provide mutual enhancement. In our case, the upper level cut-off low and the surface low were lagged about one-quarter of the wavelength of the disturbance, the optimum phase lag for mutual development according to Hoskins et al. (1985). However, the intensification of the system in upper-levels may have occurred because the cut-off got in phase with the stationary wave over the Andes, and not by the contribution of low-level perturbations, which induces flow in levels above those where the perturbation is located. This issue will be addressed later when we describe the potential vorticity inversion.
4. Inverted fields
In addition to the previous analysis, we also obtained the total and perturbed fields of geopotential height, wind and stream function by applying the invertibility principle (Hoskins et al. 1985) and "inverting" the total and perturbation PV fields for the period of July 7-11, 1996 (00 and 12 UTC).
The most attractive aspect of inverting the perturbation of potential vorticity is, for example, the possibility of recovering the geopotential and wind fields associated to individual anomalies of potential vorticity. By doing this, it is possible to explore the attribution issue and identify the vertical motions that can be attributed to a given anomaly of PV (Davis et al., 1996; Thorpe, 1997). Also, it is possible to evaluate how PV perturbations interact with each other, either vertically or laterally (Hoskins et al., 1985; Hakim et al., 1996; Huo et al., 1999).
Figure 11 shows the geopotential height and non-divergent wind recovered from the total PV fields, for July 9,1996. The recovered fields and reanalysis fields are very similar to each other. For the geopotential fields, the major differences were near the boundaries. For the wind field, the differences were larger at higher levels, where the flow has a strongly divergent nature (as in the jet-streak regions). These features were observed throughout the analyzed period (not shown). In general, we observe that the cyclone evolution had a balanced nature. This result agrees with Davis et al.(1996), who studied an explosive cyclogenesis event in the Atlantic Ocean and found that, even in the case when there is a rapid deepening of the low, the dynamical processes associated with that deepening had a balanced nature. They also concluded that the non-balanced part of the flow could not be totally explained by the ageostrophic wind, because the magnitude of the former was smaller than that of the latter. Davis et al.(1996) proposed that at low levels, the non-balanced component of the wind might be due to frictional effects.
The total perturbation field also showed a balanced nature (not shown), with greater differences from the reanalysis fields near the boundaries. Here, "total perturbation" refers to the joint contribution of temperature anomalies in the upper and lower boundaries, and of potential vorticity anomalies in the whole atmospheric column (between the upper and lower boundaries). The method of solution constrains the sum of the anomalies to be equal to the total anomalies. This, however, may not necessarily be valid, because of the non-linear character of the perturbation and to errors inherent to the numerical method. We analyzed the relative contributions of three distinct anomalies to this event of cyclogenesis: upper (400-200 hPa) and lower (925-700 hPa) levels PV anomalies, and temperature anomalies at the surface (henceforward, we will refer to them as PUPV, PLPV and respectively). The choice of the 400-200 hPa layer for analysis is justified by the location of a core of maximum PV anomaly in this region, as can be seen in Fig. 8d, for July, 9 at 00 UTC. The low level PV anomalies are expected to represent the effects of the warm thermal advection and condensation processes.
Figures 12, 13 and 14 show the cross section of the contributions of each anomaly to the total perturbation relative vorticity, for three different times. We can see that at 00 UTC July 7 (Fig. 12), anomaly is responsible for the cyclonic circulation at the surface to the east of the Andes. Also, the upper level cyclonic circulation is due to the cut-off low, with no contribution from the low levels. This result supports the importance of low level thermal advection on July 7 for the development of the cyclone. On July 8, the configuration changed, and the contribution associated to decreased to 50% of the total perturbation circulation, whereas PLPV and PUPV contribute with the remaining 50%, being PLPV contribution more significant. As the surface cyclone reached its stage of maximum development (July 9, at 12 UTC), the circulation due to PLPV surpassed the contribution. Moreover, the cyclonic circulation induced by PUPV becomes important, representing around 28.6% of the total circulation.
These results are in agreement with the previous synoptic analysis, showing that the thermal effects induced by the presence of the Andes were of importance for the cyclonic vorticity perturbation to the east of the mountain ridge. At later stages, the contribution of latent heat release and baroclinic effects increased and were very significant for the development of the cyclone.
Huo et al. (1999, hereafter H99) studied cyclogenesis attributions for the superstorm of 12-14 March 1993 using PV inversion and accessed the relative contribution of upper level dry PV-, moist low level PV-, boundary temperature- and "residual" interior PV-anomalies (the last basically related to upper level waves). Their results showed that, at the mature stage, the most important contribution for the cyclone depth was from the upper-level dry PV anomaly (53%), followed by the temperature anomaly (28%). The moist PV anomaly contributed with nearly 19%, and its contribution remained almost unchanged during the cyclogenesis. Since the partitioning of PV was made in a different way in this study and in H99, it is not surprising that the anomalies relative contributions were found to be different. However, it may be considered that these differences more likely arose from the fact that in the case studied in H99 there were two precursor upper-level short-wave troughs, and the explosive cyclogenesis occurred as the disturbances merged. In the present case, only one upper level cut-off low was observed. Moreover, it was seen that this disturbance weakened as it crossed over the Andes, getting strengthened as it got in phase with the stationary trough induced by the mountain barrier to its lee side. From the PV analysis, it was seen that the vertical circulation induced by PLPV and , was enough to cause a strengthening of the upper level disturbance. In this aspect, a similar result was found by Flocas (2000) who studied a cyclogenesis over the Aegean Sea using quasi-geostrophic potential vorticity analysis. From the PV inversion he found no sign of intensification of upper level flow due to low level anomaly. Despite the wind flow recovered by quasi-geostrophic potential vorticity inversion is two-dimensional, the results obtained by Flocas (2000) showed to be consistent to describe the cyclogenesis event, and to understand (at least qualitatively) the relative importance of upper and low level features for the development of the surface cyclone. However, other features of development were also different from what was found in the present study: he found that the initiation of the cyclone was mostly due to the circulation induced by upper level PV anomalies, and that the diabatic sources, responsible for low level PV anomalies, were important for the subsequent development. The relative importance of the distinct PV anomalies are in "reverse" order from the case we studied here.
5. Concluding remarks
We discussed a case in which the influence of the Andes Cordillera on the initial formation of the extra tropical cyclone over South America was very important. The thermal advection to the east of the Andes, forced by the mountain barrier, led to the intensification of the positive temperature anomaly at surface, just prior to the passage of the cut-off low over the Andes. This warm anomaly induced the cyclonic circulation, which intensified and brought the formation of the extra tropical cyclone. The role of the orography was also important in the sense that it forced the decoupling of the cut-off low and the surface low to the east of the Andes, and caused eastward tilt with height of the cut-off low. This favored cyclonic vorticity advection at upper and middle levels. Vertical cross sections of relative vorticity indicated that baroclinic instability processes provided the necessary energy for the cyclone development between 00 and 12 UTC of July 9. The cyclonic vorticity advection at upper levels concomitant with the warm-air advection at low levels were the decisive elements to cyclogenesis. From July 10, the cut-off low and the extratropical cyclone became in phase, hence, barotropic decay took place while the system as a whole moved to the Atlantic Ocean. These results were also verified by performing potential vorticity inversion of PV anomalies associated to the midtropospheric cut-off low (upper-level PV), diabatic effects (low-level PV) and boundary temperature, which can be considered as a surrogate of PV at the surface. The relative importance of each of these anomalies varied with the stage of development. The temperature anomaly was important before the formation of the cyclone, and the contributions of diabatic effects increased as the cyclone was formed. The upper level anomaly contribution was most important in the phase of maximum development of the cyclone.
This case can be considered a case of orographic cyclogenesis, in the sense that the Andes Cordillera forced the intensification of the temperature anomaly at the surface and cyclonic vorticity advection at upper levels, to the east of the Cordillera. Those are necessary conditions for the formation and evolution of the extratropical cyclone through baroclinic instability. Additionally, the cut-off low also intensified after crossing the Andes when it got in phase with the trough induced by the mountain barrier. This conclusion agrees with Gan and Rao (1991) who suggested that the maximum of cyclogenetic frequency over Uruguay may be associated to the effect of the Andes, and also with Hayes et al. (1987) theory, who proposed that the orographic cyclogenesis occurs by the superposition of a baroclinic disturbance and the stationary wave induced by the mountain.
Acknowledgements
The authors are very grateful to Dr. Rosemary P. da Rocha for the isentropic interpolation code and discussion on the inversion results and to Dr. Christopher Davis for kindly providing the numerical inversion code. We also acknowledge Dr. Tercio Ambrizzi and Institute of Astronomy and Geophysics of Sao Paulo University for providing the NCEP data. This work was supported by Brazilian National Council for Research.
References
Bell, G. D. and D. Keyser, 1993. Shear and curvature vorticity and potential vorticity interchanges: Interpretation and application to a cut-off cyclone event. Mon. Wea. Rev. 121 (6), 76-102. [ Links ]
Buzzi, A. S., S. Tibaldi, and E. Tosi, 1987. A unified theory of orographic influences upon cyclogenesis. Meteor. Atmos. Phys., 36, 91-107. [ Links ]
Buzzi, A. S. and S. Tibaldi, 1978. Cyclogenesis in the lee of the Alps: A case study. Quart. J. Roy.Meteor. Soc. 104, 271-287. [ Links ]
Byerle, L. A. and J. Paegle, 2002. Description of the seasonal cycle of low-level flows, flanking the Andes and their interannual variability. Meteorologica, 27 (1 and 2), 71-88. [ Links ]
Carlson, T. N., 1991. Mid-latitude weather systems. Routledge, 507 p. [ Links ]
Davis, C. A., 1990. Cyclogenesis diagnosed with potential vorticity. Ph.D. Thesis. Massachusetts Institute of Technology, 194 p. [ Links ]
Davis, C. A., and K. A. Emanuel, 1991. Potential Vorticity Diagnostics of Cyclogenesis. Mon.Wea. Rev., 119 (8), 1929-1953. [ Links ]
Davis, C. A., E. D. Shapiro, and M. A. Shapiro, 1996. The balanced dynamical nature of a rapidly intensifying oceanic cyclone. Mon. Wea. Rev., 124 (1), 3-26. [ Links ]
Flocas, H.A., 2000. Diagnostics of cyclogenesis over the Aegean Sea using potential vorticityinversion. Meteorol. Atmos. Phys., 73, 25-33. [ Links ]
Gan, M. A., 1992. Cyclogenesis and cyclones over South America (Ciclogêneses e ciclones sobrea América do Sul). Ph.D. Thesis (in Portuguese, INPE-5400-TDI/479). National Institute for Space Research, 195p. [ Links ]
Gan, M. A., and V. B. Rao, 1991. Surface cyclogenesis over South America. Mon. Wea. Rev., 119(5), 1293-1302. [ Links ]
Gan, M. A., and V. B. Rao, 1994. The influence of the Andes Cordillera on transient disturbances. Mon. Wea. Rev., 122 (6), 1141-1157. [ Links ]
Hayes, J. L., R. T. Williams, and M. A. Rennick, 1987. Lee cyclogenesis. Part I. Analytic studies. J. Atmos. Sci., 44 (2), 432-442. [ Links ]
Hirshberg, P. A., and J. M. Fritsch, 1991a. Tropopause undulations and the development of extratropical cyclones. Part I. Overview and observations from a cyclone event. Mon. Wea. Rev., 119(2), 496-517. [ Links ]
Hirshberg, P. A., and J. M. Fritsch,1991b. Tropopause undulations and the development of extratropical cyclones. Part II. Diagnostic analysis and conceptual model. Mon. Wea. Rev. 119(2), 518-550. [ Links ]
Hoskins, B. J., 1990. Theory of extratropical cyclones. In: C. Newton and E. O. Holopainen, eds. Extratropical cyclones: the Erik Palmen memorial volume. American Meteorological Society. 64-80. [ Links ]
Hoskins, B. J., M. E. Mclntyre, and A. W. Robertson, 1985. On the use and significance of isentropic vorticity maps. Quart. J. R. Meteor. Soc, 111 (470), 877-946. [ Links ]
Hakim, G. J., D. Keyser and L. F. Bosart, 1996. The Ohio Valley wave-merger cyclogenesis event of 25-26 January 1978. Part II. Diagnosis using quasigeostrophic potential vorticity inversion. Mon. Wea. Rev., 124, 2176-2205. [ Links ]
Huo, Z., D.-L. Zhang, and J. R. Gyakum, 1999. Interaction of potential vorticity anomalies in extratropical cyclogenesis. Part I. Static piecewise inversion. Mon. Wea. Rev, 127, 2546-2561. [ Links ]
Kalnay, E., K. C. Mo and J. Paegle, 1986. Large amplitude, short-scale stationary Rossby waves in the Southern Hemisphere: observations and mechanistic experiments to determine their origin. J. Atmos. Sci., 43, 252-275. [ Links ]
McGinley, J. A., 1982. Adiagnosis of Alpine lee cyclogenesis. Mon. Wea. Rev., 110, 1271-1287. [ Links ] Randel, W. J. and H. L. Stanford, 1985. The observed life cycle of a baroclinic instability. J. Atmos. Sci., 42 (13), 1364-1373. [ Links ]
Robertson, A. W., and C. R. Mechoso, 2000. Interannual and interdecadal variability of the South Atlantic Convergence Zone. Mon. Wea. Rev., 128, 2947-2957. [ Links ]
Satyamurty, P., R. P. Santos, and M. A. M. Lemes, 1980. On the stationary trough generated by the Andes. Mon. Wea. Rev., 108 (4), 510-519. [ Links ]
Sinclair, M. R., 1995. A climatology of cyclogenesis for the Southern Hemisphere. Mon. Wea. Rev.,123(6), 1601-1619. [ Links ]
Thorpe, A. J., 1997. Attribution and its application to mesoscale structure associated with tropopause folds. Quart. J. R. Meteor. Soc, 123 (544), 2377-2399. [ Links ]

