


Services on Demand
Journal

Article
 English (pdf)
 Article in xml format
 Article references
 Send this article by e-mail
Indicators
 Cited by SciELO
 Related links
-
 Similars in
SciELO
Similars in
SciELO
Share

 Permalink
Atmósfera
Print version ISSN 0187-6236
Atmósfera vol.17 n.1 Ciudad de México Jan. 2004
Classification of thunderstorm and non-thunderstorm days in
Calcutta (India) on the basis of linear discriminant analysis
S. GHOSH
Atmospheric Science Research Group, Environmental Science Programme
Faculty of Science, Jadavpur University, Calcutta 700032
P. K. SEN
Department of Mathematics, Jadavpur University, Calcutta 700032
U. K. DE
Atmospheric Science Research Group, Environmental Science Programme
Faculty of Science, Jadavpur University, Calcutta 700032
Received June 6, 2002; accepted August 26, 2003
RESUMEN
En el presente trabajo se aplicaron dos técnicas multivariadas sofisticadas, el “Análisis de componente principal” y el “Análisis lineal discriminante de dos grupos”, para analizar el clima pre-monzónico de Calcuta (India) y predecir las tormentas pre-monzónicas de ese lugar. El trabajo se desarrolló en las siguientes etapas: i) Análisis con 20 parámetros dinámicos y termodinámicos derivados de los datos diarios de la radiosonda de Calcuta, ii) Análisis con 10 parámetros nuevos que son los 10 componentes principales formados con los 20 parámetros originales. El estudio indica que se puede construir un índice conocido como “Función lineal discriminante” (FLD), para predecir el clima pre-monzónico de Calcuta. Además, la investigación revela que si se reducen las dimensionalidades de las matrices de datos, la exactitud de los resultados se mejora.
ABSTRACT
The two sophisticated applied multivariate techniques, ‘Principal Component Analysis’ and ‘Two-group Linear Discriminant Analysis’ have been applied in the present work to analyze the pre-monsoon weather in Calcutta (India) and hence to forecast the pre-monsoon thunderstorms there. The work has been performed in the following two stages: i) Analysis with 20 thermodynamic and dynamic parameters derived from daily radiosonde data in Calcutta; ii) Analysis with 10 newly formed parameters which are actually the first 10 principal components formed with the 20 original parameters. The study indicates that an index known as ‘Linear Discriminant Function’ (LDF) may be constructed to predict the pre-monsoon weather in Calcutta. Not only that, the study also reveals that if the dimensionalities of the data matrices are reduced, then the accuracy of the results may improve.
Key words: Equivalent potential temperature, saturated equivalent potential temperature, convective instability, conditional instability, principal component analysis, linear discriminant analysis.
1. Introduction
Pre-monsoon thunderstorms over the Eastern Zone of India have many beneficial effects, though in some cases strong wind squall, hail and intense precipitation create havoc. As thunderstorm rain is the major source of water here during the hot pre-monsoon summer days and it gives much relief from hot and humid weather, it is mostly welcome in this region and there is a need to construct a statistical index which may help one to identify an unknown day as a thunderstorm (TS) or non-thunderstorm (NTS) day beforehand. The aim of the present work is to forecast the development /non-development in Calcutta on the basis of 0000 UTC and 1200 UTC radiosonde data in Calcutta. The classification rule applied here is based on an index called the ‘Linear Discriminant Function’ (LDF).
The study has been confined up to the 500 hPa level because the importance of this level has already been stressed by a number of scientists, viz. Showalter (1953), Galway (1956), Darkow (1968), Fujita et al. (1970) and Miller (1972). The level of cloud development may also be taken around 500 hPa (Kessler, 1982).
The work has been initially started with the following 20 thermodynamic and dynamic parameters: (θes-θe), (P-PLCL), ∂θe/∂z, ∂θes/∂z and ∂v/∂z for each of the following atmospheric layers: (1000-850) hPa, (850-700) hPa, (700-600) hPa and (600-500) hPa.
Here θes and θe are respectively saturated equivalent potential temperature and equivalent potential temperature, P and PLCL denote the pressure at the reference level and that at the corresponding lifting condensation level respectively; v and z are respectively the wind speed in ms-1 and geopotential height in meter.
It is now a well-known fact that thunderstorms are strongly favored by convective instability (determined by ∂θe/∂z), abundant moisture at low levels, strong wind shear (measured by ∂θv/∂z) and a dynamical lifting mechanism that can release instability (Kessler, 1982). Not only that, the vertical shear of the environmental winds has to match the value of the convective instability for proper development of the convective cloud (Asnani,1992). Williams and Renno (1993) have emphasized conditional instability for supporting electrification and lightning.
The thermodynamic parameter (θes-θe) was first introduced by Betts (1974). It is considered as the measure of insaturation of the atmosphere for a layer, ∂θe/∂z determines the convective stability or instability of a layer. On the other hand, ∂θes/∂z decides the conditional stability or instability of a layer and ∂v/∂z gives a measure of vertical shear of horizontal wind for a layer. Here the parameters θe and θes have been calculated by the standard formulae introduced by Bolton (1980). PLCL for the surface parcels was considered as the cloud base by Kuo (1965) and hence the parameter (P-PLCL) may be taken as the forcing factor necessary for the saturation of a parcel.
It may be mentioned that the parameter (θes-θe) has already been examined by Chowdhury et al. (1996) for instantaneous thunderstorm occurrence in Dhaka, Bangladesh and, Ghosh and De (1997) for instantaneous thunderstorm occurrence in Agartala and Ranchi, India. The same parameter has also been studied by Ghosh et al.(1998) before the occurrence of afternoon pre-monsoon thunderstorms at Calcutta, India. In each of the above mentioned studies, the parameter (θes-θe) has been found to play a significant role on thunderstorm days and it also acts as a discriminating factor between TS (thunderstorm) and NTS (non-thunderstorm / fair-weather) days.
At first all the 20 parameters have been used to form the discriminating functions for the TS and NTS days. But to deal with all the 20 parameters at a time is time-consuming. So, in the second stage of the work the number of the parameters has been reduced to 10 by Principal Component Analysis (PCA). These 10 newly formed parameters have been used to construct the discriminant functions for TS and NTS days. It is very interesting to note that the accuracy of the results has improved significantly in the second stage of the work. The present study has been performed separately for the morning and afternoon as it is clear from a previous work on PCA (Ghosh et al., 1999) that the weather in the morning differs structurally from that in the afternoon in Calcutta during the pre-monsoon season (March, April and May).
Here, known TS and NTS days have been grouped separately. Each of these two groups represents a discrete outcome and the forecast consists of a categorical statement that one of these outcomes will occur. The discriminant analysis technique has been used as a tool for forecasting by Miller (1962), Lawson and Cerveny (1985), Ward and Folland (1991) and Sánchez et al. (1998).
2. Data
In the present analysis, daily radiosonde data (viz. geopotential height, pressure, dry-bulb temperature, dew-point temperature and wind-speed) of 0000 UTC and 1200 UTC taken in Calcutta for the pre-monsoon months (i. e. March, April and May) of the years 1988, 1990, 1991 and 1993 have been utilized to calculate the above mentioned 20 parameters. To identify the TS and NTS days in Calcutta, Monthly Meteorological Report (M. M. R.) data have been used. It should be mentioned that there are two meteorological observation stations in Calcutta, one in Dumdum (DD) and the other in Alipore (ALP). Whenever either station reports thunderstorm, the day is taken as a TS day for Calcutta. The year 1988 has been treated as ‘unknown’ to validate the indices which have been constructed using the data of 1990, 1991 and 1993.
In the literature, the group X consists of the parameters for NTS days and the group Y consists of the parameters for TS days. It is to be noted that the total number of thunderstorms that occurred during the pre-monsoon season (i. e. March, April and May) in 1990, 1991 and 1993 is 45. So, originally each group includes 45 days and 20 parameters. It has been noticed that during the pre-monsoon season, thunderstorms often occur in Calcutta on consecutive days. That is why, the days without occurrence just before and after the TS days have been chosen as NTS days. The intention is to get a clear idea regarding the behavior of the parameters towards the non-occurrence of the phenomenon, even when the parameters may be favorable for the occurrence of thunderstorms. However, the size of each group has been maintained at 45.
In the second stage, to form the indices, the linear discriminant analysis has been performed with the two groups, each of which includes the same 45 days as before, but the number of parameters in each group is 10 (new parameters formed by the PCA technique) instead of 20.
3. Methodology
Let us suppose that there are k parameters, Zi (i = 1 to k) on which we have the following two sets of observations:

In the present study, Zi (i = 1 to 20) denotes the above mentioned 20 parameters; Xij denotes the value of the ith parameter on jth NTS day; Yij gives the value of the ith parameter on jth TS day. Originally, the work has been started with k = 20 parameters which has been ultimately reduced to M* = 10 by the PCA technique, where M* is the number of newly formed parameters and k is the number of original parameters.
In this context, let us discuss the objective of the PCA technique in short. Assuming that there are p variables Xi (i = 1 to p), the following p linear combinations ξ i (i = 1 to p) wich have been mentioned as newly formed parameters in the text are formed as follows:
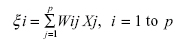
where Wij denotes the weight of the jth variable for the ith principal componente. The weights are estimated such that:
i) The first principal component ,ξ1 accounts for the maximum variance in the data, the second principal component, ξ 2, accounts for the maximum variance that has not been accounted for by the first principal component, and so on.
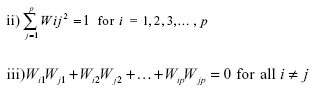
The weights are obtained mathematically by using calculus (Sharma, 1996).
In the first part of the work, Linear Discriminant Analysis (LDA) has been performed with the original k-dimensional raw data vector. But in the second part, the same analysis has been performed with M*-dimensional data vector whose elements are the first M* principal components. Here the PCA has been conducted on the correlation matrix instead of the covariance matrix, since the data vectors are unlike (i. e. they have different units) (Wilks, 1995).
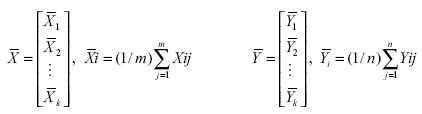
Since a previous work on PCA with the same 20 parameters (Ghosh et al., 1999) shows that 93.3 % - 98 % information is covered with the first 10 components which involve the parameters from 1000 hPa to 700 hpa, in the second part of the present work, the upper-level parameters have been neglected. Here m = n = 45, m and n being the number of NTS days and TS days respectively. Each of the groups X and Y has been characterized as follows:
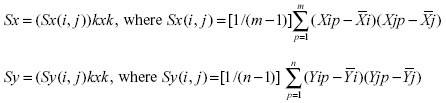
Without any loss of generality, let us assume that the population underlying each of the groups, X and Y has the same covariance matrix. Then the sample covariance matrices Sx and Sy can be computed from the data matrices as follows:
Since the covariance structures are assumed to be equal, the above two matrices are averaged to yield a pooled estimate of the dispersion of the data around their means as follows:
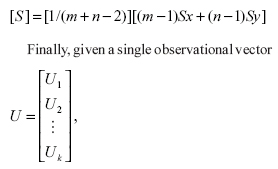
where the elements Ui (i = 1 to k) to denote the values of the parameters on a particular day, the nature of which is unknown, the following discriminant functions are calculated to determine which group U belongs to:

where ‘/ ’ means as usual the transpose of a matrix.
If |Dx - Du| > |Dy – Du|, then U belongs to the X-group, i. e., the nature of the unknown day is expected to be as that of an NTS day.
Similarly, if |Dx – Du| > |Dy – Du|, then U belongs to the Y-group, i. e., the nature of the unknown day resembles the nature of a TS day.
As mentioned earlier, in the second part of the work the PCA technique has been applied first to reduce the dimensionality of the original data matrix without losing any physical information. Then the LDA technique has been performed in a similar manner, as described above, with the newly formed 10-dimensional data matrix. Here also, each of the groups X and Y consists of 45 days. The LDA method has been named PCLDA in this part of the work.
Next, for the validation of the results, two types of verification have been performed here, viz.
i) Autoverification;
ii) Verification with unknown data.
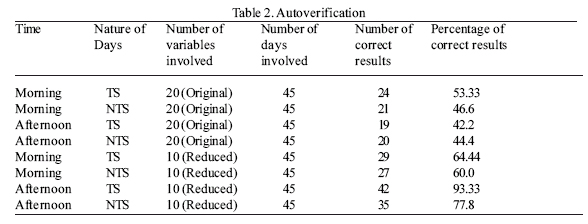
In ‘Autoverification’, the days already involved in the analysis have been treated as unknown observations. Incidentally, the ‘Autoverification’ (Table 2) reveals that the results improve significantly in the second stage of the work (i.e. when the PCLDA technique has been used). So for the final verification with unknown data the PCLDA technique has been applied directly.
For the final verification, the data of the year 1988, have been taken as unknown observations which are to be classified. Before verification, the thunderstorms of 1988 have been grouped as morning-TS and afternoon-TS according to the Monthly Meteorological Report (M. M. R.) Here, morning-TS means the thunderstorms occurring between 0000UTC and 1200 UTC and afternoon-TS includes the thunderstorms which occur after 1200 UTC but before 0000 UTC of the next day. Similarly, morning-NTS represents the fair weather between 0000 UTC and 1200 UTC and afternoon-NTS represents that during the next 12 hours.
3. Results and verification
In Table 1, the results of LDA (with 20 original parameters) and PCLDA (with 10 newly formed parameters), in Table 2, the results of ‘Autoverification’ and in Table 3 and 4, the results of final verification with the data for 1988 have been presented.
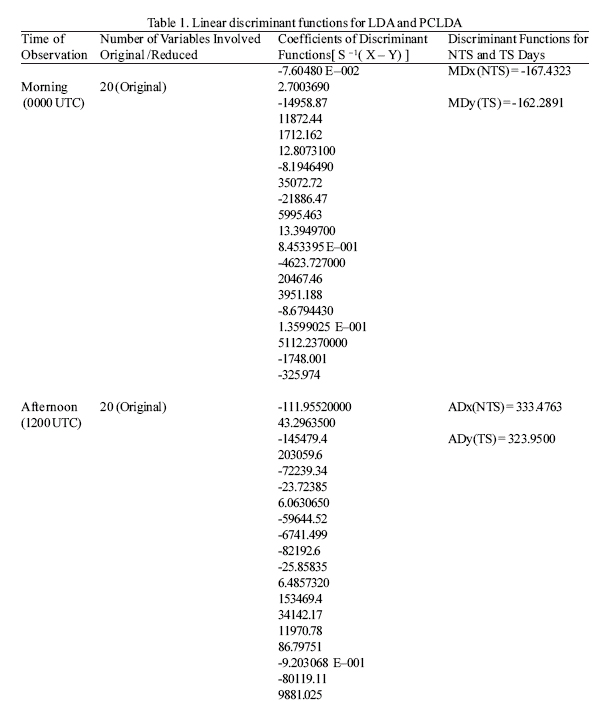
LDA-output (Table 1)
MDx and MDy respectively denote the discriminant functions for NTS and TS for morning and ADx and ADy denote those for afternoon respectively. The values of the discriminant functions as obtained from LDA are as follows:

table 1. Linear discriminant functions for LDA and PCLDA
Autoverification with the above discriminant functions (Table 2) reveals that, in the morning, 53.3% TS cases and 46.6% NTS cases are correctly classified and in the afternoon 2.2% TS cases and 44.4% NTS cases are correctly classified.
PCLDA-output (Table 1)
For the morning, the discriminant functions for NTS and TS are represented by PMDx and PMDy and those for the afternoon are denoted by PADx and PADy respectively. The values of the functions as furnished by PCLDA are given below:
PMDx = -3.405151, PMDy = -6.592593 and PADx = -7.05927, PADy = 27.83625
Autoverification with the above discriminant functions (Table 2) shows that, in the morning, 64.4% TS cases and 60% NTS cases are correctly classified, whereas, in the afternoon, 93.3% TS cases and 77.8% NTS cases are correctly classified.
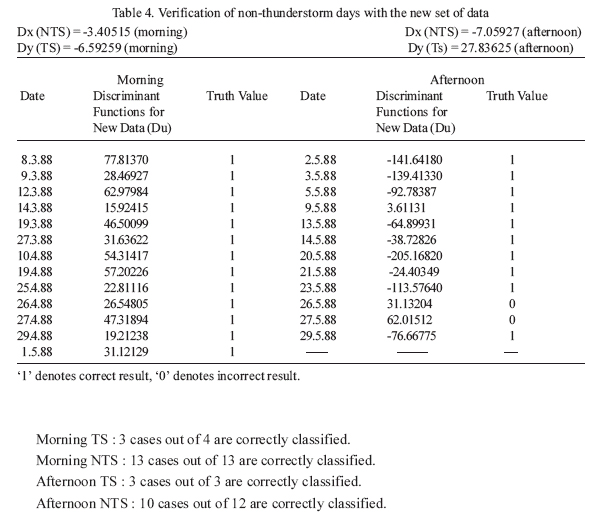
In Table 3 and Table 4, only the results of PCLDA for 1988 have been presented. It is to be noted that after categorizing the TS and NTS cases as ‘Morning-TS’, ‘Morning-NTS’, ‘Afternoon-TS’ and ‘Afternoon-NTS’ respectively, the application of PCLDA has interpreted the results in a more meaningful way as follows:
table 3. Verification of thunderstorm days with new set of data
table 4. Verification of non-thunderstorm days with the new set of data
4. Conclusion
The present study reveals that the statistical index constructed above not only helps to classify a TS or an NTS day, but it can also be used for 12-hour forecasts of pre-monsoon weather in Calcutta, India. Moreover, since the nature of the method is objective, it can be expected to produce more accurate results than any other subjective method.
Hence, it can be concluded that if the LDA technique is to be used for the operational purpose of classifying the TS and NTS days in Calcutta, then instead of dealing with huge data matrices, their dimensionality may be reduced first with the help of the PCA technique without losing any important information.
Acknowledgement
The authors thank the India Meteorological Department for the sanction of a research project. The present work forms a part of that project.
References
Asnani, G. C., 1992. Tropical Meteorology 2, Asnani G. C., India, pp. 829-833, 852. [ Links ]
Betts, A. K., 1974. Thermodynamic of tropical convective soundings, Month. Weather Rev., 102, 760-764. [ Links ]
Bolton, D., 1980. The computation of equivalent potential temperature, Month. Weather Rev., 108, 1046-1053. [ Links ]
Chowdhury, A. M, S. Ghosh, and U. K. De, 1996. Analysis of pre-monsoon thunderstorm occurrence at Dhaka from 1983 to 1992 in terms of (θes-θe) and convergence/divergence at surface, Indian J. Phys., 70B(5), 357-366. [ Links ]
Darkow, G. L., 1968. The total energy environment of storms, J. Appl. Meteorol., 7, 199-205. [ Links ]
Fujita,T. T., D. L. Bradbury and C. F. van Thillenar, 1970. Palm Sunday tornadoes of April 11, 1965, Month. Weather Rev., 98, 26-29. [ Links ]
Galway, J. G., 1956.The lifted index as a predictor of latent instability, Bull. Am. Meteorol. Soc., 37, 528-529. [ Links ]
Ghosh, S., A. Manna and U. K. De, 1998. Study of Thermodynamic Nature of the Atmosphere at Dumdum, Calcutta (22.38° N, 88.28° E) on Thunderstorm and Fair-weather Days, Indian J. Phys., 72B(2), 137-144. [ Links ]
Ghosh, S., P. K. Sen and U. K. De, 1999. Identification of significant parameters for the prediction of pre-monsoon thunderstorms at Calcutta, Int. J. Climatol., 19, 673-681. [ Links ]
Kessler, E., 1982. Thunderstorm Morphology and Dynamics, US Department of Commerce, USA, pp. 2, 5-7, 93-95, 146-149. [ Links ]
Kuo, H. L., 1965. On formation and intensification of tropical cyclones through latent heat release by cumulus convection, J. Atmos. Sci., 22, 40-63. [ Links ]
Lawson, M. P. and R. S. Cerveny, 1985. Seasonal temperature forecasts as products of antecedent linear and spatial temperature arrays, J. Clim. Appl. Meteorol., 24, 848-859. [ Links ]
Miller, R. G., 1962. Statistical prediction by discriminant analysis, Meteorol. Monog., 4, No. 25, 53. [ Links ]
Miller, R. G., 1972. Notes on analysis and severe storm forecasting Procedure of the air Force Global Weather Control, AFGWC Technical Report 200 (Rev), Air Weather Service, US Air Force. [ Links ]
Sánchez, J. L., R. Fraile, M. T. de la Fuente and J. L. Marcos, 1998. Discriminant Analysis Applied to the forecasting of Thunderstorms, Meteorol. Atmos. Phys., 68, 187-195. [ Links ]
Sharma, S., 1996. Applied Multivariate Techniques, John Wiley & Sons, Inc., 66-67. [ Links ]
Showalter, A. K., 1953. A Stability Index for Thunderstorm Forecasting, Bull. Am. Meteorol. Soc., 34, 250-252. [ Links ]
Ward, M. N. and C. K. Folland, 1991. Prediction of seasonal rainfall in the north Nordeste of Brazil using eigen vectors of sea-surface temperature, Int. J. Climatol., 11, 711-743. [ Links ]
Wilks, D. S., 1995. Statistical Methods in the Atmospheric Sciences, Academic Press, New York, 409-415. [ Links ]
Williams, E. and N. Renno, 1993. An analysis of the conditional instability of the tropical atmosphere, Month. Weather Rev., 121, 23-26. [ Links ]

