


Servicios Personalizados
Revista
Articulo
 Inglés (pdf)
 Artículo en XML
 Referencias del artículo
 Enviar artículo por email
Indicadores
-
 Citado por SciELO
 -
 Accesos
Links relacionados
-
 Similares en
SciELO
Similares en
SciELO
Compartir

 Permalink
Atmósfera
versión impresa ISSN 0187-6236
Atmósfera vol.16 no.3 Ciudad de México jul. 2003
Urban-suburban/rural differences over Greater Cairo, Egypt
S. M. Robaa
Astronomy and Meteorology Department, Faculty of Science - Cairo University, Giza - Egypt. E- mail: d_robaa@hotmail.com.
Received June 19, 2002; accepted December 4, 2002.
RESUMEN
Se investigaron las diferencias de temperatura del aire, presión de vapor y humedad relativa, en horas fijas, de distritos urbanos, suburbanos y rurales del área del Cairo, Egipto, utilizando datos del período 1995-2000. Con base en las diferencias de la presión de vapor, se encontró que la atmósfera urbana es más seca durante todo el año excepto los meses de enero, diciembre, mayo y septiembre. En las tardes la atmósfera urbana es más húmeda durante todo el año al compararla con la del área suburbana, y durante los meses de octubre a enero, además de mayo, si se compara con el área rural. En función de la humedad relativa la atmósfera urbana siempre es más seca que sus alrededores durante todo el año, excepto en las tardes, cuando las diferencias urbano-rurales fluctúan entre positivo y negativo. La atmósfera urbana siempre es más caliente que sus alrededores durante todo el año excepto en el mes de noviembre cuando hay una isla fría. Las relaciones entre la intensidad de la isla de calor y las diferencias tanto de la presión de vapor como de la humedad relativa indican que los efectos locales pueden ser significativos.
ABSTRACT
Air temperature, vapour pressure and relative humidity differences at fixed hours in urban, suburban and rural districts of Cairo area, Egypt, have been investigated using data for the 1995-2000 period. It has been found that, on the basis of the vapour pressure differences, the urban atmosphere is drier throughout the year except for the months of December, January, May and September. In the afternoon, the atmosphere in the urban area is more humid throughout the year if compared to the suburban area and during the months from October to January in addition to May if compared to the rural area. On the basis of relative humidity, the urban atmosphere is always drier than its surroundings throughout the year, except in the afternoon when the urban-rural differences fluctuated between positive and negative. The urban atmosphere is always warmer than its surroundings throughout the year, except in November when there is a cool island. Relationships between heat island intensity and both vapour pressure and relative humidity differences reveal that local effects can be significant.
Key words: Urban/suburban/rural atmospheres, air temperature, vapour pressure, relative humidity.
1. Introduction
Urbanization and industrialization have resulted in the modification of local city climate. This modification involves the alteration of the local humidity and air temperature. The effect of urbanization on air temperature (Urban Heat Island) is now well documented for several cases (e.g. Oke, 1995; Kuttler, 1998; Montavez et al., 2000 and Tereshchenko and Filonov, 2001). Also, the effect of urbanization on the humidity field has been studied in detail by various investigators (e.g. Kratzer, 1956; Nieuwolt, 1966; Padmanabhamurty, 1979; Jauregui, 1986; Oguntoyinbo, 1986; Padmanabhamurty, 1986; Abedayo, 1991; Unkasevic, 1996; Jauregui and Tejeda; 1997 and Unkasevic et al., 2001). It has been demonstrated that the central parts of cities are usually drier than their environs. This phenomenon is often referred to as the "Urban Humidity Island". Its intensity could be identified as the differences between rural and urban humidities. Factors affecting the distribution of urban humidity are mixing influences of surface roughness, moisture sources and thermal fields. These factors have contributed to the following patterns of modification of urban moisture. Chandler (1967) found that absolute humidities were sometimes higher at night in urban than in rural areas, although daily mean values of absolute humidity were lower for the urban area. Using dew-point measurements, Kopec (1973) found that, with clear skies and higher but uniform winds, urban vapour pressure was higher during the night and lower in the morning and afternoon in comparison with the vapour pressure in suburban and rural areas. Hage (1975) examined urban-rural absolute and relative humidity differences in Edmonton. He found that the annual maximum of absolute humidity differences was at night in March and August (city moist), and in daytime in July (city dry). He also found that relative and absolute humidities were higher in the city area at any time in winter because of vertical mixing and an increase in combustion sources. Brazel and Balling (1986) suggested that changes in the local land use developed a urban heat island and caused the observed patterns in the Phoenix atmospheric moisture levels. Ackernan (1987) suggested that in Chicago urban vapour pressure and dew points were lower than in the rural areas only in the forenoon and on spring afternoons. Urban-rural differences in these two variables also varied with ambient wind speed, cloud cover and moisture stratification in the surface boundary layer.
Unger (1999) investigated the urban influence on diurnal and annual patterns of vapour pressure in Szeged, Hungary. He found that the air in the city center is more humid than in the rural areas both by day and at night during the whole year. He also found that the differences and variations of urban humidity excess could be explained by different moisture sources and by different energy balances in the urban and rural environments.
In Sweeden, Holmer and Eliasson (1999) investigated the role of urban-rural humidity differences during clear and calm nights in the development of the urban heat island with focus on the longwave radiation balance and the latent heat flux. They concluded that the statistical analysis of the nocturnal development of urban moisture excess (UME) demonstrated that the UME could develop from three combinations of urban and rural vapour pressure changes. Also, the advection of dry air from the urban heat island circulation was considered to influence the urban vapour pressure change.
Unkasevic et al. (2001) analysed and compared the urban-suburban/rural vapour pressure and relative humidity differences in Belgrade. They found that the urban atmosphere is drier according to vapour pressure differences than the suburban and rural ones in the afternoon throughout the year. They also found good relationships between heat island intensity and urban-rural vapour pressure and relative humidity differences.
This paper examines the seasonal and diurnal patterns of urban-suburban / rural vapour pressure, relative humidity and air temperature differences between different districts in Greater Cairo.
2. Study area
Greater Cairo region lies south of Delta in the Nile basin. It is considered as one of the world's 15 largest cities in urban and population growth. Population in Greater Cairo region exceeds 15 millions concentrated over an area of about 214 km2 (almost 4.2 km width and 50 km along the sides of the River Nile). The urbanization and industrialization have increased very rapidly in Greater Cairo, particularly in the second half of the last century causing an increase in the pollution of its atmosphere. This in turn has an effective role in intensifying the problem of contaminating Cairo's environment with various impurities and environmental hazards (Robaa and Hafez, 2002).
Climatologically, Greater Cairo is in the subtropical climatic region. The city is characterized by the presence of Moqattam hills to the east and south east, then desert areas extending in the west and east directions. Among the outstanding weather events are the dust and sandstorms that frequently blow in transitional seasons of spring (March to May) and autumn (September to November). In spring, hot desert depressions are known as the Khamsin depressions. They are always associated with strong hot dry wind often laden with dust and sand increasing the atmospheric pollution. In winter (December to February) the general climate of the Greater Cairo region is cold, moist and rainy while during summer (Jun to August), Cairo's climate is hot, dry and rainless. Greater Cairo region is composed of four main areas as can be seen in Figure 1.

(a) The Shubra El-Kheima industrial complex area lies at the northern boundary of Cairo City. Its area is about 30 km2 and has over 550 industrial plants of various sizes. Textile manufacturing is the predominant activity, followed by engineering construction, chemical, petroleum and electrical industries. Emissions from these industries directly affect the air quality in the Central Cairo since it is frequently upstream (Mossad, 1996). There is no meteorological stations established at Shubra El-Kheima until now.
(b) The Central Cairo lies at the center on the east bank of the River Nile. It accommodates more than 80% of the population and includes thousands of small factories and workshops in addition to more than one and half million of automobiles travelling on the city roads.
(c) A narrow strip of Giza Governorate runs along the western side of the River Nile, opposite to the Central Cairo. This sector has two main, but small, industrial centers: one in the northern part of the strip and the other in the south. Residential districts lie between both industrial centers.
(d) The heavy industry area of Helwan, is about 24 km to the south east of Central Cairo. The most important factors in this area are the steel, cement, chemical, fertilizer, brick and car industries and power plants.
The study area has been represented by three selected meteorological stations situated inside Greater Cairo region and represent different degrees of urbanization. Abbasiya (φ = 30° 05' N, λ = 31° 17' E, h = 34.4 m) represents the urban area, Cairo Airport (φ = 30° 08' N, λ = 31° 24' E, h = 74.5 m) represents the suburban area and Bahtim (φ = 30° 07' N, λ = 31° 15' E, h = 16.9 m) represents the rural area (Fig. 1). A brief description of the three selected sites are given below.
1. Abbasiya meteorological station (main building of the Egyptian Meteorological Authority, EMA) lies on the east bank of the River Nile near Central Cairo on the road leading from the city to the suburb of Heliopolis, to the northeast part of Cairo city. There are many factories in the nearby area too. High density of buildings and high density of population exist in addition to thousands of cars and buses. Streets are covered by asphalt and gardens are not abundant. The local soil is originally desert sand. There is no any moisture sources except the River Nile. Generally, air quality in the Abbasiya station represents the typical urbanization atmosphere in and around Cairo City.
2. The international Cairo Airport lies about 29 km to the north east border of Central Cairo in the eastern desert. The Airport is surrounded by the desert in all directions except the southwest, where the Central Cairo and Abbasiya urban area are located. There is a very vast open area around the Airport runway. There are no any buildings or human activities around the Airport and the shortest distance between the nearest buildings and the Airport place is not less than 12 km. The majority of the asphalt roads and the associated traffic that exist around the Airport connects it with the surrounding areas. The local soil of the Airport is originally desert sand and there is no any moisture sources at the Airport location.
3. The Bahtim agrometeorological station lies about 13 km to the north west of Central Cairo near the border between urbanized and cultivated areas. It was established at the end of1966 in the grounds of the Agricultural Research Station of the Agricultural Society at Bahtim and it is working on a routine basis up till now (2003). The Bahtim station included a dry and bare field up to 1970. Afterwards it included a wet field covered with grass (Lippa-Nodiflora). The surrounding area is cultivated land and is considered a good example of the rural areas. The irrigation in Bahtim, in addition to the Nile water, are important and good moisture sources. Unfortunately, the growth of population and human activities are increasing rapidly in the Bahtim area during the last few last years. All the above stations were adequately and regularly serviced by the Egyptian Meteorological Authority.
3. Data used
Wet and dry-bulb measurements (°C) at the three selected stations of Abbasiya, Cairo Airport and Bahtim were taken from the wet and dry-bulb thermometers readings twenty four times a day by observers and the values were annotated and stored in tables on a monthly basis. The three stations had mercury thermometer shelters with Assman type psychrometers, which are freely exposed in the double roofed louvered screens at a height of 2 m above the ground. The calibration was controlled every month by comparing the instruments. The relative humidity (%) and vapour pressure (hpa) values were calculated with the psychrometer table of the Hungarian Meteorological Service (OMSZ, 1982), which contains humidity values at temperatures between - 40 and + 50 °C. Corrections for wind speeds and atmospheric pressure were applied. The wind speed and direction were measured by the cup-anemometer instrument at the three stations. The instrument head was freely exposed and erected at 10 m above the ground. Surface wind observations were the mean wind speed and the mean wind direction over a period of ten minutes ending at the hour of observation. The monthly mean surface wind speed and direction was the arithmetic mean of the daily wind speed observations.
Urban-suburban/rural mean surface air temperature, T (°C), vapour pressure, e (hpa), and relative humidity, RH (%), differences at fixed hours of 0600, 1400 and 2200 hours during the period (1995-2000) were observed at the three selected stations of Abbasiya, Cairo Airport and Bahtim using hourly meteorological data of T, e, and RH. These fixed hours have been chosen to represent the periods of the early morning, noon and the evening. Also, the monthly mean values of wind speed, V (kt), direction and total rainfall amount (mm) at the selected stations for the study period (1995-2000) have been used. These data were obtained from the Egyptian Meteorological Authority. The Kolmogoroff-Smirnoff homogeneity test was carried out and adjustments were made to filter out the inhomogeneities due to instruments and observational errors.
4. Results and discussion
It has been found that the reduction in vegetation cover and decrease in surface water in cities led to a greater sensible than latent heat flux (increased Bowen ratio). Also, evaporation processes continue throughout nighttime in cities due to higher nocturnal temperatures and beacuse many combustion processes and industrial activities release water into city's atmosphere (Nunez and Oke, 1977; Oke, 1979; and Grimmound and Oke, 1999 and 2002).
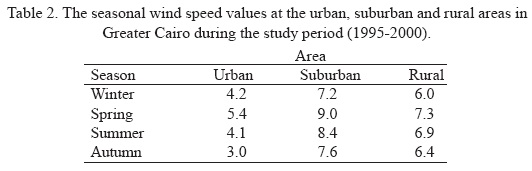
In order to get a better understanding of the main characteristics of air humidity over the study area, the monthly mean of surface wind speed (kt), direction and the total rainfall amount (mm) for the urban, suburban and rural areas during the study period (1995-2000) are presented in Figure 2 and Tables 1 and 2. While the differences between the urban, suburban and rural values of water vapour pressure Δe, relative humidity (ΔRH) and air temperature (ΔT) have been estimated and presented in Figures 3, 4 and 5.


4.a The annual variation of wind speed, direction and the total rainfall amount
It could be noticed that wind speed values at the suburban area are always greater than those at the urban and rural areas, and that rural values are also higher than those of the urban area through all the year (Fig. 2a). The greater value of wind speed at the suburban area is due to a vast open area around the runway of the Airport. The lower value of wind spedd at the urban area may be attributed to the fact that wind speeds are generally lower in the built up areas than in their surroundings resulting from the increase in surface roughness within cities (Chandler, 1965 and Jauregui, 1986). The urban, suburban and rural areas have their maximum wind speed during May (5.6, 7.8 and 9.6 kt for urban, rural and suburban areas respectively). This is may be attributed to Khamsin depressions that are more common during spring (March to May) over Egypt. These depressions are characterized by strong hot and dry winds that distinctly cause the decreasing of the amount of water vapour content and the increasing of the dust content in the lower layers of the atmosphere (Hasanean, 1993).
It is also noticed that wind speed values at the suburban area are always greater than values at the urban and rural areas during all seasons of the year while the urban area has the lowest values (Table 2). Furthermore, the urban, suburban and rural areas have maximum values of wind speed during spring (V = 5.4, 7.3 and 9.0 kt for urban, rural and suburban areas respectively). This is due to the invasion of hot dry wind from the Khamsin depressions as mentioned above. The suburban and rural areas have minimum values during winter while the urban area has its minimum value during the autumn.
Table 1 shows that most of the wind over the urban, suburban and rural areas are always northern wind wherein the wind directions range from NW to NE during all year. These directions of the wind could cause rapid transportation of pollutants and other urbanized effects from the industrial complex area of Shubra El-Kheima to the rural area of Bahtim and the urban area of Abbasiya.
On the other hand, it was found that the total rainfall amount at the rural area is always greater than the amounts at the suburban and urban areas with higher values in the suburban area during the October to March period (Fig. 2b). It can be easily noticed that the arrangement of the total rainfall amount agree with the degree of urbanization for each station, i. e., whenever urbanization increases, the total rainfall amount decreases. The cold season (November to January) is considered a rainy season because the maximum total rainfall amount at the study area ocurred in December (16.3, 12.7 and 8.3 mm for rural, suburban and urban areas respectively) while the April to September period is rainless.
4.b The water vapour and air temperature differences
4.b.1 At 0600 hours
The results revealed that the early morning time (0600 hours) in the urban area is always drier than the rural area all year and the urban heat island is always below 2.1 °C (Fig. 3a). Furthermore, this effect is larger during the warm season of the year (from March to October). This is attributed to the increased air temperature during the warm season that favours rural evaporation and evapotranspiration processes. This process causes an increase of water vapour content in the rural atmosphere compared to the smaller release of water vapour from anthropogenic sources in the urban area, which in turn leads to an increase of Δe. It is also noticed that the rural atmosphere becomes slightly humid compared to the urban atmosphere during May whereas Δe reaches its maximum value (- 0.5 hpa) (Fig. 3a). This is due to smaller rural evapotranspiration as a consequence of the remotion of agricultural plants during the month of May.
It can be easily seen that the two patterns of Δe for urban-rural and urban-suburban are similar (Figs. 3a, b). However, the values of Δe for urban-rural are lower than that Δe for urban- suburban. This is attributed to the rural atmosphere being more humid than that in the surroundings, especially in the morning hours. A negative heat island intensity (cool islands) exists for the urban-suburban areas during November (Δe = - 0.5 °C) (Fig. 3b). This is due to the higher values of cloud cover and fog over the suburban Cairo Airport area during the early mornings of November, which retard the nocturnal cooling and in turn cause relatively higher values of air temperature compared to the urban area (Robaa, 1999).
4.b.2 At 1400 hours
At 1400 hours, during the months of February to September, except May, the urban area is drier than the rural area and the monthly mean urban heat island ranges between 1.0 °C to 2.2 °C (Fig. 4a). The exception is the month of May whereas Δe reaches a maximum positive value (+ 2.0 hpa) while ΔT reaches its minimum value (+ 0.5 °C) (Fig. 4a). This is due to, as mentioned above, smaller rural evapotranspiration as a consequence of the removed agricultural plants in May compared to relatively higher urban release of water vapor from the anthropogenic sources. Other reason could the effects of strong dry Khamsin winds which remove more water vapor from the rural atmosphere than the removed from the urban atmosphere, whereas these winds have higher speeds at rural than urban areas (Fig. 2a). On the other hand, during the cold season (October to January), the urban atmosphere is more humid than in the surroundings, and the urban heat island is around 1 ° C.
A significant contrast between ΔT and Δe values is found in August (Fig. 4a). This is due to greater rural evapotranspiration as a consequence of increased irrigation and growth of cultivated plants, especially maize, and the smaller release of water vapour from anthropogenic sources in the urban area.
On the other hand, urban atmosphere is more humid than that of the suburban area of Cairo Airport in the afternoon all year around, and the urban heat island is approximately 1.0 °C (Fig. 4b). This is due to the naturally small atmospheric water vapour content at the desert of the suburban area, especially at afternoon hours, as well as to the highest wind speed at the Airport area that removes more water vapour from its atmosphere than the removed water vapour from the urban atmosphere due to its lower wind speed (Fig. 2a).
4.b.3 At 2200 hours
At 2200 hours, both the temperature and vapour pressure differences between urban and rural areas are similar to those at 0600 hours except for the values at 2200 that are higher for most months (Fig. 5a). Furthermore, at 2200 hours, the air temperature differences between urban and rural areas are at the maximum almost throughout the year (Fig. 5a), except in the suburban area (Fig. 5b), where the temperature differences varied between 0.3 °C and 1.8 °C throughout the year by reason of the decrease of the temperature due to the relatively higher altitude of Cairo Airport station (75 m).
4.c Relative humidity differences
The statistical analysis of the provided computations revealed that the urban-suburban/ rural relative humidity differences are negative at 0600 and 2200 hours (Figs. 3a', b' and 5a', b'), i. e., relative humidity is lower in the city than in the surroundings. Evapotranspiration from the great area of vegetation existing in the rural area of Bahtim as well as the increased evaporation from irrigated wide fields increase the atmospheric water vapour compared to urban and suburban areas. This result agrees with Oguntoyinbo (1986). On the other hand, it can be seen from Figure 4a' at 1400 hours, that the urban-rural relative humidity differences are negative all year round, except in May. Figure 4b' shows that at 1400 hours, the urban-suburban relative humidity differences fluctuate between negative and positive values as a consequence of the fluctuating moisture characteristics of the suburban area between humid and dry atmospheres.
It is also noticed that the temporal pattern in the relative humidity differences is reverse to the temporal pattern of the temperature differences between the mentioned stations, with minimum and maximum of ΔRH coincident with maximum and minimum of the heat island. This means that the maximum (minimum) dry island intensity has been generally formed over the urban area during the periods of maximum (minimum) heat island intensity. It was found that the maximum dry heat island intensity has been generally formed over the urban area during night hours while the minimum has been formed in the afternoon all over the year (Robaa 1999). This means that relative humidity is a sensitive function of temperature and the urban-suburban/ rural differences are strongly affected by the urban heat island. However, vapour pressure is a direct measure of moisture contents, but because the air can hold less water vapour at low temperatures than at high, the importance of small differences in cold weather tends to be obscured.
It is clear from this study, that the concept of an "urban dry island" may be valid during the warm part of the year. Even within relatively well defined temporal periods, the urban-suburban/ rural differences in the vapour pressure may get an opposite sign due to various changes of moisture generation and transfer over urban, suburban and rural surfaces, related to changes of weather factors and in human activities. The obtained results are generally similar to the seasonal and diurnal patterns observed in other, but more humid, mid-latitude cities (Hage, 1975; Landsberg, 1981; Ackerman, 1987; Lee, 1991; Unkasevic et al., 2001).
4.d Relationship of ΔT with Δe and ΔRH
The relationships between heat island intensity, ΔT, and urban-suburban/ rural vapour pressure differences, Δe, and humidity island intensity differences, have been determined using all values for all months. The obtained relations are given below;
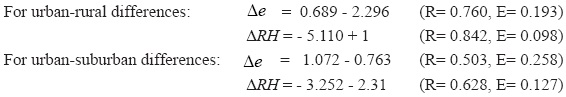
Where R is the correlation coefficient and E is the standard mean error.
It is clear that heat island intensity is correlated with water vapour pressure differences in direct proportional relation while it is correlated with relative humidity differences in inverse proportional relation. The obtained correlation coefficients (from 0.503 to 0.760 for water vapour and from 0.628 to 0.842 for relative humidity) indicate that local effects (weather, topography, human activities and vegetation) could be significant.
5. Conclusions
Detailed studies on the effect of urbanization and industrialization on urban water vapour, relative humidity and heat island intensity over Cairo City, Egypt, have been performed. The data of the above meteorological elements at 0600, 1400 and 2200 hours L.T. in addition to the monthly mean values of wind speed, direction and total rainfall amount throughout the 1995-2000 period over urban, suburban and rural districts have been used. Final results and conclusions could be summarized in the following points:
1. The wind speed values at the suburban area are always greater than the values at the urban and rural areas with higher values of rural than urban areas throughout the year, while all areas have their maximum wind speed during spring, especially in May. Most of the wind over the urban, suburban and rural areas is always northern wind all year around, factor that could increase air pollution over both, rural and urban areas.
2. The cold season (November to January) is a rainy season, especially in December when the maximum total rainfall amount at the study area ocurred, while the April to September period is rainless. The total rainfall amount at the rural area is always greater than that at the suburban and urban areas, and the values of the suburban area are higher than those of the urban area. The arrangements of the total rainfall agree with the degree of urbanization for each site: whenever urbanization increases, the total rainfall decreases.
3. There are clear seasonal and diurnal patterns of urban-suburban/rural humidity differences in Cairo City. Mean monthly vapour pressure differences range from - 2.6 to + 2.0 hpa and from - 1.3 to + 3.1 hpa for urban-rural and urban-suburban differences respectively. Mean monthly relative humidity differences range from - 23.3% to + 1.8% and from - 11.0% to + 4.6% for urban-rural and urban-suburban differences respectively.
4. The urban atmosphere is drier according to the vapour pressure differences than the suburban and rural ones in the early morning (0600 hours) and night (2200 hours) throughout the year, except for the months of December, January, May and September with respect to the nocturnal differences. In the afternoon (1400 hours), the urban atmosphere contains more moisture all year around compared to the suburban area and from October to January in addition to May, compared to the rural area.
5. Based on relative humidity, the urban atmosphere is always drier than its surroundings throughout the year except in the afternoon (1400 hours) when the urban-rural differences fluctuated between negative and positive.
6. The value of dryness of the urban atmosphere during warm months (from March to October, except May) is higher than its value during cold months (From November to February).
7. The nocturnal urban-rural temperature, vapour pressure and relative humidity differences are greater than their corresponding daytime differences.
8. The urban area is always warmer than its surroundings throughout the year except in November, when there is a cool island.
9. The maximum dry heat island intensity has been generally formed over the urban area during night hours while the minimum one has been formed in the afternoon all year around.
10. There are remarkable relationships between the heat island intensity and both, vapour pressure and relative humidity differences, which indicate that the local effects are significant.
References
Ackernan, B., 1987. Climatology of Chicago area urban-rural differences in humidity. J.Climate Appl. Meteor. 26, 427:430. [ Links ]
Abedayo, Y. R., 1991. Day-time effects of urbanization on relative humidity and vapour pressure in a tropical city. Theor. Appl. Climatol. 43, 17-30. [ Links ]
Brazel, W. S. and R. J. Balling, 1986. Temporal analysis of long term atmospheric moisture levels in Phoenix, Arizona. J. Climate Appl. Meteor. 25, 112-117. [ Links ]
Chandler, T. J., 1965. The climate of London. Hutchinson, London. [ Links ]
Chandler, T. J., 1967. Absolute and relative humidities in town. Bull. Amer. Meteor. Soc. 48, 394-399. [ Links ]
Grimmoud C. S. B. and T. R. Oke, 1999. Heat storage in urban areas: Local-scale observations and evaluation of a simple model. J. Appl. Meteor. 38, 7, 922-940. [ Links ]
Grimmoud C. S. B. and T. R. Oke, 2002. Turbulent heat fluxes in urban areas: Observations and local-scale urban meteorological parameterization scheme (LUMPS). J. Appl. Meteor. 41, 7, 792-810. [ Links ]
Hage, K. D., 1975. Urban-rural humidity differences. J. Appl. Meteor. 14, 1277-1283. [ Links ]
Hasanean, H. M., 1993. Studies on some regional climatic changes over Egypt. M. Sc. Thesis in Meteorology, Faculty of Science, Cairo University, Egypt. [ Links ]
Holmer, B. and I., Eliasson, 1999. Urban-rural vapour pressure differences and their role in the development of urban heat islands. Int. J. Climatol. 19, 989-1009. [ Links ]
Jáuregui, E., 1986. The urban climate of Mexico City. Urban Climatology and its applications with special regard to tropical areas. Proceedings of the Technical Conference. Mexico D.F., 26-30 November 1984, WMO, No.652, 63-86, Geneva. [ Links ]
Jáuregui, E. and A. Tejeda, 1997. Urban-rural humidity contrasts in Mexico City. Int. J. Climatol. 17, 187-196. [ Links ]
Kopec, R. J., 1973. Daily spatial and secular variations of atmospheric humidity in a small city. J. Appl. Meteor. 12, 639-648. [ Links ]
Kratzer, A., 1956. Das Stadtklima, Wieweg and Sohn, Braunschweig, p. 184. [ Links ]
Kuttler, W., 1998. Stadtklima. in Heyer, E. (ed.), Witterung und Klima, Teubner, Stuttgart-Leipzig, 328-364. [ Links ]
Landsberg, H. E., 1981. The urban climate. (Int. Geophysical Series, V. 28): Academic Press, 275. [ Links ]
Lee, D. O., 1991. Urban-rural humidity differences in London. Int. J. Climatol. 11, 577-582. [ Links ]
Montávez, J. P., A. Rodríguez and J. I. Jiménez, 2000. A study of the Urban Heat Island of Granada. Int. J. Climatol. 20, 899-911. [ Links ]
Mossad, E. I., 1996. Studying the solar radiation in different spectral bands and its attenuation by the air pollutants in different regions of the Great Cairo. Ph.D. Thesis, Faculty of Science, Mansoura University. [ Links ]
Nieuwolt, S., 1966. The urban microclimate of Singapore. J. Trop. Geog. 22, 30-37. [ Links ]
Núñez, M. and T. R. Oke, 1977. The energy balances of an urban canyon. J. Appl. Meteor. 16, 11-19. [ Links ]
Oguntoyinbo, J. S., 1986. Some aspects of the urban climates oftropical Africa. Urban Climatology and its applications with special regard to tropical areas. Proceedings of the Technical Conference. Mexico D.F., 26-30 November 1984, WMO, No.652, 110-135, Geneva. [ Links ]
Oke, T. R., 1979. Review of urban Climatology, 1973-76. WMO Technical Note 169, WMO, Geneva. [ Links ]
Oke, T. R., 1995. The heat island of the urban boundary layer: Characteristics, causes and effects. in Cermak, J. E. et al. (eds.), Wind climate in cities, Kluwier Academic Publishers, 81-107. [ Links ]
OMSZ, 1982. Tables for the calculation of the values of aspirated psychrometers. Hungarian Meteorological Service, Budapest. [ Links ]
Padmanabhamurty, B., 1979. Isotherms and isohumes in Pune on clear winter nights: a Mesometeorological study. Mausam, 30, 134-138. [ Links ]
Padmanabhamurty, B., 1986. Some aspects of the urban climates of India. Proceedings of the Tech. Conf. on urban Climatology and its applications with special regard to tropical area, Mexico D.F., 26-30 Nov.1984, WMO, No.652, WMO, Geneva. [ Links ]
Robaa, S. M., 1999. Impact of Urbanization on Meteorology and Human Comfort in Greater Cairo, Egypt. Ph.D. Thesis in Meteorology, Faculty of Science, Cairo University, Egypt. [ Links ]
Robaa, S. M. and Y. Y. Hafez, 2002. Monitoring urbanization growth in Cairo City. J. Engi. Appl. Sci. 49, 667-679. [ Links ]
Tereshchenko I. E. and A. E. Filonov, 2001. Air temperature fluctuations in Guadalajara, Mexico, from 1926 to 1994 in relation to urban growth. Int. J. Climatol. 21, 483-494. [ Links ]
Unger, J., 1999. Urban-rural air humidity differences in Szeged, Hungary. Int. J. Climatol. 19, 1509-1515. [ Links ]
Unkasevic, M., 1996. Analysis of atmospheric moisture in Belgrade, Yugoslavia. Meteor. Zeit. 3, 121-124. [ Links ]
Unkasevic, M., O. Jovanovic and T. Popovic, 2001. Urban-suburban/rural vapour pressure and relative humidity differences at fixed hours over the area of Belgrade City. Theor. Appl. Climatol. 68, 67-73. [ Links ]

