


Servicios Personalizados
Revista
Articulo
 Inglés (pdf)
 Artículo en XML
 Referencias del artículo
 Enviar artículo por email
Indicadores
-
 Citado por SciELO
 -
 Accesos
Links relacionados
-
 Similares en
SciELO
Similares en
SciELO
Compartir

 Permalink
Atmósfera
versión impresa ISSN 0187-6236
Atmósfera vol.16 no.3 Ciudad de México jul. 2003
Interannual variability of relative angular momentum in the Northern Hemisphere and its relationship with the North Atlantic oscillation and the Arctic oscillation
Laura de la Torre, Luis Gimeno, Pedro Ribera
Departamento de Física Aplicada, Universidad de Vigo, Ourense, España. Corresponding author: Luis Gimeno; e-mail: l.gimeno@uvigo.es.
David Gallego, Ricardo Garcíaand Emiliano Hernández
Departamento de Física de la Atmósfera, Universidad Complutense, Madrid, España.
Received February 27, 2002; accepted April 30, 2003.
RESUMEN
Se calculó el momento angular relativo (MAR) desde 500 hPa hasta 200 hPa y de la latitud 55° N a 90° N para el periodo 1958-1998. En este estudio se utilizaron datos del re-análisis NCAR-NCEP, y su principal objetivo fue encontrar una medida anual para compararla con la oscilación ártica (OA) y con la oscilación del Pacífico del Norte (OPN). Las correlaciones entre el MAR y la OA fueron mayores que las observadas entre el MAR y la OPN, y los análisis espectrales mostraron una banda común significativa de oscilación cercana a los ocho años.
ABSTRACT
The relative angular momentum (RAM) from 500 hPa to 200 hPa and from 55° N to 90 °N was computed for the 1958-1998 period. NCAR-NCEP reanalysis data were used in this study, whose main purpose was to find an annual measurement to compare with the Arctic Oscillation (AO) and the North Atlantic Oscillation (NAO). Annual values of RAM exhibited a clear positive trend consistent with positive trends found in AO and NAO. The correlations between RAM and AO were higher than those between RAM and NAO and the spectral analysis showed a common significant band of oscillation ca. to eight years.
Key words: Variability, angular momentum, North Atlantic and Artic oscillations.
1. Introduction
When analyzing the sea level pressure (SLP) field at a global scale through the Empirical Orthogonal Function technique (EOF) (von Storch, 1984) Thompson and Wallace (1998) called the leading function the Arctic Oscillation (AO). The AO is a seesaw of atmospheric pressure between the area over the Pole and a latitudinal ring passing over Southern Alaska and Central Europe, and a subtropical area center passing over the Azores. The North Atlantic Oscillation (NAO) is also defined as a seesaw of pressure, but restricted to the North Atlantic Region. It was first identified by sir Gilbert Walker (Walker, 1924; Walker and Bliss, 1932) and was regarded as the most important mode of variability over the North Atlantic region until the introduction of AO.
AO resembles the NAO, but with a zone-wise symmetric distribution and having the center of action over the polar cap and not on the Atlantic region. The similarities are so evident that many scientists agree with Wallace (2000), who considers both as the same phenomenon. However it is not yet clear which of the two paradigms (annular mode -AO- or regional mode -NAO-) defines the phenomenon better (Kerr, 1999). According to Thompson and Wallace (2000) and Thompson et al. (2000) NAO is a regional expression of the Northern Hemisphere annular mode. However there are different evidences that question the annular paradigm: the lack of an apparent link between Atlantic and Pacific sectors (Deser, 2000), the lack of symmetry in the geopotential patterns using SVD (Singular Value Decomposition) analysis (Perlwitz and Graf, 2001) and the fact that AO does not reflect the correlations between pressure variability at its centers of action (Ambaum et al., 2001).
A very interesting finding is the fact that there has been a significant positive trend in the AO/ NAO since the 60's, whose magnitude has no precedent in the observational and even the paleoclimate records. This change is associated with cooling over the Northwestern Atlantic and warming over the Eurasian landmass. It accounts for much of the warming trend observed in this region, whereas when the whole hemisphere is considered, AO/NAO accounts for 30% of the temperature trend (Hurrell, 1996; Thompson et al., 2000). Several causes have been suggested for the observed change in the AO/NAO, such as the increasing of greenhouse gas concentrations (Fyfe et al., 1999) and stratospheric ozone depletion (Volodin and Galin, 1999), while unforced variability remains a possibility (Wunsch, 1999). It seems that the latter is responsible of other regional changes such as stronger westerlies in the whole troposphere (Thompson and Wallace, 2000), changes in precipitation patterns into the Eurasian continent (Hurrell, 1995), changes in the storm tracks and intensity over the Atlantic (Hurrell, 1995a) or changes in the blocking frequency (Nakamura, 1996).
One of the common effects of NAO and AO is their influence on zonal wind anomalies. When AO is in positive phase (pressure drops over the polar cap and rises over the latitudes of the Azores) or NAO is in positive phase (pressure drops over Iceland and rises over the Azores) westerly winds northwards of 45° N become stronger. The maximum anomaly is centered near 55-57° N in the lower troposphere and near 65° N in the upper troposphere. A measurement of this anomaly of the westerlies at a planetary scale is the anomaly of the relative atmospheric angular momentum (RAM) from 500 hPa to 200 hPa and from 55° N to 90° N (RAM 500-200, 55-90). RAM is due to zonal winds and varies seasonally by as much as 100%, essentially doubling between the Northern Hemisphere summer and winter due to the strong annual cycle of the jet stream in that hemisphere.
The advantages of using RAM as a climate diagnosis tool lies in its relationship with important climate features such as blocking and storm track since its related to the zonal character of the circulation index. Low (high) RAM values would imply an increase (decrease) of the blocking frecuency. With high RAM conditions in winter, cyclones are more frecuent in the central eastern North Atlantic and northern North Pacific, whereas with low RAM they are more frecuent in the Mediterranean and mid-latitudes of the North Pacific. Anticyclones tend to shift from ocean to mid-continent areas, and from middle to higher latitudes as the RAM goes from high to low values (Bradbury, 1958).
2. Data analysis
Zonal wind (u) data at 850, 500 and 200 hPa levels for the 41 years from 1958 to 1998 from the National Centers for Environmental Prediction-National Center for Atmospheric Research (NCEP-NCAR) reanalysis have been used (Kalnay et al., 1996).
The reanalysis results in fields of atmospheric data for the 1958-present period. It provides daily mean atmospheric data with global coverage. The wind, geopotential height, vertical motion, temperature, and specific humidity on multiple levels have a horizontal resolution of 2.5° × 2.5°, that is the one used in the study. Daily values of RAM(500-200, 55-90) were computed according to the following expression: monthly, seasonal and annual means were constructed from daily means. For annual values, anomalies for the 1958-1998 period were calculated. The NAO index was computed as the normalized pressure difference between Lisbon (Portugal) and Stykkisholmur (Iceland) (Hurrell, 1995), and the AO index was defined as the associated time series of the leading empirical orthogonal function of the sea level pressure field or of the zonally symmetric geopotential height or zonal wind fields based on NCEP/NCAR reanalysis (Thompson et al., 2000; Wallace, 2000)
The study comprises three parts. First, the correlations of both wintertime AO and NAO indices with RAM are analyzed. Then, to detect trends, linear regressions of the three series are computed. Finally, spectral analysis of RAM (500-200, 55-90) winter, AO winter and NAO winter series are computed to look for the time domains where the three series are more concordant, which includes wavelet analysis and spectral Fourier analysis. It must be noted that the main purpose of this paper lies not in detecting trends, but in comparing the behaviour of the three series.
3. Results
Figure 1a shows the geographical distribution of RAM annual means. The maximum momentum belts are found around 55° N latitude, both in the 850-500 hPa and in the 500-200 hPa layers. Maximum correlation between AO index and cap momentum anomalies (Fig. 1b) was obtained for 50-90° N and 55-90° N latitude caps. 80-90° N and 85-90° N latitude caps did not show significant correlations. Correlation coefficients between NAO and momentum caps (Fig. 1c) reached a maximum at 25-30° N and kept constant up to 55° N. Caps northern than 70°N did not show significant correlation. Correlations with AO were always higher than with NAO (in every cap and level).

Correlations between RAM (500-200, 55-90) annual anomalies for the whole cap and by 60° longitude sectors vs. AO (Table 1) reached a maximum (0.74) in the 120-180° E sector and they were higher than 0.5 for all the sectors. Correlations with NAO were similar to the ones reached with AO only for 0-120° W, although they were all around 0.5 except in the 120-180°W sector (0.21). This minimum is the only not significant correlation.

The fact that correlations between sectors are very low (Deser, 2000) does not deny the annular paradigm. Moreover, the fact that, despite its local character, the NAO time series is correlated with an hemispheric magnitude (atmospheric angular momentum) supports the annular paradigm, as it make us think that its influence is not limited to the North Atlantic region, but is more zone-wise extended.
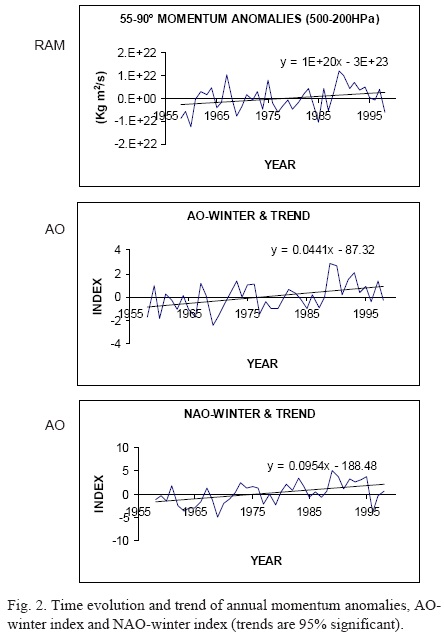
The yearly evolution of NAO winter, AO winter, and annual momentum anomalies (Fig. 2) showed some common features: a) There are significant positive trends caused by the anomalous positive values from the early 80's, which are consequent with previous studies (Hurrell, 1995; Abarca del Rio, 1999; Rosen and Salstein, 2000), b) values are exclusively positive for the 1988-1995 period, and c) they have very similar maximum and minimum peaks (i.e., max. 1967, 1973, 1989).
In order to look for common oscillation periods, Fourier spectral analysis and wavelet analysis (Torrence and Compo, 1998) of AO and NAO winter indices and of momentum winter means were computed. They show a common significant oscillation band centered in 8-9 years. This result agrees with Pozo-Vazquez et al. (2001), who found in NAO a quasi-periodic oscillation, with a period between 6-10 years and maximum amplitude of eight years during the 1842-1868 and 1964-1994 periods. The interpretation of this result must be cautious due to the length of the series (41 years) as compared with the width of the identified band.
These analyses also locate a common oscillation band centered in 20 years. This band is even less significant; only two cycles could be detected in our series.
4. Conclusions
This paper tries to contribute to the debate about the variability modes in the Northern Hemisphere that began with the definition of the AO by Thompson and Wallace (1998). The relative angular momentum from 500 hPa to 200 hPa, from 55° N to 90° N was chosen as a diagnostic tool to analyse annular modes of climate variability because it allows us to show how zone-wise symmetric circulation anomalies actually are. According to this, RAM should be a good indicator of annular character of the main mode of climate variability in the Northern Hemisphere: the Artic Oscillation/ North Atlantic Oscillation.
RAM correlations with NAO and AO are good, but higher with the latter in every sector, cap and level. Correlations with NAO imply that its influence is not limited to the North Atlantic region, but it is more zone-wise extended. This can support the annular paradigm. It must also be pointed out that although the six sectors listed in Table 1 are geometrically equal, their contribution to RAM is different. Most of the variance of the zonal mean velocity field comes from the local contribution in the two jet exit regions over the eastern North Pacific and the North Atlantic. As long as these two sectors are not correlated, the usefulness of the AO paradigm remains questionable.
Acknowledgements
Wavelet software was provided by C. Torrence and G. Compo, and is available at URL: http://paos.colorado.edu/research/wavelets/
References
Abarca del Río, R., 1999. The influence of global warming in Earth rotation speed. Ann. Geophys 17, 806-811. [ Links ]
Ambaum, M. H. P., B. J. Hoskings and D. B. Stephenson, 2001. Arctic Oscillation or North Atlantic Oscillation. J. Clim, 14, 3495-3507. [ Links ]
Bradbury, D. L., 1958. On the behaviour patterns of the cyclones and anticyclones as related to zonal index. Sci., 44, 2310-2323 [ Links ]
Deser, C., 2000. On the teleconnectivity of the "Arctic Oscillation". Geophys. Res. Lett., 19, 779-782. [ Links ]
Fyfe, J. C., G. J. Boer and G. M. Flato, 1999. The Arctic and Antarctic Oscillations and their projected changes under global warming. Geophys. Res. Lett., 26, 1601-1604. [ Links ]
Hurrell, J. W., 1995. Decadal trends in the North Atlantic Oscillation regional temperatures and precipitation. Science, 269, 676-679. [ Links ]
Hurrell, J. W., 1995a. Transient eddy forcing of the rotational flow during northern winter. Journal of Atmospheric Science, 52, 2286-2301. [ Links ]
Hurrell, J.W., 1996. Influence of variations in extratropical wintertime teleconnections on Northern Hemisphere temperatures. Geophys. Res. Lett., 23, 665-668. [ Links ]
Kalnay, E. et al., 1996. The NCEP/NCAR 40-year reanalysis project. Bull. Amer. Met. Soc, 77, 437-471. [ Links ]
Kerr, R. A., 1999. A new force in high-latitude climate. Science, 284, 241-242. [ Links ]
Nakamura, H., 1996. Year-to-year and interdecadal variability in the activity of intraseasonal fluctuations in the Northern Hemisphere wintertime circulation. Theor. Appl. Climatol., 55, 19-32. [ Links ]
Perlwitz, J. and H. F. Graf, 2001. The variability of the horizontal circulation in the troposphere and stratosphere - A comparison. Theor. Appl. Climat., 69, 149-161. [ Links ]
Pozo-Vázquez et al., 2001. A study of NAO variability and its possible non-linear influences on European surface temperature. Climate Dynamics, 17, 701-715. [ Links ]
Rosen, R. D. and D. A. Salstein, 2000. Multidecadal signals in the interannual variability of atmospheric angular momentum. Climate. Dynamics, 16, 693-700. [ Links ]
Thompson, D. W. J. and J. M. Wallace, 1998. The arctic oscillation signature in the wintertime geopotential height and temperature fields. Geophys. Res. Lett., 25, 1297-1300. [ Links ]
Thompson, D. W. J. and J. M. Wallace, 2000. Annual modes in the extratropical circulation Part I: month-to-month variability. J. Clim., 13, 1000-1016. [ Links ]
Thompson, D. W. J., J. M. Wallace and G. C. Hegerl, 2000. Annual modes in the extratropical circulation Part II: trends. J. Clim., 13, 1018-1036. [ Links ]
Torrence, C. and G. P. Compo, 1998. A Practical Guide to Wavelet Analysis. Bull. Amer. Meteor. Soc., 79, 61-78. [ Links ]
Volodin, E. M. and V. Y. Galin, 1999. Interpretation of winter warming on Northern Hemisphere continents in 1977-94. J. Clim., 12, 2947-2955. [ Links ]
von Storch, H. and G. Hannoschöck, 1984. Comment on Empirical Orthogonal Function Analysis of wind vectors over the tropical Pacific region. Bull. Am. Met. Soc., 65, 162. [ Links ]
Wallace, J. M., 2000. North Atlantic Oscillation/Northern Hemisphere annular mode One phenomenon two paradigms. Q. J. Roy. Met. Soc., 126, 791-806. [ Links ]
Walker, G. T., 1924. Correlations in seasonal variations of weather. IX. Mtn. Ind. Meteor. Dept., 24, 275-332. [ Links ]
Walker, G. T. and E. W. Bliss, 1932. World Weather. V. Metn. Roy. Meteor. Soc. 4, 53-82. [ Links ]
Wunsch, C., 1999. The interpretation of short climate records with comments on the North Atlantic and Southern Oscillations. Bull. Am. Meteorol. Soc., 80, 245-255. [ Links ]

