


Servicios Personalizados
Revista
Articulo
 Inglés (pdf)
 Artículo en XML
 Referencias del artículo
 Enviar artículo por email
Indicadores
-
 Citado por SciELO
 -
 Accesos
Links relacionados
-
 Similares en
SciELO
Similares en
SciELO
Compartir

 Permalink
Atmósfera
versión impresa ISSN 0187-6236
Atmósfera vol.16 no.3 Ciudad de México jul. 2003
Characteristics of the urban heat island in the city of Salamanca, Spain
M. S. Alonso, J. L. Labajo and M. R. Fidalgo
Dpto. de Física General y de la Atmósfera. Facultad de Ciencias. Universidad de Salamanca, España. Plaza de la Merced s/n. 37008. Salamanca. España. Corresponding author: J. L. Labajo; e-mail: jll45@gugu.usal.es.
Received July 13, 2001; accepted April 30, 2003.
RESUMEN
En este trabajo se ha examinado la isla de calor urbana (ICU) de la ciudad de Salamanca, España. Comparando las temperaturas de una área urbana y una rural próxima se ha estudiado la evolución temporal de la intensidad de la ICU para el trienio 1996-1998. Los resultados muestran una ICU nocturna positiva, cuyo valor medio más alto se detecta en otoño (3.2 °C). Utilizando el método de selección de transectos, se estudia la distribución espacial de la ICU. Las temperaturas mínimas nocturnas se observan a las afueras de la ciudad, principalmente en zonas verdes cerca del río. Las medidas térmicas diurnas muestran una inversión de la ICU, obteniéndose las menores temperaturas en el área urbana, donde los edificios, que hacen sombra, impiden que llegue la radiación solar directa. En condiciones de estabilidad atmosférica la intensidad de la ICU se acentúa respecto a los casos de inestabilidad.
ABSTRACT
In this paper the urban heat island (UHI) of the city of Salamanca, Spain is examined. The temporal evolution of the intensity of the UHI for the three-year period between 1996 and 1998 was studied by comparing the temperatures in an urban area and those in a nearby rural area. The results pointed to the existence of a nocturnal UHI, whose highest mean value was recorded in autumn (3.2 °C). Using the transect selection method, the spatial distribution of the UHI was analyzed. The lowest nocturnal temperatures were observed in the outskirts of the city, mainly in green areas close to the river. The daytime mean temperatures revealed a negative UHI, the lowest temperatures were recorded in the urban area, where the buildings, which afford shade, prevent the arrival of direct solar radiation. Under conditions of atmospheric stability, the UHI is more intense than under conditions of instability.
Key words: Urban heat island; negative UHI; measuring transects; Salamanca, Spain.
1. Introduction
Climatic data provide information on the atmospheric characteristics of a given area and their effects on human activities. On attempting to conduct reliable climate studies, the first requirement is to obtain homogeneous data series. A climatic time series is said to be homogeneous if the nature of the changes occurring in it is only meteorological or climatic (Conrad and Pollack, 1962).
The inhomogeneities shown by time series may be of two types: sharp, caused especially by the relocation of measuring instruments or weather stations, and gradual, such as the progressive changes occurring around the weather station that generates the data. In this case, an outstanding feature is urban heating since, among other factors, the growth of any city leads to alterations in the measurement of a series of climatic variables, among them temperature.
Oke (1973) addressed the issue, obtaining sufficiently important results to provide the basis for later studies. Since then, much work has been carried out in many different cities, mainly large ones, with a view to obtaining models that would allow researchers to establish the intensity of the urban heat island (UHI), such as those carried out in Hong Kong (Stanhill and Kalma, 1995), Tokyo (Saitoh et al., 1996), Mexico (Jáuregui and Luyando, 1998). From the seventies onwards, urban warming has been a subject of great interest in European research, having been conducted in cities such as Paris (Dettwiller, 1970), London (Lee, 1992) and Frankfurt (Hänel et al., 1990), among others. Today, there is a considerable body of information about this topic in Spain, in cities such as Madrid (López et al., 1991, 1993) and Barcelona (Moreno, 1994), showing a clearly detectable degree of heating due to their size, population density, and industry.
In this paper the UHI of a medium-sized city (190,000 inhabitants), namely Salamanca, was examined. Salamanca is located in the west of Spain (40° 58'N, 5° 40'W, altitude 800 m) in an area with Continental-Mediterranean climate. First, the temporal evolution of the intensity of the UHI and its relationship with meteorological factors were determined using the comparative method involving temperature time series, obtained at urban and rural sites (Figuerola and Mazzeo, 1998; Montávez et al., 1998; Yozwiak, 1998). Second, the spatial variation in temperature within the area of influence of the city and the relationship between such variation and land use were established. In this case, the transect selection method was applied, along which temperature was measured in areas of different characteristics. This methodology has been used in several cities in the world (Bello, 1994; Moreno, 1994; Saitoh et al. 1996; Almendros, 1998, and Soler, 1998).
2. The data
The most interesting morphological feature of the city is its situation with respect to the Tormes river, an affluent of the Duero river. The presence of the river that crosses the city from east to west determines its thermal characteristics.
The city comprises an old quarter, delimited by three large avenues and the Tormes river (Fig. 1). The southern part of this area is composed of narrow streets and fairly low houses. This area of the city harbours the oldest "monumental" buildings. The left bank of the river is characterised by residential areas and many green areas. As well as the city centre, the right bank harbours residential areas with a strong accumulation of tall buildings and few green areas. This is also where most of the "black points" show the strongest pollution owing to the heavy traffic density.
The green areas are mainly located close to the river. The most important industries are found in specific areas at some distance from the limits of the city centre. Due to the relatively few industries present in the city, the main source of heat contamination derives from human activity, in particular central heating systems and traffic (Fidalgo, 1986).
The data series used in section 3 derive from two sources:
1. A rural weather station, operated by the National Institute of Meteorology of Spain (INM), located at the air-force base in Matacán, 16 km from Salamanca. Matacán is the rural weather station because it is located on agricultural terrain dedicated especially to irrigation crops.
2. An urban station from the Atmospheric Surveillance and Control Network of the Regional Community of Castilla and León, located in an area with a high density of buildings and traffic in the city centre.
The data series used in section 4 were measured along the three transects shown in Figure 1. The choice of the transects was made very carefully, and they include large avenues passing through areas of different morphological characteristics for the purpose of comparison with the thermal data. The transects numbered 1, 2, and 3 were 3.6 km long each, containing 10 measuring points, one every 400 m. We called the point at the beginning of the transect number 1; the second one was point number 2, and so on.
The thermometer used to measure the temperature at each point of the transects selected was digital, with a resolution of 0.1 °C. We travelled by car to measure the temperature along the transects. One hour was required to measure the three transects and hence it was necessary to establish some condition to determine if the measured temperatures were comparable. Transects 1 and 2 cut across transect 3 at one point each (Fig. 1), such that two temperatures were obtained at each of these cross-cutting points. When the difference between temperatures exceeded 0.5 °C the measurements were discarded.
3. Intensity of the UHI
One of the most frequently used methods to study urban heating consists of comparing the thermal data series of the urban area with those corresponding to a nearby rural area. To conduct a study of this type, it is necessary to choose measuring stations located in areas with suitable characteristics: On the one hand, the urban station must lie in an area that is representative of the typical characteristics of the city and, on the other, the rural measuring station must lie outside the area of urban influence. The stations described in the previous section were selected.
3.1. Intensity of the UHI and its temporal distribution
Table 1 shows the calculation of the intensity of the UHI, for 1996, at the hours 00:00 UT, 07:00 UT, 13:00 UT, and 18:00 UT, as well as the hours at which the maximum and minimum temperatures were reached (hh Tmin, hh Tmax).
In this case, maximum temperatures were reached during daytime, while the minimum temperatures were registered during nighttime. The intensity of the daytime UHI on average showed negative values. The mean values were positive during the nocturnal hours. The data series best representing the UHI phenomenon during nocturnal hours was the series of intensities calculated with the urban (Tu min) and rural (Tr min) minimum temperatures (Imin = Tu min - Tr min), since it showed the highest mean and extreme values. Likewise, the series that best represented the daytime negative UHI was that calculated using the maximum temperatures (Imax = Tu max - Tr max).
Table 2 shows the mean and extreme values of Imax and Imin using the data series for 1996, 1997, and 1998. The study was carried out both for the whole three-year period chosen and for seasonal periods, comparing winter (December, January and February), spring (March, April and May), summer (June, July and August), and autumn (September, October and November). The greatest mean daytime UHI occurred in spring (-0.9°C), whereas during the nocturnal hours the highest mean intensity was found in autumn (3.2°C). However, the lowest temperature difference between the urban and rural zone occurred in winter.
3.2. Intensity of UHI in different weather conditions
Among other causes, the behaviour of the temporal evolution of UHI intensity is controlled by the atmospheric situation. The meteorological variable that most affects the intensity of the UHI is wind speed (Oke and Hannell, 1970), although other factors, such as cloudiness and synoptic conditions, are also involved. Using the data from Matacán about the meteorological variables corresponding to 1996, 1997, and 1998, we defined five different types of weather: Type 1, mean daily wind speed (v) lower than or equal to 4 km/h and cloudiness (C) lower than or equal to 2/8 of cloudy sky; Type II, v < 4 km/h and C > 3/8; Type III, 4< v < 22 km/h and C < 2/8; Type IV, 4 < v< 22 km/h and C > 3/8, and Type V, v >22 km/h, for all cases of C. The types of weather were chosen as a function of wind speed. The 22 km/h wind speed limit was chosen because this is the critical wind speed in Salamanca (the speed at which the UHI phenomenon disappears), following the model proposed by Oke and Hannell (1970), and the 4 km/h wind speed was chosen because v<4km/h is wind in calm. Table 3 shows the mean intensities of the UHI for the daytime (Imax) and nighttime (Imin), together with the atmospheric pressure (P), according to the different types of weather. The number of cases was the same for Imax and Imin.
The greatest mean of negative UHI occurs with stable weather, since Type I weather shows low values both for cloudiness and wind speed. In this case the highest nocturnal mean intensities of the UHI are also observed. Pressure shows a value above "normal", which for the altitude of Salamanca (808 m) is 926.0 hPa. Imax is mainly affected by cloudiness, since the lowest negative UHI occur when C ≥ 3/8 of cloudy sky. Imin shows the lowest mean value when the daily mean wind speed exceeds 22 km/h. This is the most unfavourable type of weather, because of both high mean wind speeds and high cloudiness and the lower mean value of the atmospheric pressure.
4. Morphology of the UHI
From January to May 1999, different temperature measuring campaigns were carried out along the transects to collect data at different times of the day during nighttime (two hours after nightfall) and during the daytime (between 3:00 and 4:00 p.m.) under different meteorological conditions: stable weather (wind in calm and clear sky) and perturbed weather (windy conditions and overcast sky). For this study, a few measuring campaigns were selected as examples.
4.1. Nocturnal heat island
Once the data recorded along the transects had been analysed, it was possible to establish preliminary results concerning the configuration and intensity of the UHI in Salamanca. The first and the last points on the transects are outside the city and can be considered rural points. We defined the "relative intensity" of the UHI, (Ir), as the difference between the highest and lowest temperature values measured along each transect during the same measuring campaign. Calculation of the extreme relative intensities, during the nocturnal hours, for the three transects, distinguishing between stable (wind in calm and clear sky) and perturbed days (windy conditions and overcast sky), afforded the results offered in Table 4.
The days with an unstable atmospheric situation showed extreme values of UHI intensity relative to each transect, and lower than that recorded for days with stable meteorological conditions. The transect with the greatest relative UHI intensity was transect 2. The temperature profiles of this transect for stable and unstable days are shown in Figure 2 (Fig. 2a and Fig. 2b, respectively).
The ranges found for the relative intensity of the UHI, for transect 2, were 6.7 °C for 02-04-99; 5.3 °C for 02-23-99 and 2.6 °C for 05-13-99. The highest temperature was recorded at point 4 on transect 2 (a pollution "black point") and point 5 (transect 2), corresponding to a central area with typically urban features, while the minimum intensity of the heat island was found at point 10 (transect 2): a green area close to the river.
The range obtained for 07-04-99, for transect 2, was 2.9 °C, which can be considered a moderate island for transects 1 and 3, although it is low for transect 2 in comparison with the results obtained with stable weather. The weather on April 20 1999 was windy, cloudy and rainy and hence completely unstable; the intensity of the heat island was thus minimum.
4.2. Daytime heat island
The days chosen to study the heat island in the daytime hours (between 3:00 and 4:00 p.m.) were meteorologically stable (wind in calm and clear sky). We were thus able to observe the phenomenon with greater clarity since the daytime UHI showed an intensity lower than that of the nocturnal heat island and was masked in perturbed weather.
On 02-06-99, the temperature along transect 1 was measured, obtaining a temperature range of 1.4 °C. Figure 3 shows the daytime temperatures measured on 02-06-99 compared with the nocturnal temperatures for stable weather on 03-17-99. The latter was chosen for the comparison because it had a temperature range similar to that measured on 02-06-99.
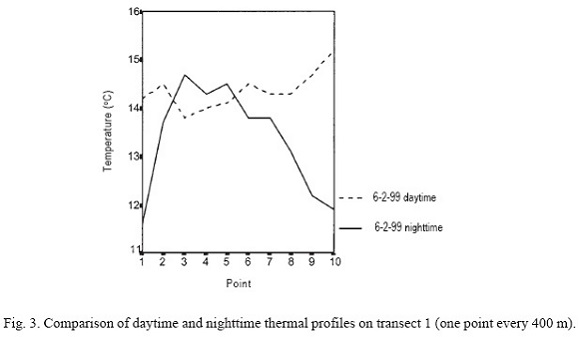
Figure 3 clearly reveals the negative UHI, the daytime temperature being maximum along the rural-urban stretch and minimum in the city centre. The clearest difference is seen in the extreme points because during the day these areas are open spaces, exposed to the sun. The lowest temperatures were recorded in the urban area, where the buildings, which afford shade, reduce the incidence of direct solar radiation.
4.3. Relationship with land use
In addition to studying the morphology of the heat island, we were also interested in exploring the effect of the land use on temperature, such use being considered as deriving from the materials forming the surface of the ground (buildings, green areas, water and asphalt) (Hänel et al., 1990; Martin and Miragaya, 1998). The aim was to determine the relationship between the variations in the intensity of the nocturnal heat island and the percentage of materials forming the surroundings of the point where temperature was being measured.
To conduct this part of the study, squares whose centre points were the points of temperature measurement were drawn; their dimensions were based on the size of the city (Bello, 1994). In this case, squares with sides of 400 m on the transects defined in the previous section were considered (Fig. 1). Percentages of asphalt, buildings, water and green areas were estimated for each square.
The results shown in Tables 5 and 6 were obtained by choosing the points of each transect at which the extreme temperatures were recorded, and comparing the materials forming the square whose centre was such a point. The number of the point corresponds to the number on each transect (i.e., point number 1 on transect 1 is the first point on this transect).

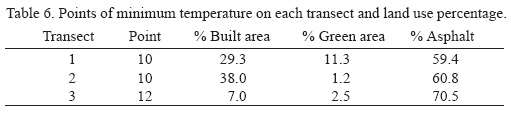
It may be seen that the points at which the maximum temperatures were recorded show a higher percentage of built-up area than those where the minimum temperatures were recorded: the opposite of what was found with the percentage of green area.
As an example, Figure 4 shows the distribution of the thermal field and the location of the core of the nocturnal heat island in Salamanca for 2-23-99, the day when simultaneous measurements were taken along the three transects. The nocturnal Ir was 5.3 °C on transect 2; i.e., an intense island. The minimum temperatures were located in the area close to the river and the core of the UHI was in a central area, characterised by a long avenue, lined by tall buildings, and high traffic density. It was also possible to observe two sub-cores showing temperatures higher than those corresponding to their area due to anthropogenic heat emission from vehicles. These points are the bridge over the river on transect 1 to the south, which is an area of high traffic density, and an area close to a large commercial area to the north.

5. Conclusions
The temporal evolution of the intensity of the UHI in Salamanca reveals two clearly differentiated situations. On the one hand, a daytime urban cool island is observed with negative mean values, whose highest mean value appears in spring. On the other, during the nocturnal hours the intensity of the UHI has positive mean values, which may be classified as follows: a weak UHI for Salamanca when its intensity is below 2.0 °C; moderate if its intensity is between 2.0 °C and 4.0 °C, and intense if it surpasses 4.0 °C. The greatest mean nocturnal intensities of the UHI are recorded in autumn and winter.
The intensity of the UHI depends on the prevailing atmospheric situation. The greatest nocturnal intensity of the UHI in Salamanca is seen in stable weather, with a mean daily wind speed of below 4 km/h and cloudiness equal to or lower than 2/8 of cloudy sky. The greatest negative UHI values are seen with low cloudiness. When the wind exceeds a speed of 22 km/h, the nocturnal UHI tends to disappear. This speed is known as critical wind speed.
From study of the location of the heat island core by temperature measurements along the three transects chosen on days with different meteorological characteristics, the following may be deduced:
The intensity of the daytime heat island displays negative values, such that the highest temperature values are found at the points with the lowest density of buildings and the lowest daytime temperature is seen in areas where the density and height of the buildings are greater because the buildings, which afford shade, prevent the arrival of direct solar radiation. On observing the relationship between the intensity of the UHI and land use, the same conclusion was drawn.
With stable weather, the nocturnal temperature reaches its highest values in the centre of the city at points at which the morphological characteristics indicate a high density of buildings and a high traffic density. The temperature profiles obtained with unstable weather have the same shape as those obtained with stable weather, although with lower values for the intensity of the heat island.
Observing the surface thermal field of Salamanca on 02-23-99, it is seen that the core of the UHI is located in the city centre, very close to one of the points considered to be a "black point" because of its high level of contamination, mainly due to vehicular emissions. There are two other points with temperatures higher than those corresponding to their areas: the bridge over the river on transect 1, and point 1 of transect 2, both of them areas with high traffic density. In figure 4, it is also possible to see how the thermal gradient along transects 1 and 2 is greater than the one along transect 3, probably because the surroundings of the points forming transect 3 all have similar morphological features.
References
Almendros, M. A., 1998. La isla de calor en Madrid: notas sobre barrios centrales. In Clima y ambiente urbano en ciudades ibéricas e iberoamericanas. Parteluz, Madrid, 241-256. [ Links ]
Bello, V., 1994. La isla de calor y los usos del suelo en Guadalajara. Universidad de Alcalá. Serie geográfica 4, 83-97. [ Links ]
Conrad, V. and C. Pollack, 1962. Methods in climatology. Harvard University Press: Cambridge. [ Links ]
Dettwiller, J., 1970. Évolution séculaire du climat de Paris. (Influence de l'urbanisme). Mem. Meteorol. Natl. Paris, No. 52, 83 pp. [ Links ]
Fidalgo, M. R., 1986. Relación de ciertos contaminantes de la atmósfera con la meteorología en Salamanca. Serie Resúmenes de Tesis Doctorales. Universidad de Salamanca. [ Links ]
Figuerola P. and N. Mazzeo, 1998. Urban-Rural temperature differences in Buenos Aires. Int. J. Climatol. 18, 1709-1723. [ Links ]
Hänel, G., D. Weidert and R. Busen, 1990. Absorption of solar radiation in an urban atmosphere. Atmos. Environ. 24B, 283-292. [ Links ]
Jaúregui, E. and E. Luyando, 1998. Long-term association between pan evaporation and the urban heat island in Mexico City. Atmósfera 11, 45-60. [ Links ]
Lee, D., 1992. Urban Warming? An analysis of recent trends in London's heat island. Weather 47, 50-56. [ Links ]
López A., J. López, F. Fernández and F. Arroyo, 1991. El Clima urbano de Madrid: la isla de calor. Consejo Superior de Investigaciones Científicas (CSIC), Madrid, 199 pp. [ Links ]
López, A., F. Fernández, F. Arroyo, J. Martín and J.M. Cuadrat, 1993. El clima de las ciudades españolas. Cátedra. Madrid, 268pp. [ Links ]
Martín, A. and A. Miragaya, 1998. Geometría urbana, temperatura e isla de calor en Santiago de Compostela. In Clima y ambiente urbano en ciudades ibéricas e iberoamericanas. Parteluz, 207-217. [ Links ]
Montávez, J. P., A. Rodríguez, E. Sánchez and J. I. Jiménez, 1998. Un estudio de la intensidad y forma de la isla de calor de Granada. In Clima y ambiente urbano en ciudades ibéricas e iberoamericanas. Parteluz, 315-325. [ Links ]
Moreno, M. C., 1994. Intensity and form of the urban heat island in Barcelona. Int. J. Climatol. 14, 705 -710. [ Links ]
Oke, T. R. and F. G. Hannell, 1970. Urban climates. WMO, Tech. Note 108, 113-126. [ Links ]
Oke, T. R., 1973. City size and the urban heat island. Atmos. Environ. 7, 769-779. [ Links ]
Saitoh, T. S, T. Shimada and H. Hoshi, 1996. Modelling and simulation of the Tokyo urban heat island. Atmos. Environ. 30, 3431-3442. [ Links ]
Soler, X., 1998. Avance sobre la isla de calor en Girona. In Clima y ambiente urbano en ciudades ibéricas e iberoamericanas. Parteluz, 281-291. [ Links ]
Stanhill, G. and J. D. Kalma, 1995. Solar dimming and urban heating at Hong- Kong. Int. J. Climatol. 15, 933-941. [ Links ]
Yozwiak, S., 1998. Isla de calor en Arizona. http:/sepp.org/reality/arizrepub.html. [ Links ]

