


Servicios Personalizados
Revista
Articulo
 Inglés (pdf)
 Artículo en XML
 Referencias del artículo
 Enviar artículo por email
Indicadores
-
 Citado por SciELO
 -
 Accesos
Links relacionados
-
 Similares en
SciELO
Similares en
SciELO
Compartir

 Permalink
Atmósfera
versión impresa ISSN 0187-6236
Atmósfera vol.16 no.2 Ciudad de México abr. 2003
Non-linear trends and low frequency oscillations in annual precipitation over Argentina and Chile, 1931-1999
J. L. Minetti,a W. M. Vargas,b A. G. Poblete,c L. R. Acuñad and G. Casagrandee
a Laboratorio Climatológico Sudamericano (Fundación Caldenius), Pa. Roque Correa 1237, 4000-San Miguel de Tucumán, Argentina, E-mail: minetti@millic.com.ar.
b Departamento de Ciencias de la Atmósfera y los Océanos, Universidad de Buenos Aires.
c Instituto de Geografía Aplicada-Universidad Nacional de San Juan.
d Instituto Nacional de Tecnología Agropecuaria.
e Consejo Nacional de Investigaciones Científicas y Técnicas.
Received April 30, 2002; accepted January 31, 2003
RESUMEN
En las décadas de 1950 y 1960 una gran región de Argentina ha experimentado cambios bruscos positivos en los promedios anuales de precipitación computados en 30 años o más. Condiciones opuestas se han registrado del otro lado de la Cordillera en Chile, donde se han observado tendencias decrecientes desde fines del siglo XIX al presente. Tales cambios han tenido impactos considerables en la actividad humana, tales como expansiones agrícolas sobre ecosistemas semiáridos inestables, inconvenientes en la generación de energía hidroeléctrica y otros en Chile central y el centro-este de Argentina. Un apropiado diagnóstico de situación es importante, tanto para el Estado como para las empresas privadas. Estos diagnósticos son también importantes desde el punto de vista metodológico, ya que se precisa establecer si tales cambios son permanentes y representan un cambio climático o son fluctuaciones interdecadales donde se podría esperar un retorno a condiciones anteriores. Se sugiere que dos eventos intensos de La Niña ocurridos en 1988-1989 y 1995-1996 han producido una declinación en las tendencias de la precipitación sobre una gran porción de la zona semiárida argentina, e intensificado las sequías sobre Chile central.
Para llevar a cabo esta investigación se ha intentado una regionalización local de las precipitaciones durante el período agrícola (julio-junio) 1931-1932/1998-1999 y analizado posteriormente las tendencias no-lineales de las mismas por regiones homogéneas. Se encontraron siete modelos básicos de variabilidad espacio-temporal y se analizó su comportamiento de larga escala encontrándose diferentes formas de tendencias y oscilaciones de media frecuencia 18-26 años que son importantes en la observación de saltos o discontinuidades en los promedios de 30 años. En dos regiones se han observado tendencias monótonas crecientes sin evidencias de cambios recientes (en las últimas décadas), y en otras regiones por ejemplo, la ocurrencia de dos eventos severos de La Niña han producido cambios en las formas de las mismas que incluye, en algunos casos, un cambio de pendiente positiva a negativa en la década de 1980. También se muestra en este trabajo que la oscilación de 18-26 años encontrada primeramente en la región de Cuyo (oeste de la Argentina) y que está en fase con una gran región de Sudáfrica tiene su extensión en cuatro sub-regiones continentales del país.
ABSTRACT
Since the 1950's-1960's a large portion of Argentina has experienced a long period of high precipitation with important changes a 30-year period annual averages. Opposite conditions have taken place throughout the twentieth century in a large portion of Chile, with declining tendencies in annual precipitations. If such conditions prevail, the socio-economic implications of these phenomena could eventually gain importance due to the expansion of grain crops in the semi-arid borders of Argentina and a decline in the availability of reservoir water used for irrigation or energy generation in the central region of Chile and western Argentina. An accurate diagnosis of these phenomena is very important for applied purposes in medium term planning that should be undertaken by private and state-owned companies. These diagnoses are also important from a methodological point of view, in order to find out whether these changes in long-term averages are constant and represent a climatic change or if they are low frequency interdecadal fluctuations that would mean a return to opposite conditions. We suggest that the two intense La Niña events that took place during 19881989 and 1995-1996 caused a decline in the precipitation trends over a large region of semi-arid Argentina and intensified droughts in Central Chile.
A regionalized local precipitation analysis of the 1931-1932/1998-1999 agricultural periods over large areas was performed. Afterwards, long-term variations for homogeneous areas were analysed through their nonlinear trends and low frequency fluctuations in a regional scale. Seven inter-annual patterns with three different types of tendencies have been found. One of them shows an increasing linear trend throughout the analysed period; another one shows an increasing trend, but also a decrease after the 1980's, and a third one shows a continuous decrease. Regions with continuous trends include medium latitude semi-arid regions in Argentina and Chile, where an intense human impact is observed. An 18-26-year-quasi-period that affects four of the selected regions and has a clearer signal in the Cuyo region has been found. This long period signal is in phase with the oscillations of other atmospheric variables in South America and with precipitation in South Africa.
Key words: Annual precipitation trends, Argentina-Chile.
1. Introduction
Changes in annual precipitation during long periods have been studied by Barnett (1985), Ellsaesser et al., (1986), Diaz et al. (1989), among others. More recently, Hoffmann (1988), Barros and Moyra (1996), and Minetti and Vargas (1998), have studied trends and jumps in annual precipitation averages in South America, south of 15° S. Such changes could have been significant in their impact on the region allowing for the expansion of agriculture over the last few decades, increasing the stock of grain and influencing the regulation of prices. Proof of the existence of such phenomena in various regions has been exemplified in northwestern Argentina as discussed by Minetti and Sierra (1984), and in the Dry Pampa region by Minetti and Vargas (1998), among others. The importance of this expansion should not be overlooked in the analysis of future precipitation trends. Considering that this region is one of the most important in Argentina in terms of commodities production and cattle breeding, and that it is so recognized by market planners in developed countries, a thorough study of the precipitation behaviour over the area is imperative in order to avoid unrealistic expectations in future agricultural planning.
Long-term changes in annual precipitation have particularly benefited agriculture in semi-arid and sub-humid regions (Sierra et al. 1994), though they have also been affected by two intense droughts during La Niña events in the 1988-1989 and 1995-1996 periods. Since some scientists, decision-makers and planners assume that this humid period would last for, at least, a few decades, many questions of important strategic value should be addressed for the sake of private companies and the nation as a whole. The purpose of private companies is to protect their investments and improve their access to world markets, whilst nations are interested in sustainable development, the protection of natural ecosystems and resources, preventing desertification and salinization, and the improvement of their access to international markets. Other phenomena associated with timespace increase in the precipitations occur in lowland areas of Argentina with low drainage density and with water supply originating in rivers that have no way to reach the sea and have become permanently flooded. An increase in the area of inner lagoons is also associated with increased precipitation in Buenos Aires and the provinces of Cordoba and Santa Fe (Minetti and Vargas, 1998).
Usually, precipitation has been studied as a phenomenon affected by linear trends or by discrete jumps and discontinuities in long-term averages. Questions also arise from a scientific and methodological point of view from different approaches. For example, the existence of trends might involve slow long-term changes in the average resulting from global warming through the increase of CO2 concentrations in the atmosphere (Barros et al. 1996). Discrete jumps or discontinuities in pluviometric series could be the result of a measurement inaccuracy or of real climatic variability. The first issue has been extensively analysed by several authors. Minetti (1980) has shown that pluviometric changes during the 1930's-1940's did not generate significant low frequency discontinuities nor jumps. Hoffmann it et al. (1997), using series for Argentina, reported a significant trend for an increase in the variable that has been present during the second half of the twentieth century. This conclusion was obtained using controlled data (Hofmann, 1970). Minetti and Vargas (1998), using relative homogeneity techniques (WMO, 1966), have reported that the observed jumps are not caused by systematic errors because they have been occurring along with changes in the ecosystems and human activities.
On the other hand, the existence of discrete jumps or discontinuities and low frequency oscillations may be associated with a quasi-unstable climatic system (or quasi-intransitive system, Henderson-Sellers and McGuffie, 1987), where abrupt changes (jumps) occur in meteorological variables. This has been reported for precipitation over continental Argentina and confirmed in circulation variables (Kalnicky, 1974; Yamamoto et al. 1987; Vargas et al. 1995). These jumps in long period averages may be a result of the natural variability in atmospheric behaviour. Evidence of this can be found in dendrochronological growth ring analyses on trees of the Oranense forest of North-western Argentina (Villalba and Boninsegna, 1985). Low frequency oscillations have also been observed in Western Argentina (Cuyo Region) in phase with annual precipitation in South Africa (Vines, 1982; Compagnucci et al., 1982; Acosta et al., 1999).
Studying temporal behaviour of drought indexes in Argentina, Minetti (1999) found the 19811985 period to be the most humid in the tropical-subtropical region of Argentina. This author also noticed that intense droughts associated with La Niña during the 1988-1989 and 1995-1996 periods have changed the increasing tendency of precipitations over a large portion of Argentina, to a decreasing trend in recent decades. Villalba and Boninsegna (1985) showed that long periods of excess or deficit in precipitations might have recurrence intervals every 54-65 years, a fact that proves behaviour independent from long-term CO2 concentration variability. Besides, current conditions would indicate that precipitation shortages might tend to occur in northwestern Argentina in the same periods, and that a return to drier conditions might be foreseen in the form of a climatic jump in the opposite direction (negative). The problem is closely related to the methodology applied since the detection of a jump in the averages requires two periods from consecutive series, the first one preceding the jump and the second one following it (Yamamoto et al., 1985). Therefore, one of the main objectives of this paper is to nalyse the long-period non-linear changes in the precipitations for different regions in the country. The need for this regionalization has been demonstrated by Pittock (1980) for Argentina and Chile in an attempt to find out the genesis of the variability.
2. Methods
The studied period of annual precipitations has been defined as the period between agricultural years 1931-1932 and 1998-1999, computed between July and June of the following year. The selected period covers an interval before the climatic jump observed during the 1950's and 1960's to the east of the Andes, including an interval after this "climatic jump" where a higher average was observed.
This analysis was performed using information collected from the South American Climatological Laboratory (SACL) of the Caldenius Foundation. Most of the original data was provided by the National Meteorological Service of Argentina (SMN) and Chile, and other data were provided by the Hydrological Resources Agency of Santiago del Estero province and also by private companies that carried out meso-scale observations.
This information was first analysed using relative homogeneity techniques (WMO, 1966) for the detection of random and systematic errors in series.
In the climatic monitoring carried out by the SACL, third degree polynomials have been used to adjust the annual precipitation tendencies by location as a "low pass filter". These previous results have been taken as observed evidence. For space-time regionalization of the variability, principal component analysis (EOF) had been used in "s mode" (Cooley and Lohnes, 1971; Jackson and Edward, 1991), with a minimum explained variance of 2.5% of the variance for each factor, and a total explained variance of at least 60%. A VARIMAX rotation was applied to the selected set of principal components. To the effects of comparing the previous results, the method of modified Lund's (1969) by Minetti and Sierra (1989) was used. In regions identified as having different temporal variability regimes in precipitations, annual averages of the variable were estimated. With these new regional series, the non-linear tendencies were analysed with third degree polynomials, as well as their spectrums and accumulated spectrums of the series with and without tendencies. The spectral estimations were calculated using the Fourier method (Essenwanger, 1976) in an attempt to analyse their non-random components. For low frequency interdecadal oscillation analysis, moving averages of eleven years were used (WMO, 1966).
3. Results and discussion
Figure 1 shows the region under analysis with the location of meteorological stations with annual precipitation series. Figure 2 shows two regions with current non-linear decreasing trends in precipitation (a and b) and two regions with quasi-linear increasing trends (c and d). In region (a), located in central Chile, higher levels of the Cuyo Cordillera and Comahue in Argentina, and decreasing trends have been observed during the whole period, with highest values common near the start of the series (1931-1932). In this region continuous decreases in precipitation are traced as far back as the beginning of the nineteenth century (Minetti and Vargas, 1998). Region (b) shows series that have had constant increasing trends starting in the 1930's-1940's and through the 1970's-1980's, showing the wettest period of the twentieth century in the first years of the 1980's (Minetti, 1999). Afterwards, intense droughts during the 1988-1989 and 1995-1996 periods have resulted in decreasing trends in the precipitations. Regions (c) and (d), both with continuous increasing trends in the individual series analysis (Figure 2), appear separated with a recent decreasing trend in the NW-SE diagonal.
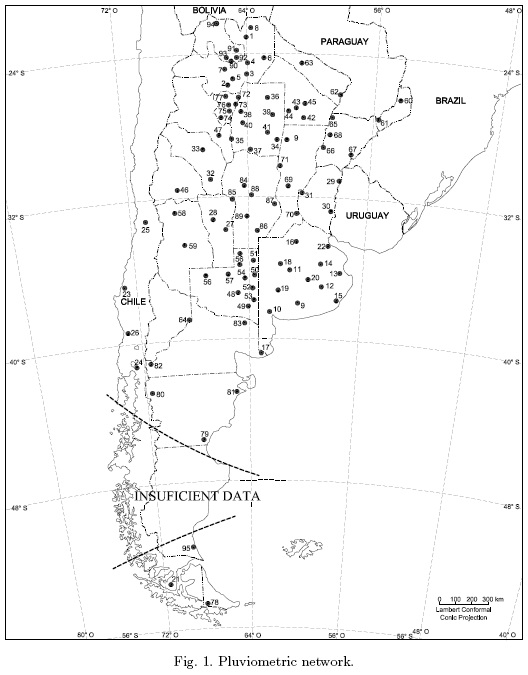

Figure 3(a) shows eight homogeneous regions in their space-time variability, of which only seven are important. Table 1 shows statistical information regarding the nature of each eigenvectors-eigenvalues in each model. The Figure 3(b) shows similar results using the method of Lund (1969).
Figures 4 and 5 show VARIMAX rotations between factors 1-2 and 3-4. The locations shown in Figure 1 are represented here with numbers and the sites surrounding the main locations with geometrical figures. The main locations are represented with a larger dots. The first three diagonal inverse associations between these groups split the variability into regions in a zonal-meridional way, so that types 1-2 show the inverse variability between northwestern Argentina (NWA) and northeastern Argentina (NEA), both groups located in the Argentine tropical-subtropical zone. Types 3-4 show the same for the central regions of Argentina-Chile and types 5-6 for an intermediate region between them. The opposite types 7-8 do not have an East-West arrangement. This North-South/West-East arrangement could represent different interaction levels between the ocean surface temperature variability (SST) of the Atlantic and Pacific oceans, and the variability regimes of the precipitations, one oriental marine (Atlantic) and the other more continental (Pacific) in different latitudes. Type 7 is the last that groups an important number of locations with data that will be analysed as regional temporal series. In spite of the space-time discrimination represented in Figure 3, some regions show similarities that could mean related processes in the precipitation regime. This can be seen in the correlations between average precipitations of regions represented in Figure 2. Regions 1, 3, 6, and 7 are correlated (Table 2), although this could be a direct result of the contribution of each of their trends.

Figure 6 shows average regional precipitations with their trends. Table 1 shows that EOF1 (region 1) explains the greatest variance of the total field. This region, located in NWA, has an outstanding increasing trend with two abrupt changes in averages, one in the 1950's (Minetti and Vargas, 1998) and another around 1970. Droughts during the 1988-1989 and 1995-1996 periods, simultaneous with two intense La Nina events, have changed the increasing trend slope typical of this region in the mid 1980's, when it reached its maximum value (Minetti, 1999). The most important preceeding droughts took place during the 1970-1975 period, twenty years before the droughts under analysis.
Region 2, located in NEA, shows an increasing trend. This trend is different to that of model 1 since it does not show a stabilization nor a recent decline as the latter. In turn, it is consistent with the observations in river flows of the upper basin of La Plata River (Garcia and Vargas, 1998; Mechoso and Perez-Irribarren, 1992). There is also a coincidence in this region between the maximum in the trend and the highest precipitation of the twentieth century, which occurred during the El Niño event in the 1997-1998 period. Region 3, covering the Dry Pampa and the southern portion of the Humid Pampa in Argentina, also shows an increasing trend similar to that in model 2. However, the smaller correlation between them indicates the presence of different structures in high frequency precipitation series.
On the other hand, Table 3 shows the changes resulting from trends compared to general averages. The trend signal in region 3 (33%) is stronger than the one for region 2 (24%), and it is also the largest trend with the highest impact with respect to the average, being this a semi-arid region.
The other region with an important decreasing trend (second in order) is the one recorded in region 4 (-32%). Model 4, as opposed to model 3, confirms the decreasing trend that has taken place over all of the twentieth century and the last decades of the nineteenth century (Minetti and Vargas, 1998). Figure 6 also shows that the decreasing trend in model 4 has increased its slope in recent decades. The impact of droughts (La Nina events) in these last few decades has been very important in central Chile, higher altitudes of the Argentine-Chilean Cordillera and the Comahue region of Argentina (Minetti et al., 1982; Carletto et al., 1985; Minetti and Lamelas, 1995; Minetti et al., 1989). In this region, the latitudinal movement of the subtropical anticyclone (Pittock, 1980; Minetti et al. 1982) as well as the ENSO events (Minetti and Sierra, 1989; Compagnucci and Vargas, 1998) are partly responsible for the inter-annual variability of precipitation and streamflow of Andean rivers.
Time series for regions 5 and 7 have similar adjustments in their trends to those of region 1. Regions 1, 5, and 7 cover the region with the recent decreasing trend observed in Figure 2. For a better representation of the whole area, the annual precipitation averages were obtained for all of them, with an estimation of trends as can be seen in the lower right corner of Figure 7. An important conclusion from this figure is the outstanding impact of the change in trends from increasing to decreasing due to the dry events in 1988-1989 and 1995-1996.
Precipitations in region 6 analysed by Compagnucci et al., (1982), Minetti and Carletto (1990) and more recently by Acosta et al., (1999), show an increasing trend with a decline in intensity in the last decades. Acosta et al., (1999) do not consider the trend as a measure of centralization of the series and hence they infer that forecasts done through statistical models would not be reliable. On the other hand, these authors have stated that this behaviour is changing as compared to the behaviour observed in South Africa.
The existence of interdecadal fluctuations with 18-26 year oscillations in precipitation series requires, a different methodological treatment in the series. Figure 7 represents the non-linear trend and eleven year-moving-averages of average precipitations in regions 1, 5, and 7. It can be inferred from this figure that medium frequency fluctuations have an effect on the shape of the trends. Accumulated Fourier spectrums for regional precipitation series in regions 1, 3, 4, and 6, before and after trends were filtered (not shown here), show the importance of non-stochastic components (tendencies, jumps and low frequency oscillation). After being filtered through third degree polynomials, region 6 series shows a low frequency remnant for analysis. For that purpose, an attempt was made to correlate eleven-year-moving average regional series filtered through the trend. In this case, regional series 6 associates in low frequency with regions 1, 3, and 5, as shown in Figure 8 and Table 2. This oscillation is in phase with precipitations in South Africa (Tyson and in regions 2, 4, and 7.

Dyer, 1975, 1978; Tyson, 1981, 1986, 1991; Vines, 1982, Compagnucci et al., 1982, Acosta et al. 1999). They are also in phase with other regional circulation variables in South America according to Minetti et al. (2001). This oscillation had its minimum peaks around 1911, 1947, 1969, and 1993, and its maximums around 1927, 1960, and 1982, being currently in an increasing phase (Vargas et al. 2001). Excessive precipitations over the last few years even under the influence of La Niña (1998-1999 and 1999-2000), with the formation of new flooded areas in north-western Argentina and the behaviour of other regional variables confirm this hypothesis. On the other hand, Acosta et al. (1999) and Krugger (1999) in Argentina and South Africa demonstrated the independence of these wet-dry episodes with the ENSO oscillation.
Figure 9 shows eleven-year-moving averages for regions 2, 4, and 7, which do not show the 18-26 year quasi-periodic behaviour that the others do. Minetti et al. (2001) concluded that this subtropical oscillation is important at medium latitudes after the occurrence of the 1950's climatic jump as a possible result of global climatic change due to an increase in CO2 atmospheric concentrations which could have shifted the subtropical anticyclones axis to higher latitudes and climatic tropicalization (Smagorinsky, 1963; Minetti and Vargas, 1990; Barros and Scasso, 1994). However, these jumps may be a result of the natural variability in atmospheric behaviour (Villalba and Boninsegna, 1985).
From the analysis it can be inferred that regions with different climatic regimes have different intensities and directions in their trends. Proof of the non-linear behaviour of the trends can be seen in regions 1, 4, 5, 6, and 7. In some non-linear behaviour, the presence of 18-26 years interdecadal oscillation is important to establish jumps and changes in trend slopes.
4. Considerations on real and potential impact of annual precipitation over Argentina and Chile
Low frequency variabilities observed in the analysed region have both real and potential importance. Due to the expansion of grain crops in semi-arid borders in Argentina and to the decrease in dammed waters used for irrigation or hydroelectric energy generation over Western Argentina and the Central region of Chile.
Examples of impacts that have been documented are:
4.1 Region 1
During the second "climatic jump" (1970's) semi-arid areas in north-western Argentina turned into agricultural dry sub-humid prairies with an important expansion in soybean, cotton and corn cultivated areas (Minetti and Sierra, 1984). The 1988-1989 and 1995-1996 droughts had a negative impact in these regions, affecting agricultural practices and causing the highest losses in the last decades (Minetti and Lamelas, 1995).
Important agricultural developments were being carried out under an active expansion and under the influence of a climate with 600 mm of annual average precipitations, which changed to 750 mm after the climatic jump of the 1950's. The mentioned droughts have made farmers change their old agricultural methods for practices that include new technologies in soil and water conservation.
4.2 Region 2
During the last decade the region has suffered the worst impact from irrational agriculture conducted with a lack of knowledge regarding nature. La Niña 1995-1996, with its costly droughts, was followed by the worst floods ever during El Niño in 1997-98. This last natural disaster was the result of an inadequate management of surface waters in the Sub-Meridional Lowlands, a depressed region with lack of superficial drainage. Floods in the Paraná and Uruguay River basins have also been very important during this period.
4.3 Region 3
A large portion of this region withstood intense droughts during the 1930's and 1940's that resulted in the abandonment of agricultural lands threatened by desertification in the form of moving sand dunes (Kugler, 1983). During the last few decades this region has had an enormous agricultural expansion (Sierra et al., 1994), but the threat of floods has also become more imminent as well as the appearance of large permanent continental water bodies (lakes) and an increase in the area of previously existing lakes.
4.4 Region 4
Severe droughts during the last decades have caused severe losses in hydroelectric energy generation and in agriculture, due to the lack of irrigation water in arid and semi-arid regions. These dry events have also been associated to great forest fires in north-western Patagonia.
4.5 Regions 5 and 7
In these regions of intensive agriculture the impact caused by the decline in precipitation during the dry peaks of 1988-1989 and 1995-1996 went unnoticed due to the application of important technology programs, direct sowing being one of them. (Bolsa de Cereales de Buenos Aires, 1990 and 1997).
4.6 Region 6
Excessive precipitations in the humid phase of the 18-26 year-quasi-period result in a negative impact over irrigated fruit crops. In these cases, the precipitation and clouds increase over the desert in the summer, decreases global radiation, which lowers fructose production in fruit, besides, an increase in summer precipitations is the main cause of fungal diseases and also of severe damage in the irrigation infrastructure.
5. Conclusions
This study shows that during the 1931-1932 and 1998-1999 periods two regions of Argentina had increasing precipitation quasi-linear trends as a possible result of global climate changes. Regions 2 and 3 show increasing trends with no signs of stabilization in the average value. As a result of the same physical effect, west of the Andes, in Chile, decreasing trends are observed. The potential impact of these long-term changes in natural ecosystems and in anthropogenic activities is very important for the countries involved.
A non-linear trend in the precipitation can be seen over an area running northwest to southeast and located between northwest of Argentina and La Plata River as the result of the impact of the 1988-1989 and 1995-1996 droughts on the variables. An 18-26-year subtropical oscillation has entered an increasing phase in recent years (after 1993) and could probably mean the end of the decreasing trend. Confirmation of the existence of sudden changes in the climatic averages (jumps) by dendrochronological analysis, with a 54-65-years recurrence, ratify the necessity of a non-linear tendency treatment. For the same reasons, the presence of oscillation periods longer than the 1826 years show the need to intensify studies on interactions between traditional climatology and paleoclimatology through proxy data.
Likewise, the minimum and maximum peaks in the 18-26-year subtropical oscillation, being independent from the ENSO oscillation, would modulate the intensity of extreme events of the fast inter-annual variability.
The diagonal where non-linear behaviours exist is probably a transition region between the two mentioned factors, capable of originating a distinct trend.
Regions 3 and 4 over central Argentina and Chile are the ones that show a greater impact due to long-term changes in precipitation averages (with changes above 30%). The ecosystems involved are very sensitive because they represent semi-arid climates and receive an intense anthropogenic pressure, which makes them very vulnerable.
Regions 1, 3, and 5 make important contributions to the 18-26-year period variance explained by the subtropical oscillation. These contributions should be included in region 6 (Central Argentina and Cuyo), where this phenomenon has been recorded, and in phase with precipitations in South Africa. Other regionalizations can be seen in the characterization of space-time variability of precipitations. However, these come from regions with insufficient data, like southern Patagonia and north-central Argentina. This can also be seen in valleys and mountain ranges in north-western Argentina, where meso-scale genetic processes are very active and disguise large-scale signals.
Acknowledgements
To the Carl C. Zon Caldenius Foundation and Secretaria de Ciencia y Tecnica for the resources and data for this research. Also to the Meteorological Services of Argentina and Chile, National Institute for Agricultural Technology (INTA), Hydrological Resources Agency of Santiago del Estero and La Pampa provinces, as well as other institutions and private companies that provided valuable pluviometric and other information.
References
Agosta, E. A., R. H. Compagnucci and W. M. Vargas, 1999. Cambios en el régimen interanual de la precipitación estival en la región Centro-Oeste de Argentina. Meteorológica 24, N 1-2, 63-84.Bs.As. [ Links ]
Barnett, T. P., 1985. Long-term changes in precipitation patterns, in detecting the climate effects of increasing carbon dioxide. Rep. OE/ER-0235, 149-162.U.S. Dep. of Energy Carbon Dioxide Res. Div. Natl. Tech. Inf. Serv. Springfield, VA. [ Links ]
Barros, V. and L. M. Scasso, 1994. Surface pressure and temperature anomalies in Argentina in connection with the Southern Oscillation. Atmosfera 7, 159-171. México. [ Links ]
Barros, V., M. Castañeda and M. Doyle, 1996. Recent precipitation trends in Southern South America to the East of the Andes, an indication of a mode of climatic variability Green House Emission Under Developing Country Point of View. Proceeding of the Latin America Workshop on Green House Emission of Energy Sector and their Impacts. Rio de Janeiro, February 1996. [ Links ]
Barros, V. and D. Moyra, 1996. Precipitation trends in Southern America to the East of the Andes. Centre of Ocean Land Atmospheric Studies. COLA, MD. Report N 26. Proceeding of the Workshops of Dynamics on Statistical of Secular Climate Variations, 76-80. [ Links ]
Bolsa de Cereales de Buenos Aires, 1990 y 1997. Números Estadísticos. Bs.As. [ Links ]
Carletto, M. C., J. L. Minetti, M. I. Menegazzo de García and P. M. Barbieri, 1985. Análisis de auto-correlaciones en series hidrológicas andinas. GEOACTA 13, N 1, 181-192. AAGG. Bs.As. [ Links ]
Compagnucci, R. H., J. Boninsegna and S. Heinrich, 1982. Series de precipitación de la región Centro-Oeste y sus variaciones. GEOACTA 11, N 1, 219-231. AAGG. Bs.As. [ Links ]
Compagnucci, R. H. and W. M. Vargas, 1998. Inter-annual variability of Cuyo river's streamflows in the Argentinean Andean mountains and ENSO events. Int. J. of Clim. 18, 1593-1609. [ Links ]
Cooley, W. W. and P. R. Lohnes, 1971. Multivariate Data Analysis. Wiley and Sons, New York, 364 p. [ Links ]
Díaz, H. F., R. S. Bradley and J. K. Eischeid, 1989. Precipitation fluctuations over global land areas since the late 1800's. J. Geo. Res. 94, 1195-1210. [ Links ]
Ellsaesser, H. W., M. C. Mac Craken, J. J. Walton and S. L. Grotch, 1986. Global climatic trends as revealed by the recorded data. Rev. of Geo. 24, N4, 745-792. [ Links ]
Essenwanger, O., 1976. Applied Statistics in Atmospheric Science. Elsevier Scientific Publishing Company. New York, 412 p. [ Links ]
García, N. O. and W. M. Vargas, 1998. The temporal climatic variability in the Rio de la Plata basin displayed the river discharges. Climatic Change 38, 359-379. [ Links ]
Henderson-Sellers, A. and K. McGuffie, 1987. A climate modelling primer. John Wiley Sons Ltd., 231 p. [ Links ]
Hoffmann, J. A. J., 1970. Características de las series de precipitaciones en la República Argentina. Meteorología, 1, N3, 166-190. [ Links ]
Hoffmann, J. A. J., 1988. Las variaciones climáticas ocurridas en la Argentina desde fines del siglo pasado hasta el presente. El deterioro del ambiente en la Argentina. 275-290. FECIC. Bs.As. [ Links ]
Hoffmann, J. A. J., S. E. Náñez and W. M. Vargas, 1997. Temperature, humidity and precipitation variations in Argentina and the adjacent sub-antartic region during the present century. Meteorolo Zeitschrift, N.F. 6, 3-11. [ Links ]
Jackson, J. and A. Edward, 1991. User's guide to principal components. John Willey Sons. Inc., 250 p. [ Links ]
Kalnicky, R., 1974. Climate change since 1950. Annals of the Association of American Geographers, 64, 100-112. [ Links ]
Krugger, A.C., 1999. The influence of the decadal-scale variability of summer rainfall on the impact of El Niño and La Niña events in South Africa. [ Links ]
Kugler, W.F., 1983. Discurso inaugural de la 7. Reunión Nacional del CAPERAS, IDIA, Supl. N 36. INTA. Bs.As. [ Links ]
Lund, I.A., 1969. Map classification by statistical methods. J. Appl. Metorol., 2, 56-65. [ Links ]
Mechoso, C. and G. Pérez-Irribarren, 1992. Streamflow in southern South America and the Southern Oscillation. J. Climate 5, 1535-1539. [ Links ]
Minetti, J. L., 1980. Anomalías en las precipitaciones medias del Noroeste Argentino. Tesis de licenciatura en Cs. Meteorológicas. Dpto. de Meteorología. FCEyN-UBA. [ Links ]
Minetti, J. L., S. M. Radicella, M. I. Menegazzo de García and J. C. Sal Paz, 1982. La actividad anticiclonica y las precipitaciones en Chile y zona cordillerana Central Andina. Rev. Geofísica 16, 145-157. IPGH-OEA. México. [ Links ]
Minetti, J. L. and E. M. Sierra, 1984. La expansión de la frontera agrícola en Tucumán y el diagnóstico climático. RIAT 61, N 2, 109-116. EEAOC. S.M. de Tucumán. [ Links ]
Minetti, J. L., 1995. Precipitación y escurrimientos superficiales de los ríos andinos. GEOACTA 13, N 1, 167-179. AAGG. Bs.As. [ Links ]
Minetti, J. L., M. C. Carletto and M. R. Chillemi, 1989. Procesos de memoria en el escurrimiento superficial del río San Juan. GEOACTA 17, N 2, 155-165. AAGG. Bs.As. [ Links ]
Minetti, J.L. and E. M. Sierra, 1989. The influence of general circulation patterns on humid and dry years in the Cuyo Andean Region of Argentina. Int. J. of Clim. 9, 55-68. [ Links ]
Minetti, J. L. and M. C. Carletto, 1990. Estructura espectral espacial de las precipitaciones en ambos lados de la Cordillera de los Andes en Chile y Argentina. Rev. de Geofísica 46, 65-74. Madrid. [ Links ]
Minetti, J. L. and W. M. Vargas, 1990. Comportamiento del borde anticiclónico subtropical en Sudamerica-II Parte. Rev. Geofísica 33, 177-190. IPGH-OEA. México. [ Links ]
Minetti, J. L. y C. Lamelas, 1995. Respuesta regional de la soja en Tucumán a la variabilidad climíatica. RIAT 72, N1-2, 63-68. EEAOC. S.M. de Tucumán. [ Links ]
Minetti, J. L. and W. M. Vargas, 1998. Trends and jumps in the annual precipitation in South America, south of the 15°S. Atmosfera 11, 205-223. México. [ Links ]
Minetti, J. L., 1999. Las sequías en la Argentina. Contribuciones Científicas GAEA, 60va. Sem. de Geografía, 491-496. SAEG. San Juan. [ Links ]
Minetti, J. L., W. M. Vargas, A. G. Poblete, G. Casagrande and L. R. Acua, 2001. El salto climático de las décadas de 1950-60. Evidencia de un complicado proceso de cambio climático en la R. Argentina. IX Congreso Latinoamericano e Ibérico de Meteorología-VIII Congreso Argentino de Meteorología. Bs.As. [ Links ]
Pittock, A.B., 1980. Modelos de variación climática en la Argentina y Chile. Precipitación, 1931-60. Meteorológica XI, N 1, 73-97. CAM. Bs.As. [ Links ]
Sierra, E. M., M. Conde Pratt, S. Peres and C. Messina, 1994. Variaciones del régimen de precipitaciones y del área cultivada con granos en la Argentina, 1941-90. VI Reunión Argentina de Agrometeorología. AADA. Córdoba. [ Links ]
Smagorinsky, J., 1963. General circulation experiment with primitive equation. Mon. Wea. Rev. 91, 99-164. [ Links ]
Tyson, P. and T. G. Dyer, 1975. Secular changes in South Africa rainfall, 1880 to 1972. Quar. J. R. Met. Soc. 101, 817-833. [ Links ]
Tyson, P. and T. G. Dyer, 1978. The predicted above normal rainfall of the seventies and the like hood of droughts in the eighties in South Africa. S. Afr. J. Sc. 74, 372-377. [ Links ]
Tyson, P., 1981. Atmospheric circulation variations and the occurrence of extended wet and dry spells over South Africa. J. of Clim. 1, 115-130. [ Links ]
Tyson, P., 1986. Climatic change and variability in Southern Africa. Oxford University Press, Cape Town, 220 pp. [ Links ]
Tyson, P., 1991. Climate change in Southern Africa. Past and present conditions and possible future scenarios. Climate Change 18, 241-258. [ Links ]
Tyson, P., A. P. Sturman, B. B. Fitzharis, S. J. Mason and I. F. Owens, 1997. Circulation changes and teleconections between glacial advances on the west coast of New Zealand and extended spells of drought years in South Africa. Int. J. Clim. 17, 1499-1512. [ Links ]
Vargas, W. M., J. L. Minetti and A. G. Poblete, 1995. Statistical study of climatic jump in the regional zonal circulation over South America. J. Met. Soc. of Japan 73, 849-856. [ Links ]
Vargas, W. M., J. L. Minetti and A. G. Poblete, 2001. Low-frequency oscillations in climatic and hydrological variables in southern South America's tropical-subtropical regions. Theory and Applied Climatology, 72, 29-40. [ Links ]
Villalba, R. and J. Boninsegna, 1985. Desarrollo de cronologías en el Noroeste Argentino. GEOACTA 13, N° 1, 131-139. AAGG. Bs. As. [ Links ]
Vines, R. G., 1982. Rainfall patterns in southern South America, and possible relationships with similar patterns in South Africa. S. African J. Sei. 78, 457. [ Links ]
WMO-World Meteorological Organization, 1966. Climate change. Technical Note N° 79. [ Links ]
Yamamoto, R. T., T. Iwashima, S. N. Kadi and M. Hoshiai, 1985. Climatic Jump: A hypothesis in climatic diagnostic. J. Met. Soc. of Japan 63, 1157-1160. [ Links ]
Yamamoto, R. T., T. Iwashima, N. K. Sange and M. Hoshiai, 1987. Climatic Jump in the atmospheric general circulation. Reprint from Annual of Disaster Prevention Research Institute. Kyoto University, 308, 309-325. [ Links ]

