


Serviços Personalizados
Journal
Artigo
 Inglês (pdf)
 Artigo em XML
 Referências do artigo
 Enviar este artigo por email
Indicadores
-
 Citado por SciELO
 -
 Acessos
Links relacionados
-
 Similares em
SciELO
Similares em
SciELO
Compartilhar

 Permalink
Atmósfera
versão impressa ISSN 0187-6236
Atmósfera vol.15 no.4 Ciudad de México Out. 2002
Impact of NOAA/TOVS derived moisture profile over the ocean on global data assimilation and medium range weather forecasting
D. RAJAN
National Centre for Medium Range Weather Forecasting, Mausam Bhawan Complex, Lodi Road, New Delhi-110 003, India
B. SIMON, P. C. JOSHI
Atmospheric Sciences Division, Space Application Centre , Ahmedabad-380 053, India
V. B. BHATIA,
Department of Physics and Astrophysics, University of Delhi-110 007, India
A. K. MITRA, R. K. PALIWAL
National Centre for Medium Range Weather Forecasting, Mausam Bhawan Complex, Lodi Road, New Delhi-110 003, India
(Manuscript received April 20, 2001; accepted in final form April 3, 2002)
RESUMEN
Una distribución tridimensional realista de la humedad en la condición inicial es esencial para una predicción meteorológica exitosa. El perfil de humedad constituye un ingrediente directo en cualquier modelo de pronóstico. Dado que el subcontinente indio, rodeado de océano, es una de las enormes regiones tropicales escasas de datos, la percepción remota es una fuente importante de información meteorológica, usada en varios centros operacionales de predicción numérica del tiempo para preparar las condiciones iniciales. Los datos de temperatura y precipitación sondeados del Satélite de TV y Observación Infrarroja (TIROS), Centro Vertical Operacional (TOVS), a bordo del satélite orbitador polar de NOAA, se reciben rutinariamente en el Centro Nacional de Pronóstico a Mediano Plazo (NCMRWF), a través del Sistema Global de Telecomunicación (GTS). La información sobre la humedad está disponible en tres capas anchas.
En este estudio se intenta deducir el perfil de humedad a partir del satélite orbitador polar de NOAA, usando el algoritmo de escala variable en la altura. Estos perfiles calculados en niveles barotrópicos estándar se validan con observaciones coincidentes de radiosondeo, otras estimaciones de humedad, y análisis. La validación muestra un error cuadrático medio (r.m.s.) menor a 10%. El impacto de estos perfiles de humedad se examina en el sistema de análisis y pronóstico del NCMRWF para junio de 1997. Se advierte un impacto positivo de esta humedad deducida del TOVS en el pronóstico del inicio del monzón de ese año. También se presentan algunos resultados durante las depresiones monzónicas del mismo periodo. En particular, se mejoró el pronóstico de lluvia para el 20 de junio de 1997.
ABSTRACT
A realistic three-dimensional distribution of moisture in the initial condition is essential for successful numerical weather prediction. The moisture profile serves as direct input to any forecast model. Since the ocean surrounding the Indian sub-continent is one of the enormous data sparse regions in the tropics, the remotely sensed data is an important source of meteorological information, used at various operational numerical weather prediction centers for preparing initial conditions. The temperature and moisture sounding data from the Television and Infrared Observation Satellite (TIROS) and the Operational Vertical Center (TOVS) onboard the National Oceanographic Atmospheric Administration (NOAA) polar orbiting satellite is being routinely received at National Centre for Medium Range Weather Forecasting (NCMRWF) through the Global Telecommunication System (GTS). Moisture information is available at three broad layers.
In the present study an attempt has been made to derive a humidity profile from the NOAA polar orbiting satellite by the variable scale height algorithm. These profiles derived at standard pressure levels are validated with coinciding radiosonde observations, other humidity estimations, and analysis. The validation indicates that the percentage of root mean square (r.m.s) error is less than 10%. The impact of these moisture profiles is examined in the NCMRWF analysis and forecast system for the June 1997 period. A positive impact of this TOVS derived moisture in the forecast of onset of monsoon-97 is noticed. Some of the results during the monsoon lows and depression are also presented for the same period. In particular the rainfall forecast for 20th June, 1997 has improved.
Key words: Moisture, satellite, TOVS, NOAA.
1. Introduction
The science of meteorology and the practice of weather forecasting have immensely improved over the years and many of the improvements are linked to our ability to observe the global atmosphere from space based platforms (satellites), the availability of enhanced computing power, and the advancement of knowledge in several allied disciplines. The NCMRWF was created with an objective to provide medium range forecasts over monsoon regions and to provide agro-meteorological advisory services to the farming community in India. The quality of numerical weather forecast depends on the accurate and complete description of the initial state of the atmosphere. The available observational network, which helps to define the initial state of the atmosphere, consists mainly of conventional meteorological observations for users in India, depending upon the available computer and communication resources, and the satellite data reception for the Indian region. Several uncertainties and inconsistencies exist in representing the complete atmospheric state, particularly over data sparse oceanic regions. Humidity data over land may be adequately representing the observed state by radiosonde observation network. On the other hand, the profiles of humidity and temperature derived from satellite data have good coverage over the ocean. Notwithstanding the limitations, satellite estimations are of importance in numerical weather prediction (Lorenc, 1986; Baker 1989). Hence, it is necessary to supplement the information from different observing systems at equal intervals of time to create a reasonably accurate description of the initial sate of the atmosphere for the data gaps over oceanic regions. Cloud Motion Vector (CMV) are available over the Indian oceanic region from the Indian National Satellite (INSAT). Besides INSAT, polar orbiting satellites also provide a lot of data over the Indian region since 1977. Few atmospheric models however are capable of incorporating new kinds of data readily, unless specifically designed for this purpose. All models have significant problems in using new data of any type. Hence, the study of validation and impact of satellite products on models is very important (Joshi et al., 1996, 1998, Yu and McPherson, 1984). When the humidity parameter is concerned, most of the modeling effort is done by using radiosonde humidity data as the only observation available.
The TOVS onboard the NOAA satellite has three infrared channels (8.3, 7.3 and 6.7μm) and has the capability of providing three-layer moisture data (Smith et al., 1979). These channels give precipitable water vapor in three different layers (i.e., 1000-700, 700-500, and 500-300 hPa). The temperature and moisture sounding data from TOVS onboard the NOAA polar orbiting satellite is being routinely received at NCMRWF through GTS at a resolution of roughly 500 km. NOAA temperature sounding data from TOVS are available in 15 layers. The general problems of humidity assimilation in numerical weather prediction are well documented (Eyre, 1989, Smith, 1991).
In the tropics, especially in the Indian Ocean region, the water vappr is highly heterogeneous in nature. The temperature and moisture data from NOAA/TOVS satellite data for five years were processed to study their usefulness in characterizing the onset of southwest monsoon over India (Simon and Joshi, 1994). In this regard, this algorithm might be useful to derive the vertical profile of moisture from total precipitable water content information over the Indian Ocean. The instantaneous specific humidity at the ocean surface can be estimated (Simon and Desai, 1986) by a model using variable scale height of water vapor using the three broad layer humidity and temperature sounding data. The scale height of water vapor obtained was later used to extrapolate the humidity profile over oceanic regions. A method of obtaining humidity profiles over the oceans from total integrated water vapor using microwave data has also been suggested (Liu et al., 1991, Basu et al., 1995).
In the present study an attempt has been made to derive a moisture profile from the NOAA polar orbiting satellite by the variable scale height algorithm (Simon et al., 1995). These profiles derived at standard pressure levels are validated with coinciding radiosonde observations and model analysis. Further, the impact of this humidity data on medium range analysis/forecast is also studied. The comparison of humidity derived from the Empirical Orthogonal Function (EOF) algorithm is also presented in this study.
2. Data used
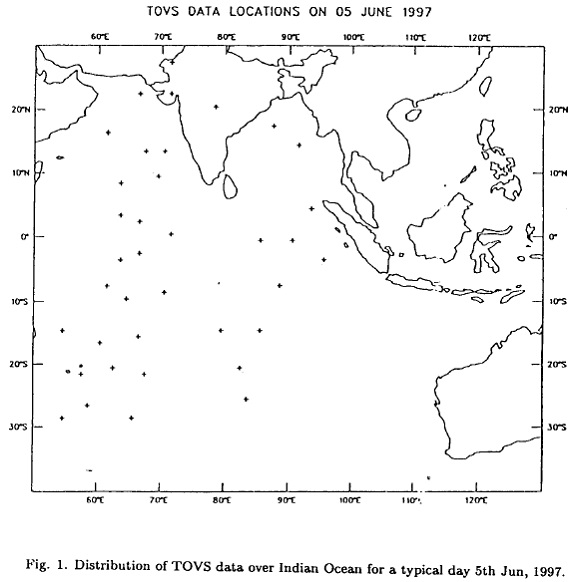
Conventional radiosonde gives values of temperature and humidity at various pressure levels at its observations locations. The region under investigation extends form 50°E to 130°E and 40°S to 30°N. A period of 25 days starting 1st June 1997 is considered in order to examine the impact of TOVS derived humidity data on medium range forecast. The spatial coverage of NOAA/TOVS data on a typical day valid for 5th June 1997 is shown in Figure 1. At present the GTS data is available only in a coarser resolution. We hope to have higher resolution (0.5° x 0.5° lat/lon) data in the future. Operational medium range analysis/forecasting system with the global spectral model of NCMRWF is used in the present study.
3. Humidity profile derivation technique
The derivation of the vertical moisture profiles is similar to Simon et al., 1995. The layers mean temperatures (i. e. 1000-850 and 850-700 hPa) provided by NOAA satellite sounding data were used along with geopotential heights. The humidity sounding data in two layers were also used. Let W1 be the vapor content in the 1000-700 hPa layer and W2 be the water vapor content in the layer (700-500 hPa layer). Assuming an exponential density profile one can have the equations
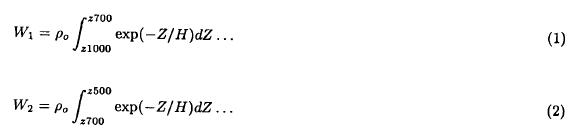
where H is the scale height of water vapor, ρ0 is the water vapor density at the surface, Z is the geo-potential height. Taking ratio of the above two equations, ρ0 can be eliminated.
Expressing the difference as f(H), we can write:

Equation f(H) = 0 is solved iteratively by applying Newton-Raphsons iteration to get scale height 'H' An initial estimate of 2.0 km is chosen for 'H'. The function f(H) is differentiated explicitly to apply Newton-Raphson iteration. If 'H' exceeds 3 km or falls below 1 km, iteration is interrupted. Normally, iteration terminates with a threshold of 0.01 in successive differences of ratios. A simpler method of finding the minimum value of H between 1 and 3 km at intervals of 0.01 km (in two steps) is adopted. This is because the initial data sample, processed by Newton-Raphsons procedure always yields values of 'H' between 1 and 3 km (Simon et al., 1995). The scale height of water vapor thus obtained is substituted in the following equation:

to get the moisture profile at the standard levels viz 1000, 850, 700, 500, 400, and 300 hPa for comparison and impact studies.
4. Analysis-Forecasting System
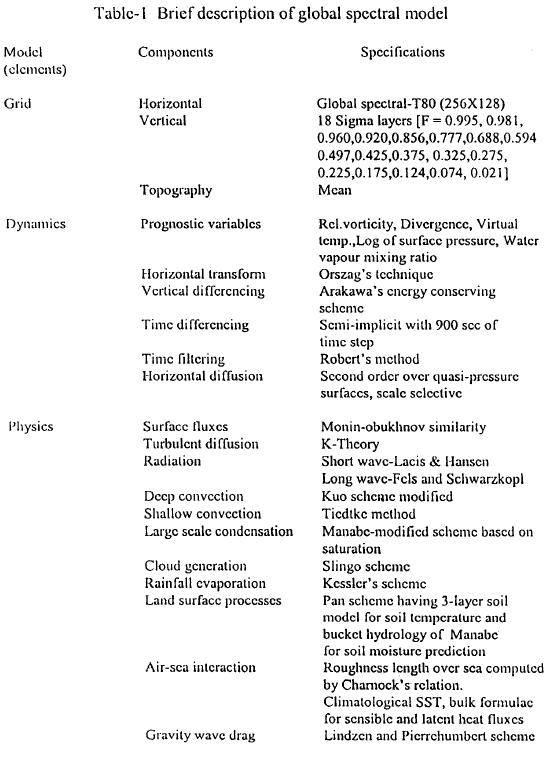
The global data assimilation and forecast system of the NCMRWF consists of a model adapted from the National Center for Environmental Prediction (NCEP) in the USA, with an intermittent data assimilation scheme involving the Spectral Statistical Interpolation (SSI) Technique. The model uses the triangular truncation at wave number 80 in horizontal and 18 layers in vertical, and is abbreviated as T-80/L-18 (Sela, 1980). In gaussian grid representation there are 256 grid-points in east west and 128 in the north-south direction. The model uses physical parameterization packages. The radiation parameterization is treated separately for short and long wave computations. The short wave calculations use the scheme developed by Lacis and Hansen (1974) and long wave radiation calculations use a formulation by Fels and Schwarztkopf (1975). The mountains are represented as resolved mean orography at model resolution. The mean monthly climatological fields of vegetation cover index, roughness length, soil moisture, snow cover, and sea surface temperatures are used as lower boundary conditions during the time of integration of the model. In the assimilation cycle, six-hour forecasts of the global model are utilized to serve as first guess for the subsequent analysis. The analysis variables are vorticity, mixing ratio, unbalanced part of divergence, temperature, and logarithm of surface pressure. Further details of the global model and analysis scheme are described in Kanamitsu (1989) and Parrish and Derber (1992), respectively. The forecast model is based on the primitive equations for vorticity, divergence, virtual temperature, logarithm of surface pressure, and specific humidity. These equations include forcing terms, diabatic heating terms, and source/sink terms, which represent physical processes. A brief summary of the model dynamics and Physics are given in Table 1.
5. Design of validation and numerical experiments
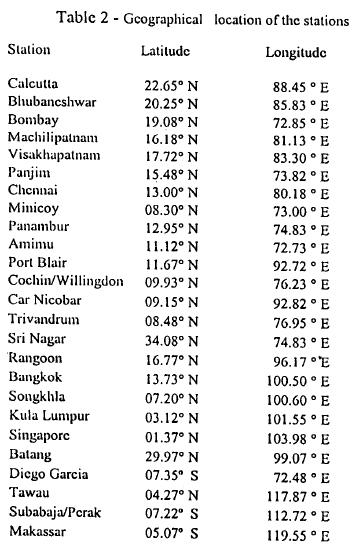
In the operational suite of the analysis-forecasting system, all types of data received on GTS are used in the 6-hour assimilation cycle. Different experiments were conducted in order to examine the quality and accuracy of TOVS derived moisture data. The analyses and forecast fields up to 120 hrs thus generated with the TOVS derived moisture. These runs were compared with the corresponding operational archives of the analysis-forecast system. The impact of the TOVS moisture data is examined in the window 30°N to 40°S and 50°to 120°E, i. e., mainly over the Indian Ocean region. In this study an attempt has been made to compare the moisture values derived from TOVS satellites with Radio Sonde/Rawin Winds (RSRW) observations, and the NCMRWF model produced moisture for a sample period of 25 days in the month of June 1997 for an initial comparison. The TOVS derived moisture values were interpolated for any station either by taking the nearest available value or by taking 4 point average. Only 25 island/coastal stations were selected, to get an assessment on the quality over the oceanic region. The list of the stations is given in Table 2 and include geographic locations.
The second part of the study examines the impact of NOAA/TOVS humidity profile on the analysis/forecast system. We have basically selected three periods to study the impact. The first period (Period I) is the onset of monsoon, which occurred on 9th of June in the year 1997. The second period (Period II) is when a low-pressure area was formed over the North Bay of Bengal and the adjoining part of Gangetic West Bengal, and Bangladesh on 23rd June 1997, and became a well marked low on 24th over northwest Bay of Bengal. And a third period was when there was a low-pressure area on 19-20th June in the northern Arabian Sea, off the Gujarat coast, with central region near (21°N, 68°E). We have examined the impact of inclusion of NOAA/TOVS satellite derived profiles, on the forecast for the above period too. The study without the TOVS profile is referred to as 'operational forecast' (opr), and the one with NOAA/TOVS derived profile is referred to as the 'experiment' (exp).
6. Results and discussion/conclusions
We have compared the TOVS derived profiles with Radio RSRW observations nearer to the satellite sounding by taking the radius of 150 km, which is approximately equal to the model resolution. The TOVS derived specific humidity profiles, RSRW observations along with model analyzed profiles and EOF derived profiles (Rajan et al., 2000) are shown in Figure 2 for two typical stations, namely Bangkok and Singapore.
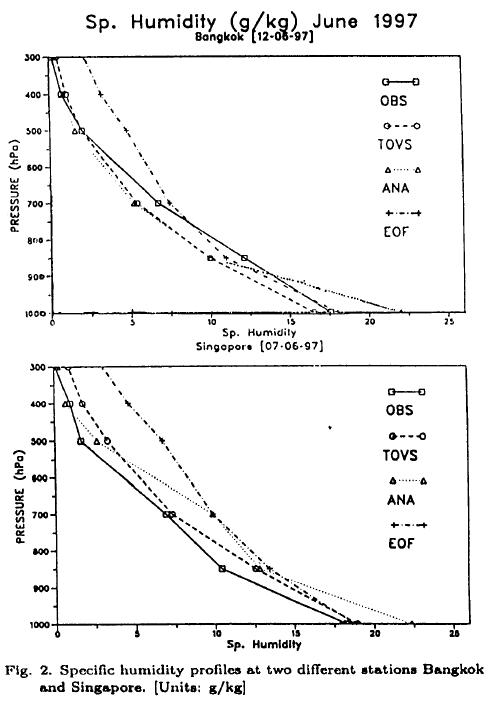
The specific humidity profile over Singapore on 7th June and Bangkok on 12th June indicate that the TOVS derived profiles are closer to the observed profiles, especially at the lower levels. On the other hand, the analysis profiles are more moist than the observed one up in the middle troposphere.
The TOVS derived moisture profile and the RSRW observations for few others selected stations, namely Port Blair, Minicoy, Amimu, and Calcutta, are shown in Figure 3. The mean profile plots for the period 1 to 15 June for the operational runs are shown in Figure 3. From Figure 3, it is noted that the TOVS derived moisture profiles are comparing well with the RSRW observation at the lower and upper tropospheric levels. The above comparison was made with the NCMRWF analyzed moisture profile too. It is concluded from Figure 3 that the model-analyzed values are more moist by 3-5 g/kg, especially over surface, than the observed and derived profiles. The root mean square error is shown in Table 3 for the above selected stations.
The percentage rmse between the TOVS derived profile and the observation is found to be less than 15% in the lower troposphere. This justifies the use of variable scale height moisture data over the Indian ocean region in the analysis/forecast system.
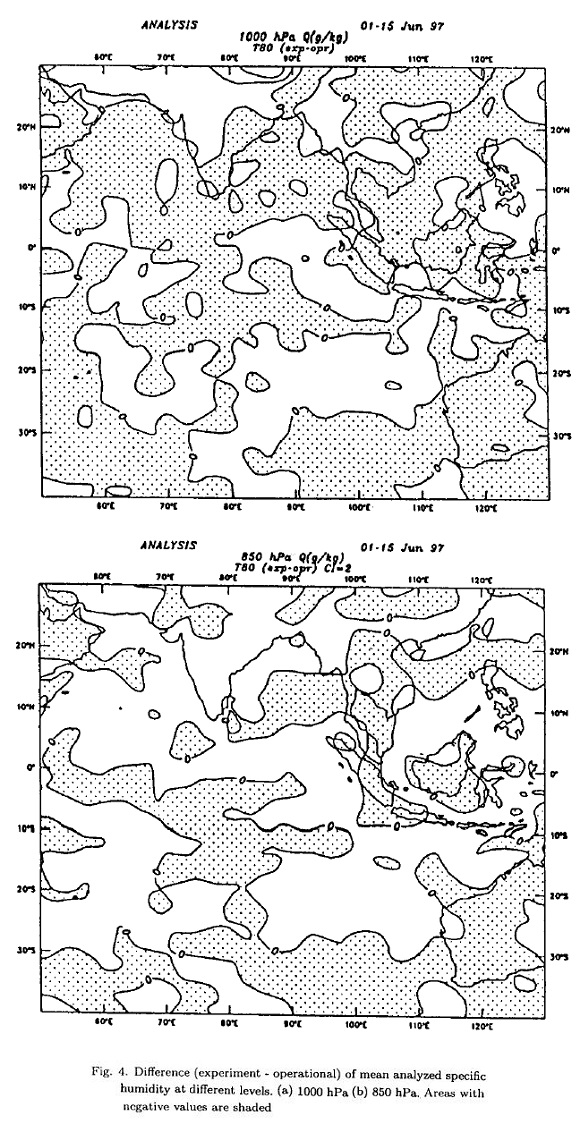
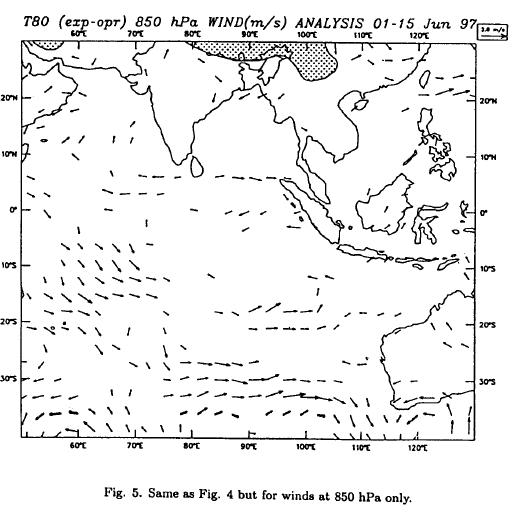
Numerical experiments were conducted in such a way that there was an assimilation with and without the derived moisture profiles for the period 1-15 June 1997, then the mean analysis for the experimental runs was compared with the operational runs. The difference of mean specific humidity for the above 15 days period is separately shown in Figure 4 for the 1000 hPa and 850 hPa levels. It is noted that in most of the oceanic part there is lesser specific humidity in the experimental runs when compared to control runs. The difference in the mean flow pattern at 850 hPa is shown in Figure 5. It is very clear that there is a strong westerly zonal flow in the Southern Hemisphere oceanic region. There are northerly winds passing along the latitude 10 to 20°S, near the equator.
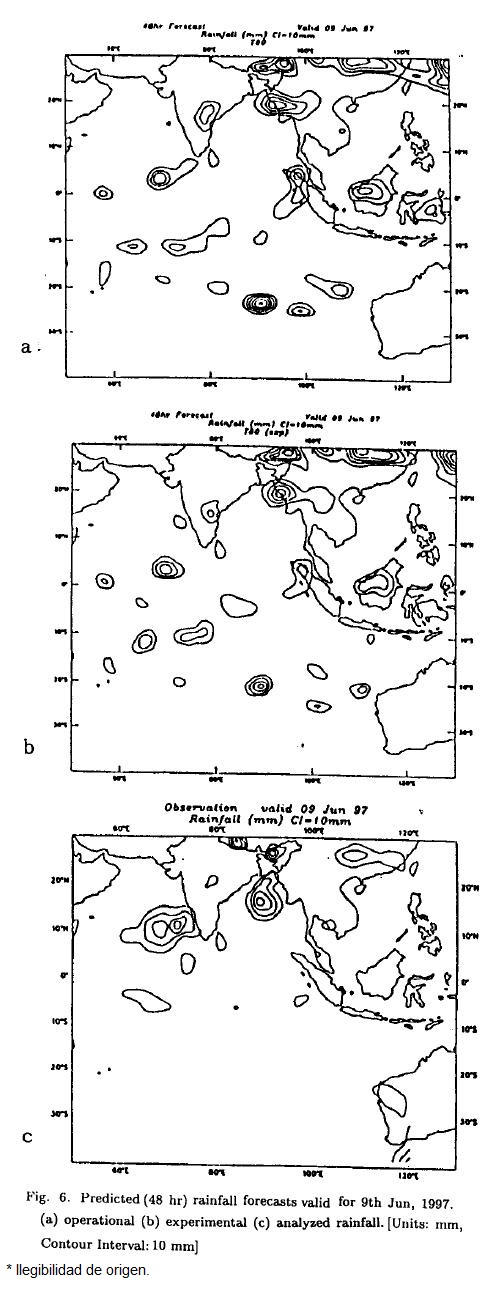
One forecast experiment was conducted during the 1-7th June 1997 period (Period I). Now we have two initial conditions for the 7th of June. Thus, with the initial condition of the 7th of June, the experimental forecast was made up to 72 hrs. In the operational forecast the rainfall over the Northern East Indian region was of the order of 2 cm, shown in Figure 6a, whereas in the experimental forecast the rainfall was of the order of 4 to 5 cm, shown in Figure 6b. A positive impact on the rainfall was registered after the inclusion of the NOAA/TOVS humidity profile according to the initial condition on the 48 hrs forecast valid for 9th June, 1997. This impact has been compared with another scheme as well. The actual rainfall observation by the Indian Meteorological Department (IMD) (land stations in the Northeast) showed rainfall of the order of 6 to 8 cms. For the same day we have also performed a rainfall objective analysis (Mitra et al., 1997) (Fig. 6 c). This analysis also showed heavy rain over the Northeast and Bengal, with two significant maximum zones, over North Bengal and Northeast.
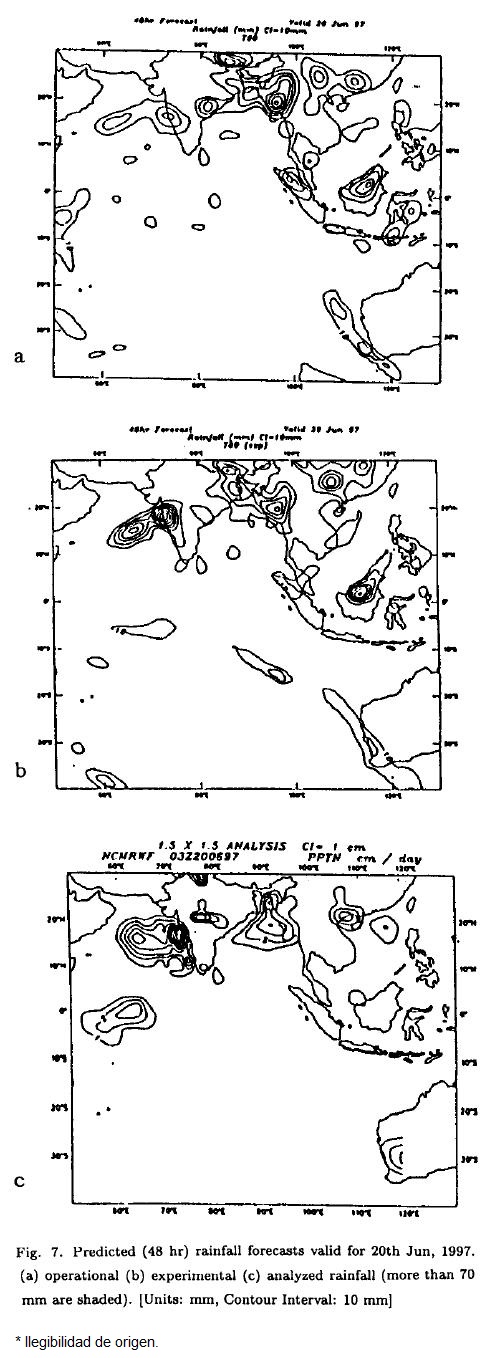
In the second experiment (Period II), assimilation was done with and without the TOVS derived profile. With the initial condition of 18th June, 48 hours forecast was made which is valid for 20th June 1997. A more significant impact was found when initial condition had a TOVS derived profile, compared to the operational forecast shown in Figure 7a and Figure 7b. The actual amounts of rainfall as observed by the India Meteorological Department over the Konken region are viz Ratnagiri (15 cms), Akola (9 cms), Mahabelswar (9 cms), and Karwar (8 cms). The 48 hours experimental forecast using the derived profile also showed similar high values over the Konken region (of the order of 15-16 cms). Where-as the operational forecast showed rainfall of the order of 3cms only, thus the operational forecast grossly underestimats the rainfall. Secondly, the Northeast rainfall is overestimated by the operational forecast (~14 cm), where-as the experimental forecast showed it (~10 cm). When these two forecasts were compared with the actual rainfall given by IMD it was noted that the actual rainfall was of the order of 4 to 5 cms, s shown in Figure 7 c.
Acknowledgement
The authors are thankful for many useful discussions with Dr. M. S. Narayanan (SAC). The encouragement given by Dr. S. V. Singh (NCMRWF), and Shri A. K. S. Gopalan (Director, SAC) are also gratefully acknowledged. We gratefully thank Dr. Gopal, Dr. Praveen, and Dr. B. Athiyaman, Scientists of NCMRWF, India for their useful advise and help.
REFERENCES
Baker, W. E., 1989. Satellite Applications at NMC. Proceedings of the Workshop on Satellite Meteorology in NWP. European Center for Medium-Range Forecasting Report 173-203. [ Links ]
Basu, S., R. Gairola, C. M. Kishtwal, and P. C. Pandey, 1995. Empirical orthogonal function analysis of humidity profiles over Indian Ocean and an assessment of their retrieval ability using satellite microwave radiometry. J. Geophys. Res., 100(D11) , 23009-23017. [ Links ]
Eyre, J. R., 1989. Inversion of cloudy satellite sounding radiance's by nonlinear optimal estimation, Application to TOVS data. Q. J. R. Meteorol. Soc.,115, 1027-1037. [ Links ]
Fels, S. B., and M . D. Schwarztkopf, 1975. The simplified Exchange Approximation- A New Method for Radiative Transfer calculations. J. Atmos. Sci., 32, 1475-1488. [ Links ]
Joshi, P. C, B. Simon, M . S. Narayanan, S . R . H. Rizvi, and R . K. Bansal, 1996. Impact of ERS-1 surface wind data in the analysis for medium range weather forecasting. Advances in Tropical Meteorology. [ Links ]
Joshi, P. C., C. M. Kishtwal, B. Simon, M. S. Narayanan, S. R. H. Rizvi, and R. K. Bansal, 1998. Impact of ERS-1 scatterometer data in medium range forecasting (Cyclone and Monsoon). ISRO Report no. 43-98. [ Links ]
Kanamitsu, M., 1989. Description of the NMC global data assimilation and forecast system. Wea. Fore., 4, 335-342. [ Links ]
Lacis, A. A., and J. E. Hansen, 1974. A parameterization for the absorption of solar radiation in the earth atmosphere. J. Atmos. Scz.,31, 118-133. [ Links ]
Liu, W. T., W. Tang, and P. Niller, 1991, Humidity profiles over ocean, J. Climate. 4, 1023-1034. [ Links ]
Lorenc, A. C, 1986. Analysis methods for numerical weather prediction. Q. J. R. Meteorol . Soc., 112, 1177-1194. [ Links ]
Mitra, A. K., A. K. Bohra, and D. Rajan, 1997. Daily Rainfall Analysis for Indian Summer Monsoon region. Int. J. Clima., 17, 1083-1092. [ Links ]
Parrish, D. F., and J. C. Derber, 1992. The National Meteorological Center's spectral statistical interpolation analysis system. Mon. Wea. Rev., 120, 1747-1763. [ Links ]
Rajan, D., S. R. H. Rizvi, V. B. Bhatia, and H. V. Gupta, 2000. Intercomparison of satellite derived OLR and total precipitable water content over India and their impact on the analysis-forecast system. Indian J. Radio & Space Phys., 29, 341-348. [ Links ]
Sela, J. G., 1980. Spectra 1 modeling at NMC. Mon. Wea. Rev., 108, 1279-1292. [ Links ]
Simon, B., and P. C. Joshi, 1994. Determination of moisture changes prior to the onset of south-west monsoon onset over Kerala using over Kerala using NOAA/TOVS data. Meteor. and Atmos. Phy., 53, 223-231. [ Links ]
Simon, B., P. C. Joshi, and P. S. Desai, 1995. Moisture profiles over tropics from NOAA/TOVS satellite data. J. Geophys. Res., 100 (D), 1439-1443. [ Links ]
Simon, B., and P.S. Desai, 1986. Equatorial Indian Ocean evaporation estimates from operational meteorological satellites and some inferences in the context of monsoon onset activity. Bound. Layer Meteor., 37, 37-52. [ Links ]
Smith, W. L., 1991. Atmospheric soundings from satellites A false expectation or the key to improved weather prediction. Q. J. R. Meteorol. Soc., 117, 267-297. [ Links ]
Smith, W. L., H. M. Woolf, C. M. Hyden, D. Q. Wark, and C. M Mcmil, 1979. The TIROS-N operational vertical Sounder. Bull. Amer. Meteorol. Soc., 60, 1177-1187. [ Links ]
Yu, T. W., and R. D. McPherson, 1984. Global data assimilation experiments with scatterometer winds from SEASAT. Mon. Wea. Rev., 112, 368-376. [ Links ]

