


Servicios Personalizados
Revista
Articulo
 Inglés (pdf)
 Artículo en XML
 Referencias del artículo
 Enviar artículo por email
Indicadores
-
 Citado por SciELO
 -
 Accesos
Links relacionados
-
 Similares en
SciELO
Similares en
SciELO
Compartir

 Permalink
Atmósfera
versión impresa ISSN 0187-6236
Atmósfera vol.15 no.3 Ciudad de México jul. 2002
Mexico's summer rainfall patterns: an analysis of regional modes and changes in their teleconnectivity
P. J. ENGLEHART and A. V. DOUGLAS
Department of Atmospheric and Environmental Sciences, Creighton University, Omaha, NE 68178-0110, USA
(Manuscript received March 27, 2001; accepted in final form September 24, 2001)
RESUMEN
Este estudio explora la variabilidad interanual de la lluvia de verano en México. Se basa en el análisis de datos históricos de la lluvia de 130 estaciones con un periodo largo de observación (1927-1997). La red de estaciones provee información espacial razonable sobre la mayor parte del país. Mediante un análisis de agrupamiento, en el estudio se delimitan cinco regiones relativamente grandes. Dentro de cada una de estas regiones, la lluvia mensual de las estaciones exhibe niveles altos de coherencia espacial. La estructura de cada región es clara y físicamente razonable en relación a la climatología de México. Las series de tiempo regionales son expresadas como desviación con respecto a la normal. En la mayor parte de estas series, la persistencia intraestacional, es decir, de un mes a otro, es mínima; de hecho, solamente algunas de las series muestran tendencias significativas hacia un comportamiento serial no aleatorio. Este estudio evalúa la teleconectividad entre la series de lluvia regionales y varios índices de la variabilidad oceanográfica y atmosférica de gran escala, que incluyen un índice asociado a El Niño-la Oscilación del Sur, diferentes índices que describen la posición e intensidad del cinturón subtropical de altas presiones, así como valores locales de la temperatura del agua de la superficie del mar en el Pacífico Oriental y Golfo de México. Todos los análisis de teleconexión consideran el modo de variabilidad quasi-decadal comúnmente conocida como Pacific Decadal Oscillation (PDO). Los resultados del estudio están de acuerdo con los resultados de otros investigadores, que muestran una teleconectividad diferencial como una función de fase PDO. Sin embargo, a diferencia de otros estudios, no se encuentran evidencias de un comportamiento no lineal en las teleconexiones dentro de la fase PDO. En lugar de eso, el rasgo más destacado de las teleconexiones es simplemente que éstas tienden a ser más fuertes y extensas especialmente durante una fase positiva PDO.
ABSTRACT
This study explores the interannual variability in Mexico's warm season rainfall. It is based on historical rainfall data (1927-1997) from a grid of 130 long-term stations. The grid provides reasonable spatial coverage over most of the country. Using Principal Components Analysis, this study delimits five relatively large sub-areas of the country. Within each of these regions, monthly station rainfall exhibits high levels of spatial coherence. The regional structures are distinct and physically plausible with respect to the climatology of Mexico. The regional time series are expressed as departures from normal. In most of these series the intraseasonal, that is, month to month, persistence is minimal; in fact, only a few of the series display significant tendencies toward nonrandom serial behavior. This study evaluates the teleconnectivity between the regional rainfall series and several different indices of large-scale ocean and atmosphere variability. These indices include an El Niño-Southern Oscillation index, indices that describe the strength and position of the subtropical anticyclone belt, as well as local SSTs in the Eastern Pacific and the Gulf of Mexico. All of the teleconnection analyses consider the quasi-decadal mode of variability that is commonly referred to as the Pacific Decadal Oscillation (PDO). The study results generally agree with the findings of other researchers to the extent that they indicate differential teleconnectivity as a function of PDO phase. However, unlike other studies, we see no compelling evidence for non-linear behavior in the teleconnections within PDO phase. Instead, the more prominent feature of the teleconnections is simply that they tend to be both more spatially extensive and stronger in the positive PDO phase.
Key words: Mexico, summer rainfall, Mexican Monsoon, principal component analysis, teleconnections.
1. Introduction
Controlled partly by complex topography and proximity to the twin moisture sources of the Eastern Pacific Ocean and the Gulf of Mexico - the rainfall climatology of Mexico displays remarkable spatial variations. Still, for much of the country, warm season rainfall normally accounts for the bulk of annual precipitation. Mosiño and García (1974) for example show that virtually all Mexican stations receive more than 70% of their annual rainfall between May and October. In fact, the importance of warm season rainfall to Mexico probably cannot be overstated. Variations in both seasonal amounts and the timing of rainfall within the season certainly influence the production of food staples such as maize (Englehart and Douglas, 2000). In the broader context of concern about human-induced climate change, several researchers have demonstrated the inherent sensitivity of Mexico's water resources to climate variability (Magaña et al., 1997; Mendoza et al., 1997).
This study provides another view of the interannual variability in Mexico's warm season rainfall. It explores the subject in two parts. The first involves the definition of regional rainfall modes based on the statistical techniques of principal component analysis (PCA). The resulting modes represent relatively large sub-areas of the country within which monthly station rainfall exhibit high levels of intercorrelation. In the vernacular of PCA, this property often is referred to as "spatial coherence" (Englehart and Douglas, 1985).
The second part of the study involves correlation or teleconnection analysis between the regional rainfall time series and several different indices of large-scale ocean and atmosphere variability. Teleconnection studies in various formats, figure prominently in the volumes of meteorological/climatological literature. The analyses by Sir Gilbert Walker of the Indian monsoon (Walker, 1923) usually are considered to be the pioneering work in this area. Today, for virtually any part of the world one probably can find a teleconnection study that relates fluctuations in surface climate to some index of the El Nino-Southern Oscillation (ENSO) signal. For rainfall in Mexico, relevant teleconnection studies include Ropelewski and Halpert (1986, 1987); Kane (1997); and Douglas and Englehart (1998).
In recent years impressive evidence has accumulated to support the idea that the climate of the North Pacific Ocean exhibits relatively distinct, long-period fluctuations. This mode of variability usually is characterized as occurring on inter- or quasi-decadal timescales; it often is referred to as the Pacific Decadal Oscillation, or the PDO (Mantua et al., 1997). The present study evaluates variability in Mexico's summer rainfall via the general question: are the interdecadal shifts in the PDO associated with significant changes in teleconnectivitiy between Mexican rainfall and large-scale climate modes like ENSO? The work is motivated partly by the findings of Gershunov and Barnett (1998) and McCabe and Dettinger (1999). Their results indicate that the teleconnectivity between Winter rainfall over parts of North America and ENSO does in fact change depending upon the long-term state of the PDO.
The remainder of this paper is organized into three sections. Section 2 outlines the datasets and methods used in the study. Section 3 presents the basic study results. The final section provides discussion and a summary of the principal study findings.
2. Data and Methods
2a. Data
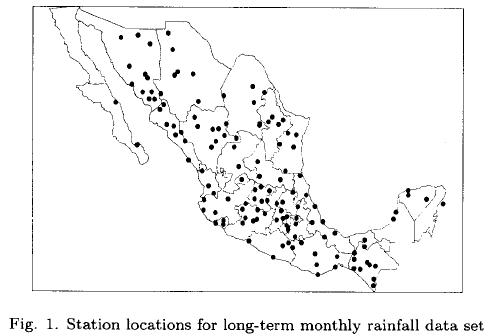
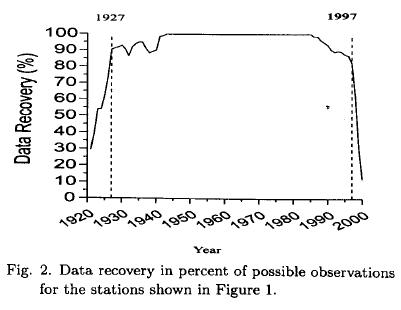
This study investigates the large-scale spatial and temporal variability in Mexico's summer rainfall patterns. It uses monthly rainfall data, June through September, for the 130 station grid shown in Figure 1. The database was developed from a variety of primary sources including archived paper copy of monthly data, as well as digital records of monthly and in some cases daily rainfall. The database reflects contributions by many members of Mexico's meteorological community. Their cooperation and efforts are gratefully acknowledged. Figure 2 summarizes the overall success of this data archaeology project. It shows that the monthly data capture for the grid exceeds 80% for all years in the period 1927-1997 with capture rates >90% from the early-1930s through the early-90s.
There are several different indices that could be used to represent the El Niño-Southern Oscillation (ENSO) phenomena. Our choice is an equatorial rainfall index (ERI). The ERI is based on normalized rainfall from island stations in the central Equatorial Pacific (Wright, 1979). Strong positive values of the index correspond to El Niño events while negative values correspond to cold water, La Niña events. The PDO index developed by Mantua et al. (1997) is used to represent ocean-atmosphere variability across the extratropical Pacific. It is defined as the first principal component of North Pacific monthly sea surface temperature variability (poleward of 20°N). The positive (negative) phase of the PDO is characterized by below (above) normal SSTs in the western and central North Pacific with warmer (colder) than normal SSTs extending southward from the Gulf of Alaska to the southern tip of Baja California Sur. Digital values of the index are available in electronic format (Mantua, 2000).
In previous work we have presented evidence for statistical connections between monthly and seasonal rainfall variability in Mexico and time-averaged anomalies in atmospheric circulation (Douglas and Englehart, 1997). From these results it seems apparent that variations in summer rainfall are related partly to year-to-year fluctuations in the position and strength of the anticyclones that during the summer are normally found over the North American continent, and in the subtropical North Pacific and North Atlantic Oceans. This study combines several indices as a means to represent variability in the subtropical anticyclone belt. Fluctuations in the continental anticyclone are described by time series of mid-tropospheric ridge position (RP) which is defined as the latitude of the ridge line at the intersections with 95°W and 110°W longitudes. RP is inferred from upper air wind data at 3000m or 700mb and is based on locating the axis of change from easterly to westerly wind components. The development methodology for RP mirrors the one used by Indian meteorologists in their long-range forecasting of the Asian monsoon (Banerjee et al., 1978). Variations in the Eastern North Pacific anticyclone and in the Bermuda High are represented by time series of sea level pressure (SLP) anomalies averaged over the areas shown in Figure 3. The areas were selected to match: 1) the normal summer position for the North Pacific High; and 2) the westward extension of the North Atlantic High. The SLP data are based on analysis of the Comprehensive Ocean Atmosphere Data Set (COADS) performed by Kaplan et al. (2000). These data are available in electronic format (IRI/LDEO, 2000)
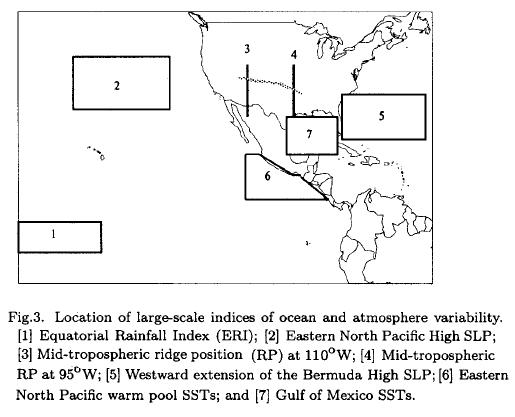
To evaluate the teleconnections between regional rainfall and near-field or local SSTs, this study uses spatial averages for the two areas shown in Figure 3. Note that the Pacific area includes the warm pool which Magaña et al. (1999) cite as an integral feature in the climatology of southern Mexico and Central America. The SST data also are based on an analysis of COADS by Kaplan et al. (1998) and they too are available in electronic format (IRI/LDEO, 2000).
2b. Methods
This study uses Principal Component Analysis (PCA) as the basic tool to define the regional structure of summer rainfall in Mexico. There are several different variations of the PCA model; Richman (1986) provides an excellent review of PCA focusing on different PCA-strategies that have been used in meteorology and climatology. Examples of PCA applied to precipitation data can be found in Richman and Lamb (1985); Englehart and Douglas (1985); Mallants and Feyen (1990); and Comrie and Glenn (1998). This study's particular PCA approach uses monthly data, June through September, where individual station data are first expressed as a percentage of their long-term monthly mean (1941-1980). Thus, the explicit seasonality and elevation influences are removed from the "raw" monthly totals. All of the available data for the period 1927 to 1997 are applied in an S-mode PCA (multiple stations over time). The PCA is based on a correlation matrix with pairwise deletion. Note that for any two stations with no months of missing data, the correlation would be calculated on 284 data pairs (4 months x 71 years). The underlying data recovery rate for the grid (Fig. 2) translates into an average of 269 data pairs per correlation or almost 95% of the maximum (284) value.
For this study the decision was made to present the principal components of summer rainfall derived from an oblique rotation - Direct Oblimin with the obliquity parameter δ = 0. The use of an oblique rotation runs counter to convention as most examples of rotated principal components (PCs) applied to geophysical data are based on the orthogonal Varimax procedure. However, our approach is similar to that used by Comrie and Glenn (1998) who suggest that oblique rotations generally are more effective in climate regionalization exercises. This choice (oblique rotation) is also consistent with the results of Monte Carlo simulations presented by Richman (1986). The decision about number of PCs to retain for rotation was based largely on the eigenvalue separation criterion outlined by North et al. (1982). The spatial form of the rainfall regions was determined by plotting the rotated loading patterns with a loading value of 0.45 selected as the criterion for delimiting regional boundaries. In turn, monthly and seasonal time series for each region were constructed by simply averaging the rainfall data (expressed as percentage of long-term normal) for all stations located within the region boundaries.
The atmospheric indices - RP and SLP - described earlier were also subjected to PCA with oblique rotation. In this instance, we use the dimensionless time coefficients (zero mean, unit variance) derived from the PCA to represent the temporal behavior of the atmospheric indices.
As noted earlier, this paper focuses partly on the interdecadal PDO signal and the influence it may have on the teleconnectivity of summer rainfall in Mexico. The long-period behavior of the PDO is illustrated in Figure 4. The indicated shift points in PDO regimes - 1925, 1947, and 1977 - are the same ones designated by Mantua et al. (1997) and adopted by Gershunov and Barnett (1998) in their analysis of PDO-modulated teleconnections. Based on these shifts, our period of record (1927-1997) is divided into two subsets: 1) positive phase PDO 1927-46 and 1977-97 for n=41 total years; and negative phase PDO (1947-76) for n=30 years. Note that the data for continental ridge position (RP) are available only from 1929 so for correlations involving this index the positive PDO subset contains n=39 cases. Teleconnections between regional rainfall and different indices of large-scale climate variability are calculated separately for each subset; the level of teleconnectivity is expressed in terms of the familiar Pearson correlation coefficient (r).

Statistical significance of the coefficients is evaluated on two bases. The first is the classical t test with n-2 degrees of freedom. Assuming serially independent observations the 95% significance level corresponds to correlations of | 0.30 | (n=41); | 0.32 |(n = 39); and | 0.36 | (n = 30). The second evaluation is based on a permutation testing procedure (Edgington, 1995). In brief, the test goes as follows. For any two variables, the n=71(n=69 for RP) data pairs in the record are randomly assigned to either subset A (n=41; or n=39) or subset B (n=30). Separate correlations are calculated for each subset as well as the difference between correlations (A-B). The process is repeated 1000 times to form empirical cumulative distribution functions (cdfs). Next, the actual sample correlations (and the difference) stratified by PDO regime - the positive regime (1927-46 and 1977-97) versus the negative regime (1947-76) - are compared against the empirical cdfs. If a sample value lies beyond the 95th percentile of its corresponding empirical cdf then it is judged to be statistically significant.
3. Results
3a. Regional rainfall modes
Applying the PCA approach outlined above, Mexico's summer rainfall is delimited into five spatially coherent regions. The number of regions follows from the eigenvalue separation test proposed by North et al. (1982). These test results are presented in Figure 5 as a plot of eigenvalue (λ) versus mode number for the unrotated PCs. Note the distinct break between modes 5 and 6. The inference here is that the first five modes encompass the large-scale spatial variability in Mexico's summer rainfall while the remaining modes describe progressively smaller-scale variations. In total, the five dominant modes account for 38.1% of the field variance.

Figure 6 presents the spatial patterns for the five dominant modes. As noted earlier, each region is defined to include all stations with loading values ≥ 0.45. In general terms, the regional structures are distinct and physically reasonable with respect to the climatology of Mexico. For example, Region 1 represents the core of the country's summer monsoon. Within its boundaries seasonal rainfall exhibits comparatively little interannual variability in relationship to total amount. In other words, the coefficient of variation (CV) for regional rainfall is low (Mosiño and García, 1974). Likewise, Region 3 corresponds to the area usually characterized as the core of the North American Summer Monsoon System (NAMS). It includes the lowlands, foothills, and western flank of the Sierra Madre Occidental extending from Nayarit northward through Sinaloa and Sonora (Reyes et al., 1994).
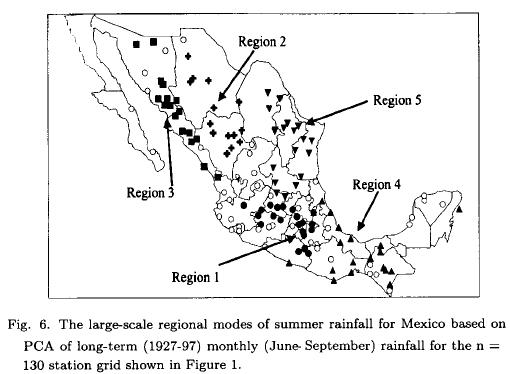
As defined, the five regions include 90 of the grid's 130 stations. For those stations outside the regional boundaries much of the variability in monthly rainfall apparently occurs at smaller, more localized space scales. Part of this variation probably is local "noise" - unique influences tied to factors such as individual station siting or measurement and transcription errors in archived rainfall data. Still, based on Figure 6 it seems evident that some spatial patterning exists even for the stations that are not in one of the five regional modes. More specifically, there appear to be three separate clusters of coastal or near-coastal stations. The first of these sub-regional scale groupings occurs in the area from southern Nayarit and western Jalisco southward through Colima, and from there it presumably extends into western Michoacan and northwestern Guerrero. The second cluster is found in Chiapas near the Gulf of Tehuantepec, while the third one is located mainly in the coastal zone of Campeche and Yucatan. A rigorous explanation for why these areas do not enter into the main regional modes is outside the scope of this study. However, given that all of these stations are located fairly close to areas of high tropical storm activity, a reasonable line of speculation would be that their monthly rainfall data reflect the impact of extreme rainfall events associated with nearby tropical storm passages. The PCA is based on correlation coefficients and it is well known that correlations are sensitive to extreme values. If extreme rainfall from individual tropical storm events is confined locally to just a few stations in the grid, then these stations would be spatially out-of-phase both with surrounding stations and with the larger regions. In turn, the net result would be reduced spatial coherence, that is, lower correlation between the affected stations and the remainder of the grid.
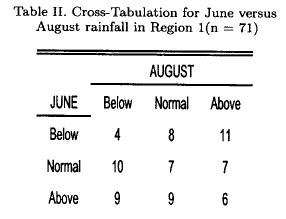
To evaluate the temporal variability in regional rainfall, several different statistics were calculated. As one example, Table I shows the tendencies toward intraseasonal persistence in monthly rainfall as defined by correlation coefficients. Note that the table lists only those combinations of months and regions in which r is considered statistically significant at the 90% level assuming serial independence. Month-to-month persistence in rainfall is seldom strong enough to be of great value in the preparation of extended-range forecasts (Douglas and Englehart, 1985). Certainly this is true in the present context as at best, the regional series exhibit only modest levels of persistence. Nonetheless, the correlations in Table I hint at some interesting properties in the regional rainfall series. Take for example the significant correlation (r =0.34) between June and July rainfall in Region 3. This finding implies that a vigorous and early start in the northwest monsoon tends to favor the continuation of above normal rainfall into July. Of course, because r is linear the result also implies the opposite condition - a delayed and poor start favors below normal rainfall in July. The values in Table I also suggest a broad tendency for positive persistence in August to September rainfall across much of eastern and southern Mexico (i.e., Regions 1, 4, and 5). Perhaps the most interesting feature in Table I is the negative correlation for June to August rainfall in Region 1. Granted, the relationship is weak, but one still could argue that in part, what it reflects is a tendency for amplification of the favored climatological mode - the mid-summer drought or la canícula - described by Magaña et al. (1999). In other words, above normal June rainfall in Region 1 tends to be associated with drier than normal conditions in August. Table II provides a more refined view of this possibility. It shows a cross-tabulation of the two series, where the rainfall distributions are divided into three roughly equal categories - above, normal, and below normal rainfall. Somewhat surprisingly, these results suggest that any power in the relationship actually comes from the opposite side, that is, below normal rainfall in June tends to be associated with above normal amounts in August.

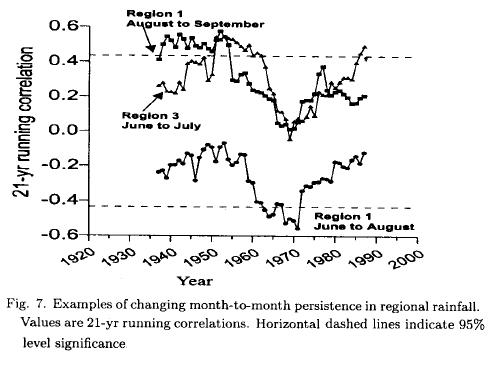
There is another reason why rainfall persistence relationships typically have limited value in extended range forecasting. It is that the relationships often lack temporal stability. In the present context, the problem is well illustrated by the 21-yr running correlations shown in Figure 7. Based on these results, it is evident that the strength of the persistence relationships varies widely over the historical records. For example, significant persistence in Region 1's August to September rainfall is confined to the period prior to the mid-1960s, while June to July persistence in Region 3 apparently was in effect largely from the early-1940s through the mid-1970s.
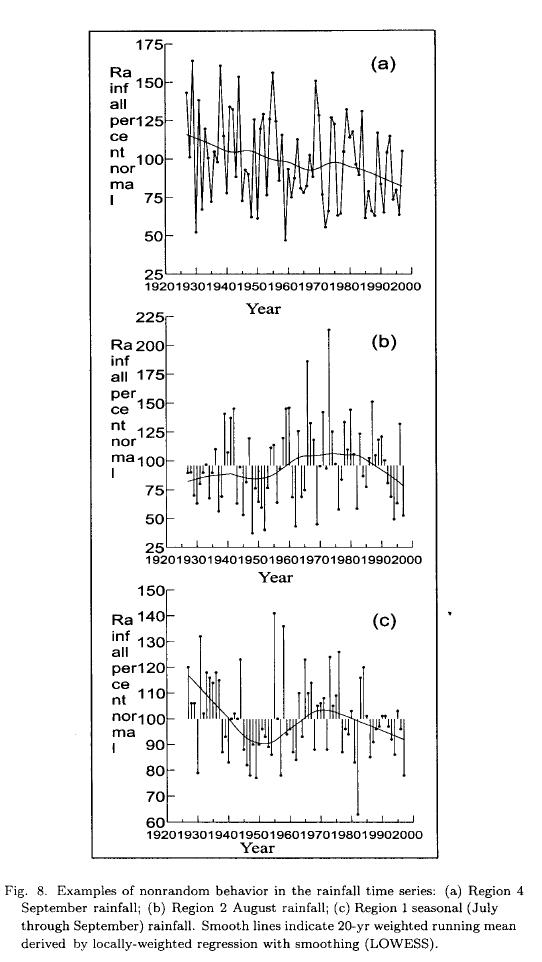
The monthly and seasonal (July - September) rainfall series also were evaluated for the presence of monotonic trend, that is, systematically increasing or decreasing rainfall over the period of record. Trend was evaluated using Daniel's test (Farnum and Stanton, 1989). The test is simply the Spearman rank order correlation between the subject series, in this case monthly or seasonal rainfall, and time (year). Based on this test statistic, none of the seasonal series exhibit significant trend while only three of the monthly rainfall series exhibit any significant trend: Region 3 (northwest Mexico) June rainfall; Region 4 (southern Mexico) August rainfall; Region 4 September rainfall. Figure 8a provides an illustration - it shows the relatively pronounced negative trend in the September rainfall in Region 4. Fig. 9. Subtropical anticyclone indices - mode 1(SAI1) and mode 2 (SAI2) - as derived by PCA of the two SLP series and two RP series: [a] mode 1 spatial pattern; [b] mode 1-time series (1929-1999); [c] mode 2 spatial pattern; and [d] mode 2 time series. Smooth lines indicate 30-yr weighted running mean derived by locally-weighted regression with smoothing (LOWESS). The monthly and seasonal rainfall series also were analyzed for nonrandom serial behavior with a more general test - the runs test (Farnum and Stanton, 1989). On this basis, only two time series were judged to have significant nonrandom behavior - August rainfall in Region 2 (Fig. 8b) and the seasonal rainfall (July - September) in Region 1(Fig. 8c).
3b. Teleconnectivity of regional rainfall
Section 1 introduced the notion that the observed interdecadal shifts in the PDO could be associated with significant changes in the teleconnectivity between regional rainfall and different indices of ocean and atmosphere variability. Section 2 outlines the data and the methods used to test this idea. This section describes the results of the investigation. The analysis is based on seasonal rainfall for July - September. This particular season was selected simply because it represents the period of strongest teleconnections between regional rainfall and the other climate indices.
Prior to presenting the actual teleconnection results, it is first necessary to note the results obtained by application of PCA to the atmospheric variables - the SLP and RP time series described in Section 2a. These results are summarized in Figure 9. The atmospheric variables align into two main modes that together account for about 68% of the total field variance. Mode 1 (Fig. 9a) emphasizes variability in the position of the continental anticyclone with the downstream Atlantic SLP exhibiting anomalies of the opposite sign. The great drought, the 1930s Dust Bowl era in the United States, dominates the mode 1 time series. During this period the continental anticyclone was displaced far north of its normal position and expanded to include much of the US. The time series (Fig. 9b) reflects comparatively minor peaks for both the US drought regime of the 1950s and for the intermittent droughts of the 1980s (1983, 1984 and 1988). Mode 2 (Fig. 9c) emphasizes the North Pacific SLP but it also includes contributions from the more eastern RP (95°W) and from the Atlantic SLP. Unlike in mode 1, the three centers are in phase so that downstream from a stronger (weaker) than normal North Pacific high, RP at 95°W tends to be displaced north (suppressed south) with the Bermuda high also stronger (weaker) than normal. Probably the most coherent feature of the corresponding time series (Fig. 9d) is the tendency toward positive amplitudes that occurs from about the mid-1940s through the mid-1950s.
The basic results of the teleconnection study are summarized in Figure 10. It shows, for each of the five rainfall regions, the correlations between seasonal rainfall and one of the five climate indices stratified by PDO phase. Figure 10a presents the teleconnections with the ERI, the study's ENSO index. From this display it is clear that the teleconnections between ENSO and regional rainfall are skewed to the positive phase of the PDO. In this phase, El Niño (La Niña) favors below (above) normal seasonal rainfall. Based on the permutation testing procedure outlined in Section 2b, the phase-dependent strength of the teleconnections, that is, the difference in r between phases, is significant at the 95% level for Regions 1, 4, and 5 (central, southern, and eastern Mexico, respectively). As an illustration of the permutation procedures, Figure 11 shows the test results for the Region 1 correlations.
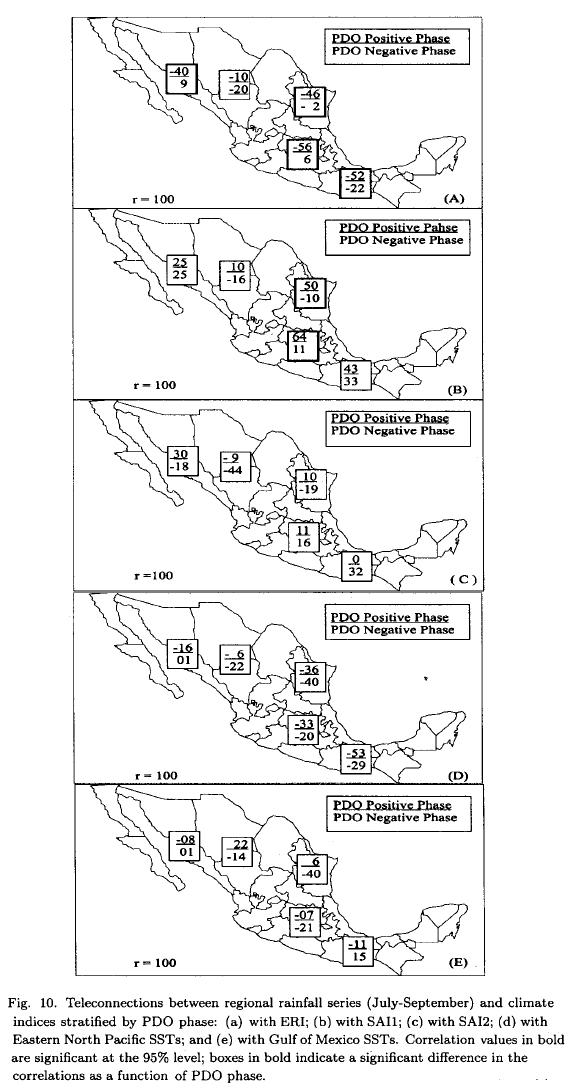
The teleconnection between ENSO and rainfall in southern Mexico (i.e., Region 4) is reasonably well documented (Douglas and Englehart, 1998). However, what is perhaps the most surprising feature of Figure 10a is simply that it demonstrates a spatially extensive set of ENSO teleconnections. Four of the five regions have significant correlation with the ERI; albeit the relationships are confined to the positive phase of the PDO. Only in Region 2, largely the altiplano extending from Durango into Chihuahua, does rainfall fail to correlate with the ERI.
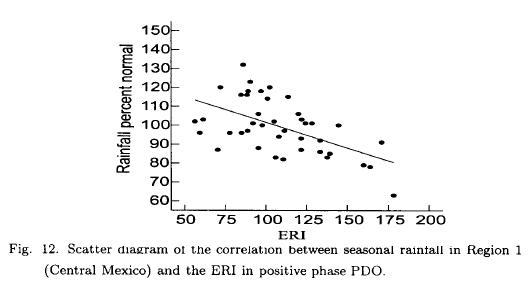
Gershunov and Barnett (1998) provide evidence that ENSO-PDO interactions can produce non-linear behavior in the winter teleconnections over the North Pacific Ocean and the United States. Specifically, they suggest that El Niño-type signals are strong and stable only during positive phase PDO while well-developed La Nia-related signals are restricted to the negative phase PDO. In contrast, our evaluation of ENSO teleconnections with Mexico's summer rainfall provides little evidence of non-linear behavior within PDO phase. This point is illustrated in Figure 12 which shows the scatter diagram of Region 1 rainfall versus the ERI during the positive phase PDO. Here, it is apparent that both La Niña (low ERI) and El Niño (high ERI) conditions contribute to the strength of the observed correlation. Comparable behavior is also evident in the positive PDO phase teleconnections between the ERI and the other regional rainfall series.
The teleconnections between rainfall and the two anticyclone indices (i.e., Figure 9) are provided in Figures 10b and 10c. Recall that mode 1 (SAI1) describes the position of the continental anticyclone with SLP anomalies of the opposite sign in the western Atlantic. Just as for the ERI these teleconnections also are skewed to the positive PDO phase. When both the PDO and SAI1 are in positive phase - an expansive continental ridge displaced northward with a weaker than normal Bermuda High - conditions favor above normal rainfall through central, southern, and eastern Mexico (i.e., Regions 1, 4, and 5). Of course, the correlations imply linear behavior so that for a positive phase PDO and a negative phase in SAI1, these same regions tend to see below normal rainfall. On a physical basis, the relationships are plausible. They imply that easterly wave activity contributes substantially to Mexico's summer rainfall, and that at least under positive phase PDO, this activity is modulated by the position of the continental anticyclone. It is worthwhile to note that we evaluated the sensitivity of the teleconnections to the extremely strong anomalies found in the early portion of the SAI1 time series - the Dust Bowl era of the 1930s in the United States. Specifically, the cases from 1929 through 1936 were removed from the analysis and the correlations were recalculated. The resulting values were lower, however, they were still significant at the 95% level. In this trial, the correlation between SAI1 and rainfall in the northwest monsoon area (Region 3) actually increased from r = 0.25 to r = 0.42. It can be argued that this difference also is reasonable as the powerful and extensive anticyclones of the 1930s probably favored anomalous northeasterly winds over the area. Assuming this characterization is valid, the net result would be reduced moisture transport in the mid-troposphere. However, under less extreme conditions, that is, outside the 1930s, the correlation between Region 3 and SAI1 then implies that the region's rainfall activity is positively linked to the position of the continental anticyclone, at least during positive phase PDO.
The teleconnections between regional rainfall and the mode 2 index (SAI2) of atmospheric variability (Fig. 10c) are considerably weaker than for SAIL During the positive PDO phase, Region 3 rainfall exhibits a weak positive correlation with SAI2 while in the negative PDO phase, SAI2 exhibits a comparatively strong negative correlation with rainfall in the altiplano (Region 2). In other words, for negative phase PDO it appears that in this region, rainfall actually is inhibited (enhanced) by displacement of the continental anticyclone to the north and east (south and west). Presumably the physical grounds for the connection would be similar to those suggested above as operating in the 1930s for SAI1 versus Region 3 rainfall. The teleconnections between regional rainfall and near-field SSTs are presented in Figure 10d (Eastern Pacfic warm pool) and Figure 10e (Gulf of Mexico). In their climatological analysis, Magaña et al. (1999) detail the integral role that the Eastern Pacific warm pool plays in the seasonal evolution of rainfall regimes for southern Mexico and Central America. Similarily, the work by Yu and Wallace (2000) puts SSTs in this area near the spatial center of the large-scale North American Monsoon System (NAMS). Based on these studies it is reasonable to assume: 1) a strong (weak) NAMS is associated with enhanced (reduced) convective activity in the vicinity of the warm pool; and 2) the levels of convective activity (cloudiness) influence insolation at the surface and thus SSTs in the warm pool. Working with the short period of available satellite measurements (1979-97), Yu and Wallace indicate that their large-scale NAMS index is strongly correlated with local rainfall only over southwestern Mexico. In contrast, the negative correlations in Figure 10d suggest a much more spatially extensive connection between warm pool SSTs, the NAMS, and regional rainfall. Note that in comparison to the ERI and SAI1 teleconnections, the relationships between warm pool SSTs and rainfall are not as strongly skewed to the positive PDO phase.
While the teleconnections with the Eastern Pacific warm pool apparently occur at fairly large-scales, Figure 10e indicates a more local connection between Gulf of Mexico SSTs and regional rainfall. Northeast Mexico (Region 5) is the only area that exhibits significant correlation with Gulf SSTs, and this correlation holds only in the negative PDO phase. In part, the connection may reflect the same physical mechanisms suggested above - enhanced (reduced) convective activity produces lower (higher) insolation and consequently lower (higher) SSTs.
4. Discussion and conclusions
This paper purposely adopts a broad-brush perspective to the inherent complexities of summer rainfall over Mexico. It applies the statistical technique of PCA to an assemblage of historical (1927-97) rainfall data from 130 stations that are distributed in fairly uniform fashion across the country. Based on this approach the study delimits five relatively large sub-areas of the country. Within each of these regions, monthly station rainfall exhibits high levels of spatial coherence. Clearly, the definition of regional structures can change depending upon factors such as the length of record for analysis, the particular distribution of stations, and the specific technical criteria used in the analysis. With these considerations in mind, what this study presents are large-scale regional structures that are distinct and physically reasonable with respect to the climatology of Mexico.
In terms of comparing this study's regional patterns with other work, there are only a few studies available where PCA has been used to derive regional rainfall patterns that include Mexico. Comrie and Glenn (1998) present one regionalization based on a domain that covers much of the southwestern United States (south of about 40°N) and includes data from stations in northern Mexico (north of about 20°N). In previous work (Douglas and Englehart, 1997), we used PCA to delimit rainfall regions for an even broader domain - the continental United States and Mexico. With respect to Mexico, the regional patterns derived in these other efforts differ substantially from the ones advanced here. In the case of our earlier work, it is likely that the pattern differences partly reflect scale differences in the base data. More specifically, rather than individual station data as in the present context, our previous PCA used a grid of divisional rainfall data where each individual point actually represents a spatial average of rainfall taken from about 15 closely-spaced stations. By their construction, the divisional averages tend to both smooth regional patterns and to emphasize only the largest scales of spatial variation. For Mexico, the summary result of using divisional data was that the PCA yielded only two or three main regions as opposed to five in the present study. There is one point where the two analyses converge. That is, both show the coastal areas of Campeche and Yucatan as possessing no significant intercorrelation with other parts of the country.
The regionalization by Comrie and Glenn (1998) also uses individual station data so in this sense at least, their results are more appropriate for comparison against this study's patterns. Both studies are in reasonable agreement on the boundaries of the region in northeast Mexico. Where they differ substantially is in northwest Mexico. Based on their analysis, Comrie and Glenn depict a single large region that apparently extends from Jalisco northward through Durango and Chihuahua and then also westward through most of Sinaloa and Sonora. In contrast, over roughly the same space, this study defines two separate regions: the core of the northwest monsoon (Region 3) and the drier altiplano (Region 2) to its east.
Section 3a noted some tendencies toward subregional-scale clustering of stations outside the main regional boundaries. If a higher density distribution of stations was available, then it is conceivable that one or more of these areas would be delimited either as an additional regional structure(s), or alternatively, they would exhibit sufficient spatial intercorrelation so as to attach to the already defined regions. For the existing station distribution we attribute the low spatial coherence of the problem areas partly to the impact of extreme rainfall events associated with tropical storm (TS) activity. In the case of the area extending southward from Nayarit and western Jalisco (see Fig. 6) this point is supported by related work (Englehart and Douglas, 2001) that is based on daily rainfall at 18 stations distributed over western Mexico. In this effort seasonal rainfall is partitioned into TS and non-TS components. These components then are expressed in terms of a statistic that reduces the influence of extreme rainfall - the number of days with measurable rainfall. Analyzed in this more conservative fashion, rainfall over the problem area exhibits significant spatial coherence on scales that compare favorably to those seen in the present study.
In keeping with its broad-brush view, this study presents teleconnctions between the regional rainfall time series and several different indices of large-scale ocean and atmosphere variability. Most of the stronger teleconnections occur in the positive phase of the PDO. However, in interpreting the study's results, it is important to recognize that the apparent differences in teleconnectivity between PDO phases are not directly associated with changes in rainfall level. In other words, we find no evidence for changes in mean rainfall amounts in the different regions depending simply upon PDO phase. This point can be illustrated with reference to the Region 1 seasonal series (see Fig. 8c). Recall that this is the only seasonal series exhibiting the type of non-random behavior that one would expect to be associated with changes in mean rainfall level. In this case all the years from 1927-1936 (except 1930) have above normal rainfall. This regime is followed by a long period (1937-1961) of generally subnormal rainfall with a subsequent turn toward a wetter regime from the early 1960s through the early 1970s. Obviously, these changes do not align neatly with the regime break points (1947 and 1977) of the PDO.
The results clearly support the idea that interdecadal shifts in the PDO are associated with significant changes in teleconnectivitiy between Mexican rainfall and large-scale climate modes. In this global sense, the study results agree with some previous analyses that find teleconnection strength and stability changing as a function of PDO phase. However, there also are substantial differences between our findings and those cited in other investigations. For example, unlike Gershunov and Barnett (1998), within PDO phase we see little evidence of non-linear behavior in the ENSO teleconnection. Our results do indicate a clear preference for stronger ENSO teleconnections in the positive PDO phase. This finding runs counter to the analysis by McCabe and Dettinger (1999). They indicate that ENSO teleconnections with winter precipitation in the western United States are stronger in the negative PDO phase. Much of the difference in results may be ascribed to the simple fact that this study focuses on summer rainfall for Mexico while the other work deals with winter conditions over the United States. The results presented here do suggest that the phenomena of stronger correlation in the positive PDO phase is not restricted to the ENSO teleconnection. Although occurring on more limited space scales, this same tendency is evident in the teleconnections between regional rainfall and the dominant mode of variability in the summer anticyclones (see Fig. 10b).
In sum, this paper explores some of the long-term and large-scale variations in Mexico's summer rainfall. It obviously is an empirical effort and as such, the results that are presented depend somewhat upon the particular data sets and the techniques used in the analysis. In barest terms, the study presents two main results. First, it demonstrates that Mexico's summer rainfall aligns into five large-scale regions covering much though not all of the country. Second, it shows that the teleconnections between regional rainfall and large-scale climate modes generally are stronger in the positive PDO phase. Accepted at face value, these results have potentially important implications for statistically-based efforts at seasonal climate prediction. The fact that there are areas in Mexico where a significant portion of the seasonal rainfall variability occurs at smaller space scales, suggests that for these areas it may be more difficult to develop skillful prediction schemes. Similarily, the tendency toward stronger teleconnectivity in the positive PDO phase suggests that prediction methods must not only account for PDO phase, but also that the skill of statistical prediction may prove to be skewed to the positive phase. Of course it remains to be seen whether this study's particular set of results will remain applicable in the light of future climate variations. Regardless, this study's results underscore the point that a greater understanding of the inherent variability of Mexican rainfall, will require both more empirical/statistical work and dynamic modeling efforts.
Acknowledgements
This study was made possible only through the support of many people in Mexico's meteorological community. We would especially like to thank the following individuals for their time and efforts on our behalf: Dr. Alberto Jaime, Dr. Carlos Espinosa, Ing. Othon Cervantes, Ing. Alejandro González, Met. José Guadalupe Rosales, Lic. Oliva Parada, and M. C. Sandra Aguilar. Support for this work was provided by NOAA's Office of Global Programs under Grants GP0394 and GP0369.
REFERENCES
Banerjee, A. K., P. N. Sen, C. R. V. Raman, 1978. On foreshadowing southwest monsoon rainfall over India with mid-tropospheric circulation anomaly of April. Indian Journal of Meteorology, Hydrology, and Geophysics, 29, 425-431. [ Links ]
Comrie, A. C, E. C. Glenn, 1998. Principal components-based regionalization of precipitation regimes across the southwest United States and northern Mexico, with an application to monsoon precipitation variability. Climate Research, 10: 201-215. [ Links ]
Douglas, A. V., P. J. Englehart, 1985. An evaluation of seasonal precipitation forecasting: A look at the statistics and forecast tools. Preprints Ninth Conference on Probability and Statistics in the Atmospheric Sciences. American Meteorological Society: Boston, MA, 154-162. [ Links ]
Douglas, A. V., P. J. Englehart, 1997. Diagnostic studies of factors influencing variability in the Mexican monsoon. Proceedings of the Twenty-First Annual Climate Diagnostics and Prediction Workshop, Huntsville, AL. U.S. Department of Commerce, NOAA: Washington, DC, 296-299. [ Links ]
Douglas, A. V., P. J. Englehart, 1998. Inter-monthly variability of the Mexican summer monsoon. Proceedings of the Twenty-Second Annual Climate Diagnostics and Prediction Workshop, Berkeley, CA. U.S. Department of Commerce, NOAA: Washington, DC, 246-249. [ Links ]
Edgington, E. S., 1995. Randomization tests. New York: Marcel Dekker. pp. 201-209. [ Links ]
Englehart, P. J., A. V. Douglas, 1985. A statistical analysis of precipitation frequency in the conterminous United States, including comparisons with precipitation totals. Journal of Climate and Applied Meteorology, 24, 350-362. [ Links ]
Englehart, P. J., A. V. Douglas, 2000. Dissecting the macro-scale variations in Mexican maize yields (1961-1997). Geographical and Environmental Modelling, 4, 65-81. [ Links ]
Englehart, P. J., A. V. Douglas, 2001. The of Eastern North Pacific tropical storms in the rainfall climatology of western Mexico. International Jour. of Climatol., 21, 1357-1370. [ Links ]
Farnum, N. R., L. W. Stanton, 1989. Quantitative Forecasting Methods. PWS-Kent: Boston, MA, pp. 57-69. [ Links ]
Gershunov A., T. P. Barnett, 1998. Interdecadal modulation of ENSO teleconnections. Bulletin of the American Meteorological Society, 79, 2715-2725. [ Links ]
IRI/LDEO, 2000. IRI/LDEO Climate Data Library. [Online] Available HTTP <http://ingrid.ldeo.columbia.edu/SOURCES/.KAPLAN/> Accessed June 2000. [ Links ]
Kane, R. P., 1997. Relationship of El Nio-Southern Oscillation and Pacific sea surface temperature with rainfall in various regions of the globe. Monthly Weather Review, 125, 1792-1800. [ Links ]
Kaplan, A., M. A. Cane, Y. Kushnir, AC Clement, MB Blumenthal, B Rajagopalan, 1998. Analyses of global sea surface temperature 1856-1991. Journal of Geohysical Research, 103 (C9), 18567-18589. [ Links ]
Kaplan. A., Y. Kushnir, M. A. Cane, 2000. Reduced space optimal interpolation of historical marine sea level pressure, Journal of Climate, in press.
Magaña, V., C. Conde, O. Sánchez, C. Gay, 1997. Assessment of current and future regional climate scenarios for Mexico. Climate Research, 9, 107-114. [ Links ]
Magaña, V., J. A. Amador, S. Medina, 1999. The midsummer drought over Mexico and Central America. Journal of Climate, 12, 1577-1588. [ Links ]
Mallants, D., J. Feyens, 1990. Defining homogeneous precipitation regions by means of principal components analysis. Journal of Applied Meteorology 29, 892-901. [ Links ]
Mantua, N. J., S. R. Hare, Y. Zhang, J. M. Wallace, RC Francis, 1997. A Pacific interdecadal climate oscillation with impacts on salmon production. Bulletin of the American Meteorological Society, 78, 1069-1079. [ Links ]
Mantua N. J., 2000. Digital values of the PDO index. [Online] Available HTTP: <http://tao.atmos.washington.edu/pdo/>. Accessed January 2000. [ Links ]
McCabe, G. J., M. D. Dettinger, 1999. Decadal variations in the strength of ENSO teleconnections with precipitation in the western United States. International Journal of Climatology, 19, 1399-1410. [ Links ]
Mendoza, V. M., E. E. Villanueva, J. Adem, 1997. Vulnerability of basins and watersheds in Mexico to global climate change. Climate Research, 9, 139-145. [ Links ]
Mosiño, P. A., E. García, 1974. The climate of Mexico. World Survey of Climatology. Vol 11, Climates of North America. R. A. Bryson and F. K. Hare (editors). London: Elsevier 345-404. [ Links ]
North, G. R., T. L. Bell, R. F. Cahalan, F. J. Moeng, 1982. Sampling errors in the estimation of empirical orthogonal functions. Monthly Weather Review, 110, 699-706. [ Links ]
Reyes, S., M. Douglas, R. Maddox, 1994. El monzón del suroeste de Norteamérica (TRAVASON/SWAMP). Atmósfera, 7, 117-137. [ Links ]
Richman, M. B., P. J. Lamb, 1985. Climatic pattern analysis of three- and seven-day summer rainfall in the central United States: Some methodological considerations and a regionalization. Journal of Climate and Applied Meteorology, 24, 1326-1343. [ Links ]
Richman, M. B., 1986. Review article: rotation of principal components. Journal of Climatology, 6, 293-335. [ Links ]
Ropelewski, C. F., M. S. Halpert, 1986. North American precipitation and temperature patterns associated with the El Niño/Southern Oscillation (ENSO). Monthly Weather Review, 114, 2352-2362. [ Links ]
Ropelewski, C. F., M. S. Halpert, 1987. Global and regional scale precipitation patterns associated with the El Niño/Southern Oscillation. Monthly Weather Review, 115, 1606-1626. [ Links ]
Walker, G. T., 1923. Correlation in seasonal variations of weather, VIII: a preliminary study of world weather. Memoirs of the Indian Meteorological Department. 24 (9): 75-131. [ Links ]
Wright, P. B., 1979. Persistence of rainfall anomalies in the central Pacific. Nature, 277, 371-374. [ Links ]
Yu, B., J. M. Wallace, 2000. The principal mode of interannual variability in the North American monsoon system. Journal of Climate, 13, 2794-2800. [ Links ]

