


Services on Demand
Journal
Article
 English (pdf)
 Article in xml format
 Article references
 Send this article by e-mail
Indicators
-
 Cited by SciELO
 -
 Access statistics
Related links
-
 Similars in
SciELO
Similars in
SciELO
Share

 Permalink
Atmósfera
Print version ISSN 0187-6236
Atmósfera vol.14 n.4 Ciudad de México Oct. 2001
Study of winter aerosol optical depths over a tropical urban station
R. S. Maheskumar, P. C. S. Devara, G. Pandithurai, P. Ernest Raj and K. K. Dani
Physical Meteorology and Aerology Division, Indian Institute of Tropical Meteorology, Dr. Horai Bhabha Road, Pune 411 008, India
(Manuscript received April 3, 2000; accepted in final form January 23, 2001)
RESUMEN
En Pune (18°32'N, 73°51'E, 559 m sobre el nivel del mar) una estación urbana tropical en India, exhibe las características del aerosol durante la temporada invernal, rasgos únicos tales como inversiones someras y formación de bruma seca, durante las horas de la mañana. Más aún, esta estación experimenta una abundancia de aerosoles de tamaño inferior a una miera debido al paso de las masas de aire continentales. Con objeto de examinar estas propiedades invernales de los aerosoles en detalle, el radiómetro de alta resolución expectral, basado en Pc, ha sido operado en la gama de longitud de onda de 0.4 a 0.7μm en el Instituto de Meteorología Tropical de Pune, India. Los detalles del espectrorradiómetro, junto con los procedimientos de adquisición de datos y análisis han sido brevemente descritos. En este trabajo, los resultados obtenidos a partir de las observaciones llevadas a cabo en 75 días despejados durante los inviernos consecutivos de 1993 a 94, 1994 a 95 y de 1995 a 96, han sido presentados y discutidos, en vista de las condiciones meteorológicas y ambientales locales. De los tres inviernos considerados en el estudio, las profundidades ópticas del aerosol durante el invierno 1995-96 indican mayores valores y el espectro de tamaños muestra una distribución bimodal, sugiriendo la influencia dominante combinada del transporte de los aerosoles continentales y el atrapamiento de los mismos generados en la superficie, debido a la inversión somera, durante la temporada sobre la estación experimental.
ABSTRACT
At Pune (18°32'N, 73°51'E, 559 m AMSL), a tropical urban station in India, aerosol characteristics during the winter season exhibit unique features such as low-level inversions and dust haze formation during morning hours. Moreover, this station experiences abundance of sub-micron sized aerosols due to passage of continental air mass during winter. With a view to examine these winter aerosol properties, in detail, the PC-based high spectral resolution radiometer has been operated in the 0.4-0.7μm wavelength region at the Indian Institute of Tropical Meteorology, Pune, India. The details of the spectroradiometer together with the data acquisition and analysis procedures have been briefly described. In this paper, the results obtained from the observations carried out on 75 cloud-free days during the successive winters of 1993-94, 1994-95 and 1995-96 have been presented and discussed in the light of local meteorological and environmental conditions. Of the three winters considered for the study, aerosol optical depths during the 1995-96 winter indicate greater values and forenoon aerosol size spectra exhibit bimodal distribution suggesting the dominant combined influence of transport of continental aerosols and trapping of surface-generated aerosols due to close-to-ground inversion during the season over the experimental station.
1. Introduction
Atmospheric aerosols can be considered as an important part of the Earth-atmosphere climate system, since they interact with both incoming solar short wave (SW) as well as the outgoing terrestrial long wave (LW) radiation. They possess high degree of variability in both space and time in their origin, number, size distribution and composition. Even though the naturally originated aerosol particles dominate the anthropogenic component, the latter causes a direct negative (cooling) radiative forcing of about 1.0 - 2.0 Wn–2 in the SW radiation (Harshvardhan, 1993).
Active as well as passive optical remote sensing techniques have been extensively used from different experimental platforms to monitor the atmospheric aerosol characteristics under different environmental conditions. In the passive techniques such as sunphotometers, the information is generally obtained at discrete wavelengths using interference filters whereas spectroradiometers which employ diffraction gratings provide aerosol extinction (optical depth) of solar radiation over specified spectral bands with reasonably good resolution in much shorter observation time. The main advantage of spectroradiometers over sunphotometers or conventional photometers is the possibility of obtaining continuous information on aerosol optical depth at narrow spectral intervals (as per the experimental requirement), so that fine-scale variations in the spectral characteristics of aerosols can be studied. Furthermore, such information over a wide wavelength region serves as an useful input for the retrievals of reasonably accurate aerosol size distribution.
A high spectral resolution radiometer (spectroradiometer), which measures the extinction of direct solar radiation continuously over the wavelength region from 0.4 to 0.72 μm has been in regular operation since 1993 at the Indian Institute of Tropical Meteorology (IITM), Pune, an urban station in India, to study the atmospheric optical depth spectrum between the wavelengths, 0.4 and 0.7 μm. Some interesting features of aerosols over the Pune region from the multi-spectral measurements of aerosol optical depth (AOD) have been reported recently (Devara et al., 1996; Pandithurai et al., 1997). Aerosol optical depth (total column aerosol loading) can also be used to specify other aerosol characteristics, pollutant gas concentration, surface visibility and atmospheric turbidity to the extent that they are inter-related (Uthe et al., 1980).
At Pune, the monthly mean aerosol optical depths during the winter season (November, December, January and February) exhibit minimum values due to weak generation and growth mechanisms, and gas-to-particlc conversion processes. Furthermore, a large number of sub-micron aerosol particles originating from continental air mass passes over this station. Low-level inversions during the morning and evening hours and dust haze during the morning hours occur during this season. Thus close-to-ground inversion layers inhibit, the dispersion of aerosol pollutants formed due to surrounding anthropogenic activities during the previous nights. In order to study these important interesting winter aerosol characteristics, in detail, the spectroradiometric observations that have been carried out on almost all the available cloud-free days during the winters 1993-94, 1994-95 and 1995-96, at Pune have been analyzed and the results are discussed in this paper.
2. Measurement programme
The spectroradiometer used in the present study composed of a SPEX model 1680B double monochromator equipped with holographic gratings (1800 grooves / mm), a Peltier-cooled photomultiplier tube (PMT), an on-line data acquisition / processing system and an automatic Sun tracker to bring the solar radiation into the entrance slit of the spectroradiometer. After passing through the monochromator, the radiation is focused onto an EMI Model 9659 QB, S-20 cathode PMT. The output of the PMT is passed through a discriminator to enhance the signal-to-noise ratio and further amplified by a low-noise, variable gain FET input amplifier. The amplified signal is digitized using a 12-bit analog-to-digital converter Model 7880. The data are acquired by a mini computer. Complete system has been installed on the terrace of the Institutes building which is about 12 m high above the ground level, in order to avoid the obstructions due to surrounding tall topographic objects while tracking the Sun. A detailed description of the spectroradiometer, its calibration and data retrieval procedures and inter-comparison with sunphotometer have been published elsewhere (Devara et al., 1995).
The experiment was conducted minimum once and maximum five days in a week on clear-sky days between 0700 and 1800 LST. In order to remove the background noise from the observed spectrum, noise and signal plus noise values were recorded separately and the average value of the background noise was subtracted from each value of the signal plus noise spectrum to get the signal spectrum. The spectroradiometer was allowed to scan the solar irradiance in the 0.4 - 0.72 μm wavelength region at a rate of 0.005 μm/s. Such data archived at 0.05 μm interval during the three consecutive winters (1993-94, 1994-95 and 1995-96) were considered in the present study.
3. Estimation of AOD and aerosol size distribution
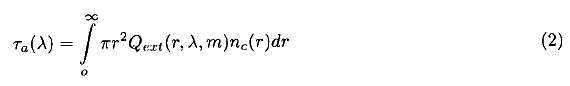
The optical depth due to extinction by atmospheric aerosol particles is an important parameter that affects the Earth's radiation budget and the satellite remote sensing. It is a measure of the total extinction caused by aerosols contained in a unit vertical column of the entire atmosphere to radiation at a wavelength (λ) incident normally on it, and is generally denoted by τα(λ). If I0(λ) is the intensity of the radiation above the Earths atmosphere and I(λ) at the ground, then the total optical depth τ(λ) connects I(λ) and I0(λ) through Beer-Lambert-Bouguer law,

where m is the optical air mass and τ(λ) = τα(λ) + τ(R)(λ) + τg(λ) , τ(R)(λ) and τg(λ) are the molecular and gaseous optical depths, respectively. The methodology used to obtain AOD from the total optical depth has been explained by many researchers (Devara et al., 1996; Pandithurai et al., 1997; Shaw et al., 1973; King et al., 1978; King, 1982; Krishna Moorthy et al., 1980).
The various effects of aerosols are highly dependent on their size distribution. Aerosol size distribution can be inverted from the spectral variation of AOD by following the constrained linear inversion scheme (King et al., 1978; King, 1982) with the Fredh'olm integral as
where r is the particle radius, m is the complex refractive index of aerosol particles, Qext(r, λ, m) is the Mie extinction efficiency parameter and nc(r) is the columnar size distribution. Since n(r) cannot be written analytically, a numerical approach is followed to separate nc(r) into two parts as nc(r) = h(r).ƒ(r), where h(r) is rapidly varying function with r and ƒ(r) is slowly varying. Hence the above equation changes to
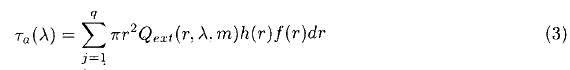
In the above equation, the quadrature error will be less if ƒ(r) is assumed to be constant. In that case, a system of linear equations results, which may be written as

where
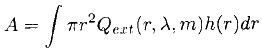
and ε is an error which arises due to deviation between the measured τα and theoretical τα (= ∑ A𝑖𝑗ƒ𝑖). Initially, Junge exponent (v) is computed from the wavelength dependence of aerosol optical depth and used as zero-order weighting function h°(r). By using h°(r) as an initial guess, first order ƒ(1) values are evaluated using the equation

where γ is non-negative Lagrangian multiplier and Sε is the measured covariance matrix, H is a mean diagonal matrix and superscript T denotes matrix transposition. This iteration procedure is repeated till the observed τα comes closer to the re-computed τα.
4. Results and discussion
The spectroradiometer data, archived on individual experimental days, are grouped into three classes viz., full day (FD), forenoon (FN) and afternoon (AN) with respect to the local noon (i.e. the time at which the air mass is minimum). All these datasets are analyzed separately by employing the procedure discussed in the earlier section. The AODs obtained on all observational days (FD, FN and AN) during each month are averaged and monthly mean AODs thus obtained are used to construct the optical depth versus wavelength plot for each month at every 0.05 μm wavelength interval. Columnar size distributions are obtained by inverting these multi-spectral optical depths by employing the linear inversion technique as explained in the previous section.
4.1. Month-to-month variation of AOD and size distribution
Figure 1(a,b) depicts the spectral variation of mean AOD at every 0.05 μm interval and the corresponding size distribution for the month of November (FD) during the years, 1993-94, 1994-95 and 1995-96. In Figure(1a) the striking feature is that with increase in wavelength the AOD decreases (negative curvature) in all the three years, and also 1995 AODs are higher as compared to those in other two winters. From Figure(1b) it can be seen that 1993 size distribution is almost like monomodal distribution. The size distributions during 1994 and 1995 exhibit power-law type distribution with different exponents changing at an intermediate size. These can be approximated by combining the two power-law distribution functions with different exponents, ν1 and ν2 for r < r0 and r > r0 respectively in the form,
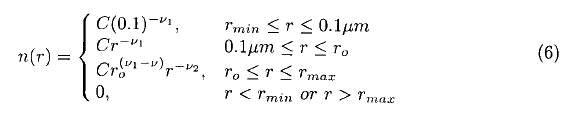
Figure 1(c,d) shows the wavelength dependence of AOD and corresponding inverted size distributions for the month of December (FD) in all the three years. Like in November 1993, the AOD decreases with increasing wavelength and the size distribution tends to become monomodal. In 1994 and 1995, although the AOD variations are almost similar, the size distributions are different, i.e. bimodal distribution in 1994 and power-law type distribution in 1995. Figure 1(e,f) depicts the wavelength dependence and corresponding size distributions for January (FD). Here, the wavelength dependence of AOD is almost similar as in the month of November with initial rapid decrease and increase at the end of the spectrum in all the three years. In the case of size distribution, 1994 and 1995 data show two-slope type while 1996 shows a power-law type distribution. Figure 1(g,h) displays the wavelength dependence and corresponding size distribution for the month of February for (FD). It is evident that the AOD variations (i.e. decrease with increase in wavelength) are similar in 1994 and 1995 but in 1996, AOD shows an initial decrease followed by an increase and decrease with wavelength finally. In size distributions also, both 1994 and 1995 show bimodal while 1996 shows a power-law type distribution.
The spectral variation of AOD and the associated aerosol size distribution for the FN period of November month are shown in Figure 2(a,b). From figure 2(a), initial decrease followed by increase of AOD in the spectrum (positive slope) is evident. The corresponding size spectrum shows bimodal distribution (Fig. 2(b)). Figure 2(c,d) shows these distributions for the FN period of December month. Here, except for 1994, in other two years AOD initially increases and afterwards decreases with increasing wavelength. The size distributions exhibit two-slope type in 1993 and power-law type in 1994, but in 1995 it changed to bimodal type distribution with a weak secondary peak. Figure 2(e,f) shows variations in AOD and size distributions for the FN period of January month. FN values are not available in 1995 due to unfavorable sky conditions. In both the years, 1994 and 1996, the AOD, on an average, decreases with increase in wavelength. The size distribution shows bimodal in 1994 and power-law type in 1996. Figure 2(g,h) depicts such variations for the FN period of February month. Except for 1995, AOD initially decreases, increases at intermediate wavelengths and finally decreases with wavelength. In 1995, it decreases initially and thereafter increases with wavelength. The corresponding size distributions show power-law type in 1994 and bimodal type distribution in 1995 and 1996.
Figure 3(a,b) portrays the spectral variation of optical depth and size distribution of aerosols for the AN period of November month. AOD is found to decrease with increase in wavelength for all the three years. The size spectra for 1993 and 1995 show two-slope type distribution while that in 1994 shows a simple power-law type distribution. Figure 3(c,d) shows these variations in the same period of December month. The unfavorable sky conditions prevailed in the afternoons of 1993 prevented from obtaining useful data. In 1994 AOD decreases with wavelength and the corresponding size distribution follows two-slope type. In 1995, AOD shows decrease initially and thereafter increase up to 0.6 μm and then decrease with wavelength. The inverted size distribution shows bimodal. Figure 3(e,f) depicts such variations for January AN period of the three years. Although the wavelength dependence AOD exhibits almost similar variations for all the three years, the size distribution shows power-law type in 1994 and 1996 and monomodal in 1995. Figure 3(g,h) is for the AN period of February month. Despite the variations in spectral dependence of AOD are, by and large, similar (decrease with increase in wavelength), the 1996 AOD values show higher when compared to those in the other two years. The corresponding size distributions show, dual-slope type for 1994, bimodal for 1995 and power-law type for 1996.
Figure 4(a,b) depicts the wavelength dependence of AOD and corresponding size distribution for the winter season as a whole (average of four months) for the three years under study. Wavelength distribution of AOD shows, on an average, decrease with increase in wavelength. Moreover, 1995-96 winter AODs are higher than those of the other two years. Monthly mean fullday AODs also exhibit higher depths during 1995-96. These results reveal more extinction of the atmosphere, may be due to the combined effect of higher population of locally produced aerosols and, frequent low-level morning temperature inversions and resultant trapping of large number of surface-generated aerosols during 1995-96. Aerosol size distributions during 1993-94 and 1995-96 show bimodal type, each mode representing different sources. The aerosol size distribution during 1995-96 follows power-law. This suggests that columnar aerosol size distribution during 1995-96 is mostly dominated by the local sources and meteorological conditions, while those during 1993-94 and 1994-95 are influenced by both locally generated (fresh) and continental (aged) aerosols. The relative dominance and occasional shifting between the modes depend upon meteorological conditions.
4.2. Relationship between optical depth and meteorological parameters
The meteorological parameters greatly influence the aerosol particles in their formation, scattering, aging, transport and diffusion. The main components of aerosols that are largely modified by these processes are size distribution, refractive index and vertical distribution/columnar optical depth (Hanel, 1976; Zuev, 1982; Nilsson, 1990). Increase in relative humidity (rh) can enhance the growth of particles (condensation, coagulation and re-suspension) of both currently present as well as those particles whose scattering efficiency was low before their measurement. This results in increase in light scattering (optical extinction) due to increase in particle size or increase in particle number density or due to both. While the condensation and coagulation processes produce mostly accumulation-mode particles, resuspension produces coarse-mode particles. The amount of growth depends on the water affinity of the aerosol particles which in turn depends on their chemical composition and hence on their location. Similarly, increase in wind speed (ws), in general, causes enhancement in AOD due to addition of aerosol particles of sub-micron size from surroundings to the existing ones due to transport processes. Attempts have been made in this paper to examine how the changes in temperature range, δt (difference between day's maximum and minimum temperatures), ws and rh are connected with the variations in AOD. Figure 5 (a,b,c) displays the scatter plots between the AOD at 0.55 μm wavelength and ws on each observational day for all the three winters. Likewise, Figures 6 and 7 show scatter plots between AOD at 0.55 μm and rh and δt, respectively. In each winter, the correlation coefficient between AOD and respective meteorological parameter is also depicted in the figure.
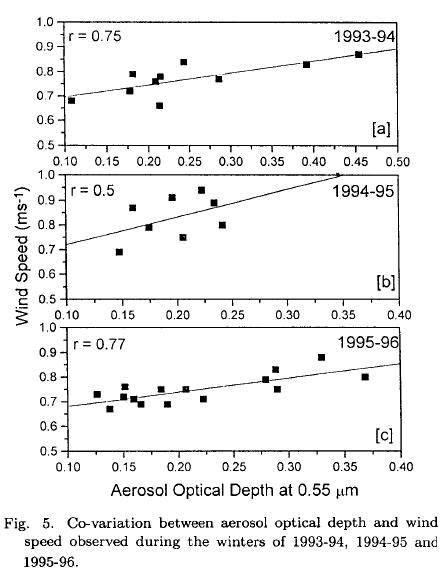
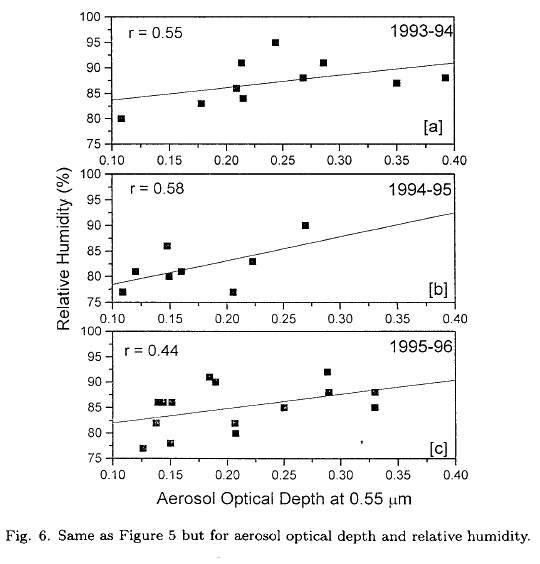
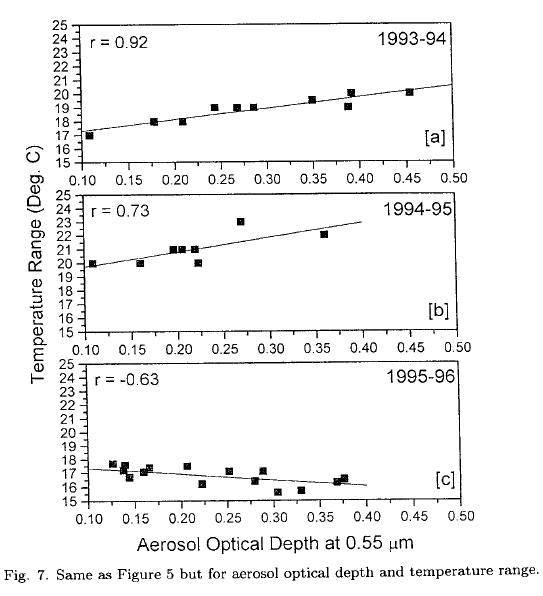
It is evident from the Figures 5 and 6 that the ws and rh show positive correlation which is consistent. It can be noted from the Figure 7 that δt values are smaller during 1995-96 when compared to the other two winters. Albeit the relationship between δt and AOD is positive during 1993-94 and 1994-95, it is negative during 1995-96. Positive correlation coefficients are ascribed mainly to the local effects such as higher temperature ranges, and temperature inversions in the surface layer. The negative correlation between δt and AOD during 1995-96 could be due to the dominance of particles arising from non-local sources. This is also supported by higher correlation coefficients observed between AOD and ws indicating transport of aged aerosols from surroundings during the same year.
5. Conclusions
Atmospheric aerosol properties (columnar aerosol optical depth and size distribution) have been studied using a computer-controlled high resolution spectroradiometer in the wavelength region from 0.4 μm to 0.72 μm during the three consecutive winters of 1993-94, 1994-95 and 1995-96 over Pune, an urban station. The results revealed that (i) FN AODs are greater as compared to AN AODs in all the three winters, which is characteristic feature of the observing station, (ii) optical depths are higher during the winter 1995-96 as compared to other two winters under study which is considered to be partly due to the transport of continental aerosols and due to more frequent formation of ground-inversions, (iii) the association between the AOD and meteorological parameters suggest significant influence of local meteorology on the measured aerosol properties. The observed relationships between AOD, δt and ws assisted to delineate the presence of local / non-local aerosol sources prevailing over the observing site.
Acknowledgments
The authors are thankful to the Director, IITM for his constant encouragement. Thanks are also due to the India Meteorological Department (IMD), Pune for providing the meteorological data. The valuable suggestions / comments provided by the referees are gratefully acknowledged.
REFERENCES
Devara, P. C. S., P. E. Raj, G. Pandithurai, and S. Sharma, 1995. A high spectral resolution radiometer for atmospheric monitoring, J. Instrum. Soc. India, 25, 142-154. [ Links ]
Devara, P. C. S., P. E. Raj, G. Pandithurai, and S. Sharma, 1996. Investigations of aerosol optical depth variations using spectroradiometer at an urban station, Pune, India, J. Aerosol Sci., 27, 621-632. [ Links ]
Harshvardhan, 1993. Aerosol-Climate Interactions. In Aerosol-Cloud-Climate interactions (edited by P.V. Hobbs) International Geophysics Series, 54, 75-95. [ Links ]
Hanel, G., 1976.The properties of atmospheric aerosol particles as function of relative humidity at thermodynamic equilibrium with the surrounding moist air, Adv. Geophys., 19, 73-188. [ Links ]
King, M. D., 1982. Sensitivity of constrained linear inversions to the selection of the Lagrange multiplier, J. Atmos. Sci., 39, 1356-1369. [ Links ]
King, M. D., D. M. Byrne, B. M. Herman, and J. A. Reagan, 1978. Aerosol size distributions obtained by inversion of optical depth measurements, J. Atmos. Sci., 35, 2153-2167. [ Links ]
Krishna Moorthy, K., P. R. Nair, and B. V. Krishna Murthy, 1980. A study on aerosol optical depth at a coastal station, Trivandrum, Indian J. Radio Space Phys.,17, 16-22. [ Links ]
Nilsson, B., 1979. Meteorological influence on aerosol extinction in the 0.2-40 μm wavelength range, Appl. Opt., 18, 3457-3473. [ Links ]
Pandithurai, G., P. C. S. Devara, P. E. Raj, and S. Sharma, 1997. Retrieval of aerosol size index from high spectral resolution radiometer observations, Aerosol Sci. & Tech., 26, 154-162. [ Links ]
Shaw, G. E., J. A. Reagan, and B. M. Herman, 1973. Investigations of atmospheric extinction using solar radiation measurements made with a multiple wavelength radiometer, J. Appl. Meteorol., 12, 374-380. [ Links ]
Uthe, E. E., N. B. Nielsen, and W. L. Jimison, 1980. Airborne lidar plume & haze measurements (ALPHA-1), Bull. Amer. Met. Soc., 61, 1035-1043. [ Links ]
Zuev, V. E., 1982. Laser Beams in the Atmosphere, Plenum Publishing, New York, pp. 504, 1982. [ Links ]

