


Servicios Personalizados
Revista
Articulo
 Inglés (pdf)
 Artículo en XML
 Referencias del artículo
 Enviar artículo por email
Indicadores
-
 Citado por SciELO
 -
 Accesos
Links relacionados
-
 Similares en
SciELO
Similares en
SciELO
Compartir

 Permalink
Atmósfera
versión impresa ISSN 0187-6236
Atmósfera vol.14 no.3 Ciudad de México jul. 2001
A scenario of human thermal comfort in Mexico City for 2CO2 conditions
Ernesto Jáuregui
Centro de Ciencias de la Atmósfera de la UNAM, Circuito Exterior, Ciudad Universitaria. 04510 México, D. F., México
Adalberto Tejeda
Licenciatura en Ciencias Atmosféricas de la Universidad Veracruzana, Zona Universitaria, 91020 Xalapa, Ver., México
(Manuscript received August 24, 2000; accepted in final form Jan. 25, 2001)
RESUMEN
A partir de la aplicación del concepto de temperatura efectiva (ET) se presenta un escenario de las condiciones de bioclima humano para la Ciudad de México y zona conurbada para la segunda mitad del próximo siglo. Se usaron resultados de predicciones regionales de modelos de circulación general (GCM) para una duplicación del CO2 y también las tendencias de temperatura de una estación urbana. Se muestran mapas de las condiciones actuales y futuras de confort térmico. La combinación del efecto invernadero y la urbanización, muy probablemente impacten en la población principalmente en la estación cálida (marzo a mayo), cuando se pase de la categoría de confort actual a la inmediata superior (ET 24-27°C) en la mayor parte de la capital del país.
ABSTRACT
Applying the concept of effective temperature (ET), a scenario of human bioclimatic conditions for Mexico City is presented by using results from both GCM regional predictions for CO2 doubling and temperature trend projection from an urban station. Current and future bioclimatic maps for Mexico City and its conurbation are presented. Current environmental conditions will likely change toward a warmer atmosphere due to both the urbanization process and global greenhouse effect. The impact on the population will be more important during the warm season (March-May) when the bioclimate of the city will likely shift away from current neutrality to the next comfort scale category (ET 24-27°C) of warm conditions covering most of the capital city.
1. Introduction
The average predicted warming due to CO2 doubling is expected to increase with latitude. Consequently the impact of thermal stress on urban populations due to the greenhouse effect is expected to be relatively small in the tropics. On the other hand since large cities in the developing countries have grown at an accelerated rate in the recent decades, their heat islands have increased in intensity.
The rate of warming due to urbanization seems to be considerably higher than the one attributed to the greenhouse effect (Oke, 1993) as will be illustrated here for the case of Mexico City.
The implications of global warming upon the urban bioclimate in Europe have been examined by Auliciems (1992) with respect to future indoor climate management.
This author suggests that, as a result of the greenhouse load, with doubled CO2 the generation of radiative gases from air conditioning systems in the production of comfort heat, in industrial countries may contribute further to global warming. In developing countries however energy for space cooling is likely to remain low since the population rather than spend money from limited income will plausibly adapt to new thermal conditions by acclimatization and individual clothing changes. Auliciems (1992) presents thermal maps of Europe (in terms of the dry-bulb thermopreferendum) for CO2 doubling using the GISS (Goddard Institute for Space Studies) predicted temperature rises.
Using the concepts of effective temperature (ET) and relative strain, McGregor (1995) has evaluated the possible bioclimates of equatorial Western and tropical South Pacific as a consequence of global warming and the likely changes in human comfort. For future bioclimates McGregor assumes a +2°C temperature change with vapour pressure changes of +7 to +14% and concludes that global warming will result in changes in frequency, duration and intensity of physioclimatically stressful conditions in that oceanic region.
The purpose of this paper is to present a scenario of bioclimatic conditions at the local scale for a large urban area in the inland tropics (Mexico City) using the effective temperature (ET) concept to evaluate likely changes in human comfort as a consequence of both global warming and urbanization.
2. The climate
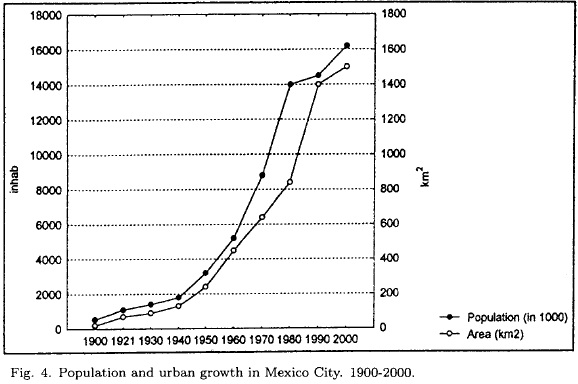
Located in an elevated (2250 masl) valley in the tropics (~ 19°N lat) Mexico City and its conurbation is one of the largest conurbation in the world with a population of 16.2 million in year 2000 (INEGI, 2000).
The climate in the suburbs to the north and east is semi-arid (450 mm/yr) favouring the development of dust storms at the end of the dry season, which occurs between November to April (Jáuregui, 1989). In the western and southern sectors the climate is more humid (800 to 1000 mm/yr). The scant rainfall during the cool season (November to February) is originated from frontal passages that gives rise to anticyclonic weather with clear skies and abundant sunshine. Rain during the wet season is associated with thunderstorms related to either easterly waves or/and to orographic effects.
The annual variation of temperature is small (~ 5°C) but the diurnal range is large (~ 15°C) occurring in the second half of the dry season (Fig. 1). During this period when surface-based radiation inversions in the morning prevent the dispersion of air pollutants increasing the levels of discomfort. For a detailed description of Mexico City bioclimatic conditions see Jáuregui et. al. (1997).
Mean monthly temperatures in Mexico City vary from 17 to 19°C during the warm season characterized by cool nights and warm to hot afternoons. During this period afternoon temperatures may reach 32°C. However, humidity levels are then markedly low (around 15 to 20% relative humidity) and consequently comfort conditions as estimated by ETs are only one scale category (ASHRAE, 1966) above neutral (see Table 7 in Jáuregui et. al., 1997).
Although these heat waves (temperature above 30°C during two or more consecutive days) do not reach critical levels by ASHRAE standards, they receive a great deal of attention in the media as extraordinary events and questions are asked by the public whether these events of high temperatures are the first signals of global warming. However, heat waves have not increased their frequency as shown in Table 1 nor their duration.
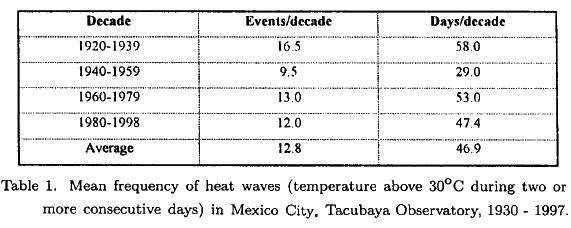
As an average for the period 1930-1997 and during the warm season five heat waves per month occur in April and May with a length of about 19 days/decade. During June one heat wave is observed as an average as shown in Table 1. It should be noted that during these heat waves temperatures at the Tacubaya Observatory have never surpassed the 34°C mark, although somewhat higher values may have been reported in the old quarters of the city center near the core of the heat island.
Between March to May the inhabitants of the capital city are faced with the dilemma of wearing clothes appropriate for a cool morning but then suffer the consequences of excessive cover of clothes in the afternoon hours. Clearly, mean monthly temperatures in this case do not reveal the actual structure of the thermal regime.
3. The data
Mean monthly records of temperature (°C) and precipitation (mm) were available for the period 1951-1980, for 36 stations (Fig. 2). Future mean monthly temperatures and precipitation were obtained from output of regional scenarios for Mexico derived from CCCM and GFDL models developed by Conde et. al. (1995).
It is generally agreed that regionalized variables (e.g. temperature and precipitation) in these scenarios may be highly speculative since the potential source of error is large (e.g. the effects of cloud changes). However, since the selected models gave similar results for the mean yearly temperature increase between 1980-2050 (form 2.1° to 2.9°C, Tables 2a and 2b), the lower value was adopted for the estimation of future temperature at the time of CO2 doubling, assumed to take place in year 2050. This assumption introduces another source of uncertainty.
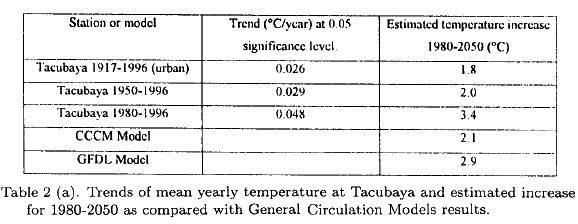
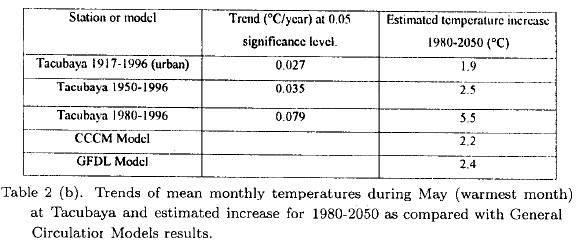
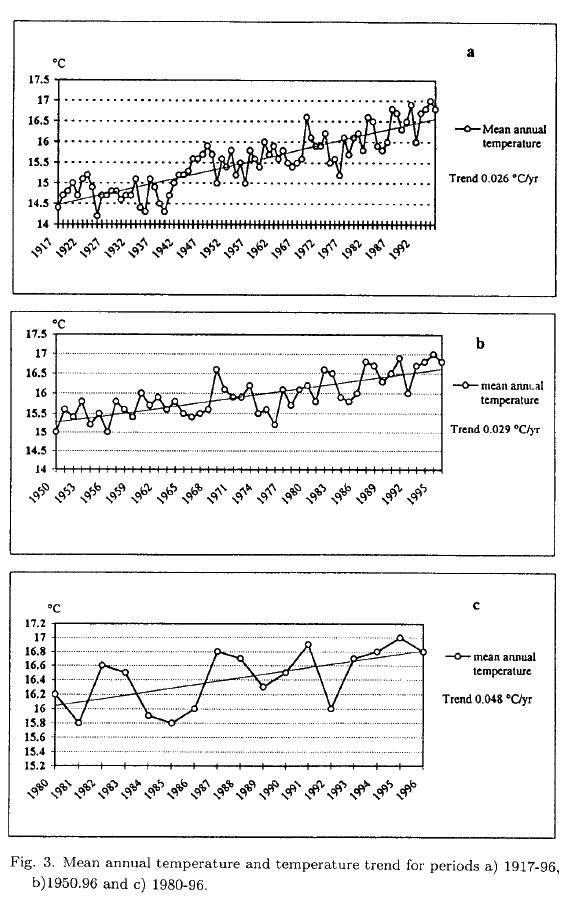
Figure 3 shows the mean annual temperature curve at urban station Tacubaya located to the west of downtown. Temperature trends are shown for three periods: 1917-96 (Fig. 3a), 1950-96 (Fig. 3b) and for the recent years 1980-96 (Fig. 3c) in which the most marked rate of temperature increase has been observed. The rate of temperature increase obtained from period 1980-96 has been selected for the projection since it gives the largest temperature increase (3.4°C) for the period 1980-2050 (see Table 2 a). Moreover, since this temperature increment is supposed to be the result of both urbanization and global warming, it would have necessarily to be larger than the temperature increase due solely to greenhouse warming.
While the 1990 census has revealed a slight decline in the Mexico City's population caused by the emigration after the 1985 earthquakes (Fig. 4), a large portion of this migration has settled in the metropolitan areas and satellite cities and the result is the 16.2 million of people in the conurbation shown in Figure 2. This redistribution of the population contributes to increase the density of the built-up area in the suburbs therefore tending to maintain there the high rate of increase of the heat island well into the XXIst century.
4. Method
A wide range of empirical biometeorological indices have been proposed in the literature (for a review see Landsberg, 1972; Taesler, 1987; Jáuregui, 1997a). Höppe (1997) has concluded that in assessing the bioclimatic conditions of a location two approaches have been explored: the synthesis approach that attempts to combine the various meteorological elements into comfort indices and the analytical approach. The first one has produced a multitude of empirical relations for the comfort of man. However these relations are for specific conditions of temperature, humidity, radiation and wind.
The analytical approach explains the basic physics of the human comfort by examining the energy exchanges between man and his environment. However given the complexity of biophysical models which in addition are demanding in terms of their data requirements, simple bioclimatic indices have continued to be applied at various scales in recent times. This situation holds especially in tropical regions of developing countries where the availability of elaborate data is limited (McGregor, 1993; Jáuregui, 1997a).
Since most GCMs output is usually in terms of temperature and precipitation scenarios for CO2 doubling, in this paper an index which combines these two variables will be used. Moreover, given the present uncertainties inherent in the GCMs products it would not be compatible to try to use a more sophisticated bioclimatic index (e.g. a human energy balance model as Jendritzky, 1991).
The most frequently applied index is probably the Effective Temperature (ET) defined as the temperature of still air that gives the same thermal sensation as the ambient conditions. The ET equation proposed by Missenard (1937) is:
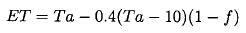
where Tα is air temperature in °C and ƒ is the relative humidity in decimals.
While the ET concept is attractive for its simplicity of application (Hentschel, 1987) it has been criticized for its apparent insensitivity to high.humidity in warm climates (Tromp, 1980); also, the ET does not take into account radiation load or ventilation.
Originally proposed by Houghten and Yaglou (1923), it should be noted that the ET is an index of thermal response for sedentary individuals. Limitations of the index have been pointed out by Landsberg (1972), Tromp (1980), Jendritzky (1991) and others. In spite of these disadvantages the ET has been widely used for regional and local bioclimatic/assessments as an index of heat stress (Jáuregui, 1997a; McGregor, 1995).
In this paper an empirical equation given in terms of relative humidity is used in order to evaluate the impact of the future bioclimate of Mexico City on the population. Moreover, possible shifts in ASHRAE (1966) categories toward a warmer bioclimate due to both urbanization and CO2 doubling are explored.
a) Estimation of present (1951-1980) and future (2050) relative humidity
In order to estimate ET we need to calculate ambient vapor pressure (e in hPa) in terms of mean monthly values of temperature and precipitation P (mm), since climate scenarios for CO2 doubling are given in monthly values of temperature, precipitation and solar duration. Future temperature and humidity for CO2 doubling were derived from two GCMs results (Conde et al., 1995).
For period 1951-1980 we first estimate the vapor pressure e (hPa) by means of a linear regression procedure:

with a standard error of 3.0 hPa and a linear correlation coefficient of 0.8961 (for 67 meteorological stations and 12 months, 804 cases). Tmean and P are the mean monthly temperature and total precipitation.
The relative humidity (ƒ in decimals) is

where the saturation vapor pressure es is calculated according to Adem (1967):

where T is the air temperature in °C.
b) Estimation of ET using Conde's GCM results
The mean monthly effective temperature (Missenard, 1937) is expressed:

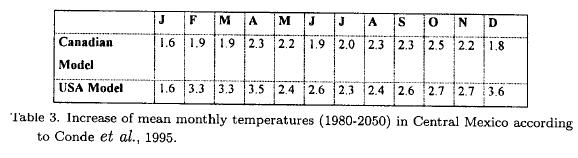
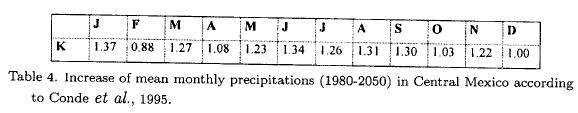
For a 2 x CO2 scenario, Conde et al. (1995) show the expected mean monthly temperature increase (°C) for Central Mexico (with two general circulation models: the CCCM -Canadian model - and the GFDL -USA model), listed in the Table 3. The total mean monthly precipitation for 2 x CO2 conditions can be evaluated or estimated by means of:

where the factor K takes the monthly values from Table 4.
From equations 1 and 2, the mean monthly relative humidity for 2 X CO2 conditions:
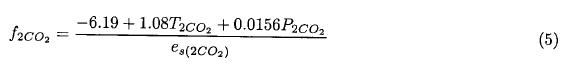
For  and P2CO2 = KP51—80, we nave use the Canadian scenario, since results seem less catastrophic. The saturation vapor pressure for 2CO2 conditions (es(2CO2)) was calculated with equation (2) with T2CO2.
Therefore, the maximum mean monthly effective temperature for 2CO2 conditions:

In absence of significant advection, (Geiger, 1957) suggests that the vapor pressure is invariant between 10 to 14 hours, and the mean minimum (representative for 14:00-15:00 hours) relative humidity is:

where  is the mean maximum monthly temperature and es(Tmax) is obtained by the equation 2 applied to .
Therefore, the effective temperature (mean monthly maximum) is:

c) The temperature trend approach
Another possibility is to use the temperature trend for period 1980-1996 (3.4 °C/70 years, Fig. 3c or Table 2).
We can now estimate ET for each station as a function of the mean monthly maximum temperature estimated by means of the temperature trend and the minimun relative humidity deduced from the CCCM model:

5. Results
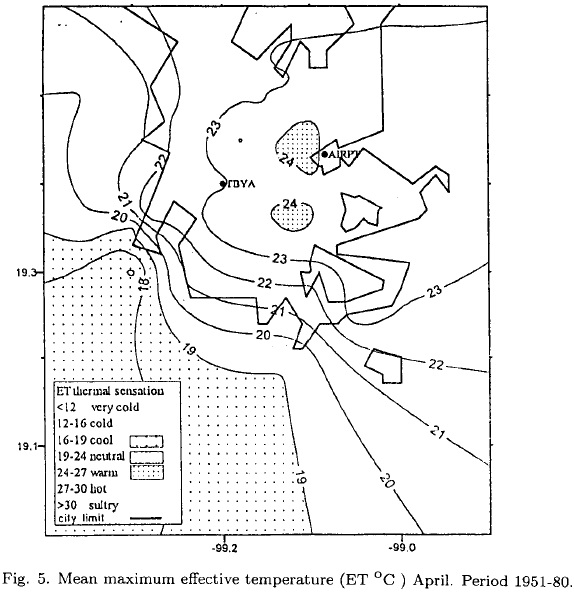
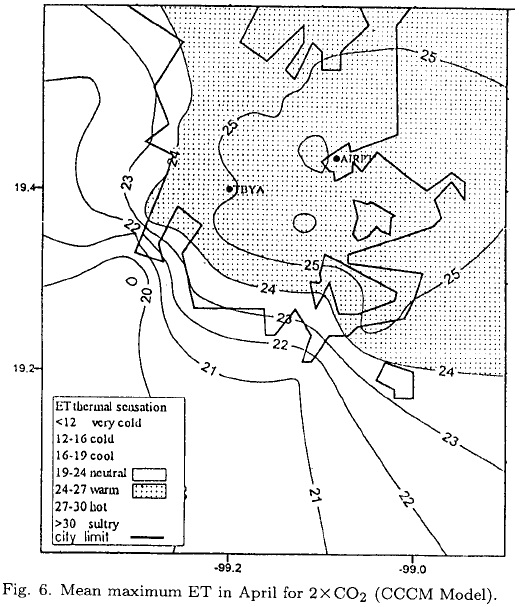
Figures 5 to 10 (6, 7, 8, 9) show the comfort conditions for Mexico City and its conurbation during the afternoon hours, when the maximum temperature occurs and the heat island phenomenon is not present in this area (Jáuregui, 1997b). Figure 5 shows the mean maximum effective temperature distribution (ET) for April (the representative month of the warm season) for reference period 1951-1980. In most of the capital city neutral conditions prevail (ET 19-24°C) while small warm islands are located in the downtown area. However, a 2.1°C temperature increase in annual temperature given by the CCCM model approach results in an expansion of the urban area where warmer conditions away from neutral comfort will prevail in Mexico City during April, as illustrated in Figure 6.
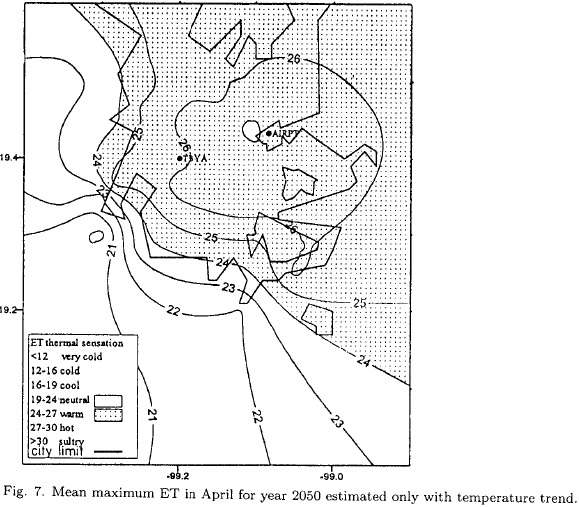
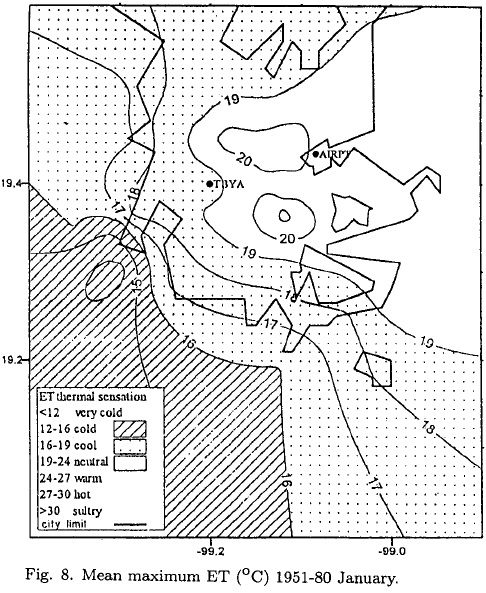
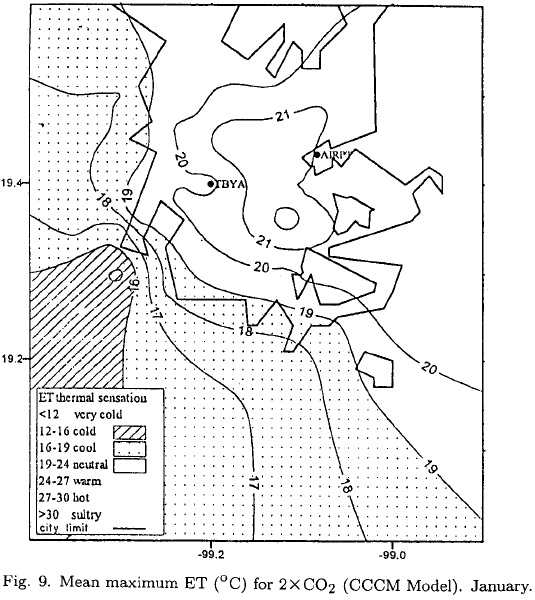
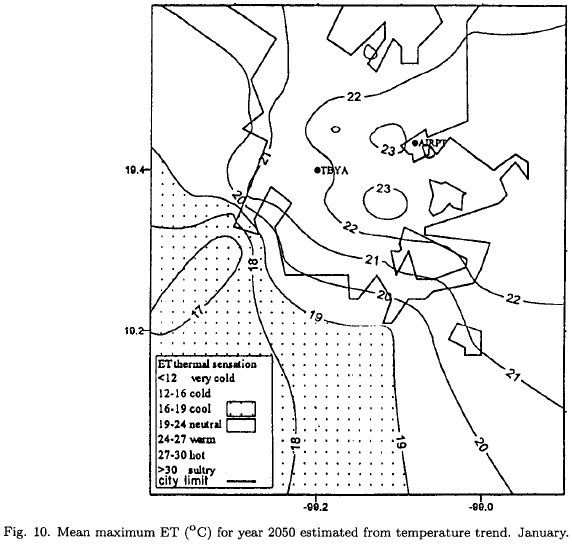
Since the temperature-trend approach is expected to generate even larger temperature increases, future bioclimatic conditions during the warm month of April are anticipated to be warmer: ET 25-27°C, a shift by a whole ASHRAE (1966) scale category, and cover a large portion of central and eastern Mexico City. Only the western and southern suburbs will maintain the present neutral conditions of comfort (Fig. 7). Finally while the present bioclimate of the capital city is on the cool/neutral side in January as shown in Figure 8, future mean thermal conditions will lift mostly to a neutral thermal environment as estimated by both the CO2 doubling (Fig. 9) and temperature-trend scenarios (Fig. 10).
6. Concluding remarks
One characteristic of tropical climates is the greater diurnal range of temperature as compared to the annual range. Being located in the tropics (latitude 19°N) the bioclimate of Mexico City is predominantly cool (to neutral during the warm season) due to its high elevation (2250 m asl). While nights vary from cold to cool throughout the year, neutral/comfortable (ET 19-24°C) conditions prevail during most daylight hours. However, the abundant solar radiation observed in the dry season (November to April) provides an additional heat load. The interception of radiation by clouds and evaporation from wet surfaces during the rainy season makes the urban environment pleasantly neutral.
The above conditions will likely change toward a warmer environment due to both the urbanization process and greenhouse effect as illustrated in this analysis. Obviously the possible source of error is large in characterizing future temperature and humidity conditions at the local scale. The assumptions that have been made (e.g. the year in which doubling of CO2 will take place, the future rate of temperature increase due to urbanization) are clearly highly speculative. Moreover, given the observed stabilization of the population trend in recent decades in the capital city, it is likely that the rate of increase of the urban air temperature will decline and therefore the estimated future temperature will tend to be smaller than that assumed in this paper.
While a considerable portion of the bioclimate of the capital city will likely shift away from neutrality during the warm season (a whole category in the ASHRAE, 1966 scale), thermal conditions during the cool/cold season will tend to be less rigorous. One final consideration that should be made is the fact that the indigenous population may gradually achieve acclimatization to the new thermal conditions that are expected to prevail in the XXI century.
Acknowledgements
The authors are grateful to J. L. Vázquez for doing the computer maps, E. Luyando for computer graphs, and Ms. G. Zarraga for typing the manuscript. This work has been funded in part by the National Council for Science and Technology (CONACyT Ref. T9507-2130P).
REFERENCES
Adem, J., 1967. Parameterization of atmospheric humidity using cloudiness and temperature. Mon. Wea. Rev., 95, 83-88. [ Links ]
ASHRAE, 1966. Standard, 55-56: Thermal environmental conditions for human occupancy. American Society of Heating, Refrigerating and Air Conditioning Enginners (ASHRAE), Atlanta, Ga. [ Links ]
Auliciems, A., 1992. Greenhouse warmed Europe: thermoregulatory criteria for future indoor climate management. Int. J. Biometeorol. 36, 201-209. [ Links ]
Conde, C., O. Sánchez, V. Magaña, and C. Gay, 1995. Escenarios climáticos básicos y regionales, Segundo Taller de Estudio de Pais: México. México ante el cambio climático. Memorias, 101-111. [ Links ]
Geiger, R., 1957. The climate near the ground. Harvard University Press. Cambridge, 493 pp. [ Links ]
Hentschel, G., 1987. A human biometeorology classification of climate for large and local scales. Proceed. Symp. On climate and human health. (WCPA: 120-138). Geneva. [ Links ]
Houghten, F. C. and Yaglou C. P., 1923. Determining lines of equal comfort. Trans. Am. Soc. Heat Vent Eng. 29, 163-176. [ Links ]
Höppe, P., 1997. Aspects of human biometeorology in past, present and future. Int. J. Biometeorol. 40, 19-23. [ Links ]
INEGI, 2000. Estados Unidos Mexicanos, XII censo general de población y vivienda 2000: resultados preliminares. Instituto Nacional de Estadística, Geografía e Informática (INEGI). 375 pp. [ Links ]
Jáuregui, E., 1989. The dust storms of Mexico City. Int. J. Climatology, 9, 169-180. [ Links ]
Jáuregui, E., 1997a. Aspects of urban human biometeorology. Int. J. Biometeorol. 40, 58-61. [ Links ]
Jáuregui, E., 1997b. Heat island development in Mexico City. Atmospheric Environment. 31, 3821-3831. [ Links ]
Jáuregui, E., J. Cervantes and A. Tejeda, 1997. Bioclimatic conditions in Mexico City: An assessment. Int. J. of Biometeorology, 40, 166-177. [ Links ]
Jendritzky, G., 1991. Select questions of tropical interest in human biometeorology. Int. J. Biometeorol. 35, 139-150. [ Links ]
Landsberg, H., 1972. The assessment of human bioclimate. Technical Note No. 123 WMO-No. 331, WMO, Geneva. [ Links ]
McGregor, G. R., 1993. A preliminary assessment of spatial and temporal characteristics of human comfort in China. Int. J. of Climatology, 13, 707-725. [ Links ]
McGregor, G. R., 1995. The human bioclimates of Western South Pacific islands and Climate Change. Int. J. of Biometeorol., 39, 1, 5-12. [ Links ]
Missenard, A., 1937. L'homme et le climat, Eyrolles, Paris. [ Links ]
Oke, T., 1993. Global change and urban climates. Proceed. 13th Int. Congress Biometeorology, Calgary, Canada, 123-134. [ Links ]
Taesler, R., 1987. Climate characteristics and human health -the problem of climate clasification. Proceed. Symp. On climate and human health. (WCPA: 81-109). Geneva. [ Links ]
Tromp, S., 1980. Biometeorology, Heyden, London, 346 pp. [ Links ]

