


Servicios Personalizados
Revista
Articulo
 Inglés (pdf)
 Artículo en XML
 Referencias del artículo
 Enviar artículo por email
Indicadores
-
 Citado por SciELO
 -
 Accesos
Links relacionados
-
 Similares en
SciELO
Similares en
SciELO
Compartir

 Permalink
Atmósfera
versión impresa ISSN 0187-6236
Atmósfera vol.13 no.4 Ciudad de México oct. 2000
Association between longwave radiation and planetary albedo
M. ABDEL WAHAB and H. M. HASANEAN
Department of Astronomy and Meteorology, Faculty of Science, Cairo University, Giza, Egypt.
(Manuscript received May 13, 1999; accepted in final form Nov. 4, 1999)
RESUMEN
Hemos establecido una relación entre la radiación de onda larga neta y el albedo planetario en la superficie y en la alta atmósfera. Se encontró que hay una relación inversa entre la radiación de onda larga y el albedo planeterio, tanto en la superficie como en la alta atmósfera. Cambios latitudinales también fueron encontrados como un factor significativo, en adición al estacional en el comportamiento de esta relación. Este tipo de relación puede ayudar a entender los ciclos climáticos y explicar muchos problemas de balance de radiación.
ABSTRACT
We have established a relationship between net longwave radiation and planetary albedo at the surface and at the top of the atmosphere. It was found that there is an inverse relationship between the longwave radiation and the planetary albedo at both the surface and the top of the atmosphere. Latitudinal changes were also found to be a significant factor in addition to the seasonal one in the behavior of this relationship. This type of relationship can be helpful in understanding the climate cycle and explain many radiation budget problems.
1. Introduction
The regional variability of the net radiation flux of the Earth's surface is the major agent in the available energy redistribution. Over land the net radiation controls the input of latent heat and sensible heat to the atmosphere and over the ocean its control is responsible for oceanic heating associated with climate fluctuations. Outgoing longwave radiation and planetary albedo are fundamentally important climatic variables. In a pioneering paper Adem (1967) used satellite data to establish the relationship between both planetary albedo and longwave radiation at the surface. While this treatment is not implicitly included the cloud cover so the planetary albedo was used to express the status of sky condition.
Wu et al. (1991) have shown that surface radiation parameters can be derived using some physical approaches. Schmetz (1993) has given an improved linear relationship between the energy reflected at the top of the atmosphere (TOA) and the one absorbed at the bottom of the atmosphere (BOA) based on radiative flux calculations. This parameterization is independent of cloud and surface status. Ramanathan (1986), Cess and Vulis (1989), Cess et al. (1991) have also shown a simple relationship between the net solar radiation flux at both the top and base of the atmosphere.
1.1. Data used
The data used in this paper are the International Satellite Cloud Climatology Project ISCCP archived at Langley DAAC Center and the Nimbus -7 Earth Radiation Budget ERB Matrix Summary Tape EMST archived at National Space Science Data Center NASA. The ISCCP data product has been reported by Rossow et al. (1994), while the ERB Matrix Summary Tape (EMST) data product has been reported by Kyle (1991). The area under study in our work lies between 5° to 70°N latitude along 35°W to 70°E longitudes.
The cloud analysis products of ISCCP called C1 and C2 data are constructed from the combination of the original B3 radiance and the results of the three parts of the cloud algorithm and the correlative data used in the analysis. Stage C data represent the global merged results reported every 3 hr with a spatial resolution of 250 km (nominal). These results provide a complete column description of the atmospheric temperature structure and composition and the cloud surface properties present at each location. The stage C2 data is the monthly averages and summary statistics of the Stage C quantities.
Earth Radiation Budget ERB Matrix Summary Tape (EMST) data product has been reported by Kyle (1991). The spatial format of the radiation budget parameters is designed around a 2070 equal area grid yielding a spatial resolution of 500 km or approximately 5° × 5° at low and mid latitudes. The principal products are nine years of global albedo outgoing longwave and net radiation plus continuing solar irradiance measurements.
1.2. Quality assessment
Comparisons of parameters retrieved from the ISCCP analysis to other measurements of the same or related parameters show that the cloud amounts are generally accurate to within 5-10% random and < 5% bias except in polar regions (where the ISCCP cloud amounts are lower limits) over land areas in winter and at night (where ISCCP values are biased low by about 5-7%), cloud top temperatures are accurate to within 2 K, with the exception of optical thin cirrus clouds where the error is about 5-8 K. Cloud optical thickness is accurate to about 10% except for optically thin cirrus where errors are about 25-40%. Surface temperatures are accurate to about 2 K over oceans and about 1 K over land. Surface visible reflectance is accurate to about 2-4%.
Kyle et al. (1984) and Kyle (1991) have disccussed the quality of the derived Earth Radiation Budget products in detail. Defects in the ERB Earth Radiation Budget products arise both from the calibration problem and from approximations in the processing algorithms. For a great many studies the stability of the measurements is the most important factor. Stable sensors and processing algorithm allow accurate interannual comparison and reasonable comparisons with experiments. Uncertainties in absolute values are much harder to quantify than are relative changes Kyle et al. (1985).
This paper is organized as follows: in Sectiorn 2 the theoretical relationship between surface longwave flux and planetary albedo is proved, in Section 3 the relation between observed surface longwave flux and planetary albedo is discussed. The fluxes at the base and top of the atmosphere and their results and analysis are presented in Section 4. Finally concluding remarks are presented in Section 5.
2. Surface longwave flux and planetary albedo
The main goal here is to prove that all existing relationship of surface longwave relation LBOA can be represented by to a form: LBOA = —Aα + B where A and B are constant and α is the planetary albedo.
Adem (1967) proposed a multi linear relationship between net longwave at surface and planetary albedo. He proposed the following presentation for net longwave radiation at surface LBOA and planetary albedo α that:

Where T's is the deviation from mean surface temperature, T' is the deviation from mean effective temperature, Ac is the cloud cover and a1, a3, a4 and a5 are constant. After some simplification the formula can be rearranged as:

where
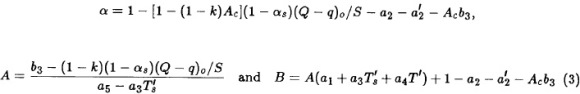
k is a constant that depends on latitude, (Q − q)0 is the total radiation received by the surface with clear sky, S is the insolation on a horizontal surface, α is the surface albedo and a2, a3, a5, b3, k (depend upon latitude) are constants.
Now we have analyzed a method to derive LBOA similar to equation (2) for different parameters in each method to compare the behavior of LBOA and α.
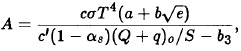
Brunt (1932) and Berliand and Berliand (1952) represent the LBOA as:

where γ = σT4, σ is the Stefan Boltzman constant, es is the surface emissivity, Ts is the surface temperature and Tw is the wet bulb temperature. If we introduce equation (4) with convenient planetary albedo which represent as

Where Ac, αc are cloud and surface albedo. One can get the same formula similar to equation (3) with different A and B constants, which can be written as

Also we imply the Adem albedo equation (2) and eliminating the cloud cover Ac, one can get the same linear relation between net longwave radiation LBOA, and planetary albedo α with different A and B variables
A = γ0c'/c'(1 − αs)(Q + q)0/S - b3
and
B = γ0 + 4σesT4(Tw − Ts) − A(α2 + α'2 − 1 + (1 − αs)(Q + q)0/S
Bultot et al. (1988) evaluated net radiation as follows:

where T is air temperature e is vapor pressure in mb and Ac is cloud covering decimals. They used coefficients a = 0.39, b = 0.05 and c = 0.1777 in equation (6). They also introduced water vapor emissivity es with constant value, as in surface energy balance GCM models, in equation (6). Then equation (6) can be simply rewritten in the form:

Eliminating Ac from equation (5 and 7) one can obtain the relation between albedo and net longwave radiation from formula (2) but with different A and B constants in the form:

Also if we useplug α in Adem's equation (3) with LBOA based on equation (7) after eliminating the cloud cover, the results lead to constants A and B as follows:
and

Recently Dogniaux (1994) evaluated upward and downward longwave radiation (Lu and Ld) and his expression is:

where T is air temperature, SS is the effective duration of sunshine and G is the global radiation, then net longwave radiation can be written as:

Due to the relation between cloud cover and sunshine duration we have introduced the cloud cover sunshine conversion as SS = 1 − Ac and using a and b from Brunt (1932), and also by eliminating Ac from equations (8 and 5) one can get an explicit relation between planetary albedo and net longwave radiation similar to equation (2) with different A and B as follows:

Also using implicit equation (3) for Adem planetary albedo with LBOA from Dogniaux (1994), we can get similar equation (2) with A and B variables as:

and
B = Lu − σT4 − σT4[0.904 − (a + b√e) − 0.005√e] − A[a2 + a'2 − 1 + (1 − αs)(Q + q)0]/S
We may end up with the conclusion that all methods for estimating net longwave radiation at surface LBOA seems to behave in the form LBOA = − Aα + B where A and B depend on the type of LBOA formulation.
3. Relationship between net longwave radiation albedo and cloudiness
It was assumed that the temporal variability in net longwave radiation at surface LBOA and planetary albedo α quantities result primarily from variations in cloudiness and the resulting patterns of variability appear to be consistent with this interpretation.
Figures 1 and 2 show scatter diagrams of net longwave radiation LBOA versus planetary albedo a for various latitudinal belts and months. The solid line represents the least square fitting. It can be seen that in most cases the data have a characteristic slope  . Fluctuations in the type of cloud and the temperature and humidity in the field of view may cause a scatter about the regression line.
It can also be seen from Figure 1 for January 1984 that the slope is negative over all belts, while it is positive over both tropical and subtropical zones for August 1984 Figures 2b and 2c. This means that in general, there is a negative relationship between LBOA and α. The difference in the slope between January Figures 1b and 1c and August Figures 2b and 2c in tropical and subtropical belts, respectively, may be due to seasonal variations of cloud amount as shown in Figure (3a) or surface temperature as in Figure (3b). This is due to changes in monthly mean albedo as well as to changes in monthly mean cloud amount. There is a possibility that random variations in monthly mean cloud albedo exist. We have also interpreted changes in monthly mean longwave radiation as being due to changes in mean cloud amount. This result is in agreement with other previous studies. For example Heddinghaus and Krueger (1981) concluded that LBOA over the tropics is largely modulated by cloudiness. Slingo (1982) stated that clouds play an important role in the hemispheric LBOA and α particularly in the tropics. Liebmann and Hartmann (1982) concluded that the infrared flux anomalies are closely related to the change in convective clouds patterns. Lau and Chan (1983a and b) have seen that the LBOA variation in the tropics is closely related to cloud and precipitation. Smith and Rutan (1984) came to the conclusion that the regions of greatest variability of LBOA are in the tropics and subtropics.
From Figures 1 and 2 a straightforward LBOA = −Aα + B can be found in both January and August months. But in January the behavior has some nonlinearity. On the other hand for each of the tropical and mid latitudinal belts the behavior is sensitive to the seasons while for high latitude belts it agrees well with the global observations.
With cloud cover the measured and calculated planetary albedo agree on domain of partial cloudy to overcast conditions. In the case of clear sky conditions the calculated and observed albedo work in opposite directions.
As indicated in tables for the values of correlation between α and both LBOA and Ts la, we found the important following remark: the correlation between α and both LBOA and Ts are negative correlations in all months and over all latitudes, with the exception of subtropical belts for August (1984); see Tables 1c, 1d. In the summer subtropical belt α is more dependent on Ts than LBOA with a positive relation.
4. Fluxes at top and base of the atmosphere
The existence of a simple relationship between the net solar radiation flux at the top of the atmosphere NSTOA and base of it NSBOA has been formulated by Schmetz (1993) on the following pattern for single column model:
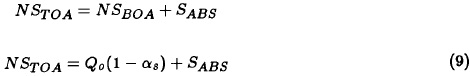
where Q0 is the surface insolation and αs, SABS are the surface albedo and energy absorved in the atmosphere. In a similar manner the longwave radiation budget at both top and base of the atmosphere can be either derived from instantaneous temperature humidity and cloud data or from monthly means the difference ranging from 0.4 to 6.4 W/m2. The net radiation at the top of the atmosphere NTOA can be expressed as:

where LTOA and S are the net longwave radiation and solar insolation at top of the atmosphere and a is planetary albedo.
The system of equations (9 and 10) describe the balance of flux first one clear the solar radiative flux while second one deals with net flux with planetary albedo α having on upper and lower limits. In the represent work net longwave radiation at the base and top of the atmosphere is discussed and sensitivity to planetary albedo is presented.
4.1 Radiation flux estimates
The emission of specific area at the Earth's surface can be computed from the contributions of different constituents of the emitting system. If Aci denotes the type of cloud fraction as seen from the ground and τi, is the atmospheric transmittance for flux at level Zi then:

where ɸ(T) = σT4, es and eci are surface and cloud emissivities respectively. The first term on the right hand side represents the flux from cloud free area (1 — Ac); the third and fourth terms stand for top of the atmosphere cloudless part and cloudy one respectively. The contribution of water vapor and aerosol are mainly involved in the LBOA as an portion of equation (11), including the first and second terms.
The radiation budget at the surface consists of four components, the downward short and long fluxes. Where the reflected short and the emitted longwave are expressed by

where LBOA = (Ld − Lu)BOA and Q is the global solar radiation at the surface and Ld and Lu are downward and upward longwave radiation respectively. Then
ΔLW = LTOA − LBOA
and

For single column cases for ΔSW and ΔLW are given on Table 2, has been derived from single column model, following Krishnamurti (1986). Two different cases: one with surface temperature 30°C and the other with 39°C are given for sake of comparison. The observed short and long wave flux in the atmosphere as given by equation (13) under different cloud conditions are recorded on Table 2.

For ΔSW radiative short wave absorbed in the atmosphere Schmetz (1993) introduced the following:

where Sabs is the fractional solar absorption, S0 is the solar constant and 6 is the solar zenith angle Sabs =  .
.
One can see from Table 2 the effect of surface temperature variation on heat absorbed and emitted through ΔSW and ΔLW. It is quite remarkable that the flux increases with cloud cover. These values are on average for different cloud conditions for different locations in mid latitude regions are: ∂SW/∂Ac = 64Wm2 and ∂LW/∂Ac = 143Wm2.
Let us propose the basic sensitivity characteristics of the climate model this parameter will be defined:

This parameter is different from Budyko's (1974) which define as ΔQ/Qsp where Qsp is the planetary incoming solar radiation. When the heat inflow decreases from some initial value considerably larger than the solar constant ice-free conditions are first observed (ɸ = 90°). The behavior of the ratio via latitude shows an increase in latitude when  decreases (and vice versa) which may represent unstable glaciation regimes that convert into regimes of full glaciation or none with small heat income fluctuations. This sensitivity parameter has a critical value with clear conditions of value 0.4 and it is doubled approximately with overcast condition. By parameter given in (15) where SWTOA and SWBOA variables rather than defined sensitivity ratio by Budyko.
4.2. The Earth's radiation budget sensitivity to cloud variation
One can study correlation between fluctuations in cloud amount and Earth radiation budget to estimate the effect of cloudiness redistribution on the net radiation at the top of the atmosphere.
By differentiating equation (2) with respect to α

where S is the incident solar flux at the top of the atmosphere, which is a 7a periodic function due to eccentricity of the Earth's orbit,  tends to zero. Then:

The change of the net flux at top of the atmosphere is given with cloud cover Ac and planetary albedo a on Table 3, which it has also been derived from the single column model.
From Table 3 one can see that the changes of dNTOA/dα could be approximated as very small, while changes with respect to cloud are more significant. Therefore, approximately

where k, the constant of integration, can be calculated from initial conditions Karner (1993).
Budyko (1969, 1974) used an expression of the form

where A, B, C, and D are constants of small seasonal variability.
Substituting cloud cover fraction by planetary albedo as:
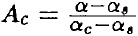 Introducing Ac in equation (18) then:

where 
Therefore under a balanced budget of net flux at the top of the atmosphere NTOA with variable planetary albedo, the net longwave radiation can be estimated. The remarkable difference between equation (19) and the measured LTOA could indicate a deviation of  about zero. This equation is identical to the same parameterization presented in Section 2 for net longwave radiation at surface LBOA.
Also scatter diagrams of net longwave radiation at the top of the atmosphere LTOA versus planetary albedo for the sub-regions and global area under study for January and August (1984) is shown in Figures (4 and 5) respectively. The solid lines in each of the global areas and sub-regions represent a linear fit to the data points. The net longwave radiation at the top of the atmosphere estimated by the formula of Blanchet (1990) due to the absence of a measured value and the planetary albedo observed data. His formula for net longwave radiation at the top of the atmosphere can be written as:

where σ is the Stefan Boltzman constant, Ts and Tc are the surface and cloud temperature respectively, ec is the cloud emisivity and Ac is the cloud amount.
From Figures 4 and 5, some of the major remarks can be extracted as follows:
1. There is more scatter in LTOA and α for August than January, which can be attributed to cloud cover in both seasons.
2. Relationship between LTOA and α for tropical belt has different behavior rather than a global one where any increase in planetary albedo induces ah increase in LTOA at the top of the atmosphere.
3. Subtropical regions are greatly sensitive to seasonal variability where the behavior of LTOA and α change with season. In January the behavior agrees with the global pattern and vise versa in August for the Northern Hemisphere.
4. The polar profile is likely to be more stably insensitive to season and agrees with global pattern.
We can also conclude that the global area agrees with the theoretical formula, which indicates the inverse relation between outgoing longwave radiation at the top of the atmosphere and planetary albedo. This result is similar to the net longwave radiation at surface one with planetary albedo. The seasonal variability of this relationship; stronger in tropical and subtropical regions may be due to the variations of cloud amount in both season Cess et al. (1982).
5. Concluding remarks
1. All methods such as (Adem (1967), Bultot et al. (1988) and Dogniaux (1994)) are tested theoretically to provide an inverse relationship between net longwave radiation at the surface LBOA and planetary albedo α in the form LBOA = A — Bα with different A and B parameterization depending upon each method.
2. It was assumed that the temporal variability in net longwave radiation LBOA and planetary albedo α quantities results primarily from variations in cloudiness and the resulting patterns of variability appear to be consistent with this interpretation.
3. Also the same relationship between net longwave at surface LBOA and planetary albedo α was found for observed data with exception of tropical and subtropical regions in August (1994). This may be due to the closed association between LBOA and cloudiness in the tropics and subtropics as presented by Smith and Rutan (1994).
4. A straightforward LBOA = A — Bα can be found in both seasons. But in January the behavior is much more nonlinear, on one hand. On the other for each for tropical and mid latitudinal belts the behavior is sensitive to season while for high latitude belts it agrees well with the global observations.
5. The effect of surface temperature on heat absorbed and emitted through ΔSW and ΔLW, indicates a remarkable flux increase with cloud cover. These values on average vary at different locations in mid latitude regions having the values: ∂SW/∂Ac = 64W m2 and ∂LW/∂Ac = 143W m2.
6. Changes of net radiation at the top of the atmosphere with planetary albedo could be considered as a very small one while changes with respect to cloud is more significant. Therefore LTOA = —Sα + k where k is a constant of integration that can be calculated from initial conditions.
7. Numerical and regression fitting between estimated longwave radiation at the top of the atmosphere LTOA and observed planetary albedo α has an inverse relationship and it is identical to the same formulation of net longwave radiation at the surface LBOA.
8. Relationship between LTOA and α for the tropical belt has a different behavior rather than the global one, where increases in planetary albedo induce increases in LTOA. Also subtropical regions are the most sensitive to seasonal variability where the behavior of outgoing longwave radiation at the top of the atmosphere LTOA and planetary albedo a change with seasons.
REFERENCES
Adem, J., 1967. On the relation between outgoing longwave radiation albedo and cloudiness. Mon. Wea. Rev., 95, 257-260. [ Links ]
Berliand, M. E. and T. G. Berliand, 1952. Determining the net longwave radiation of the Earth with consideration of the effect of cloudiness. ISV. Akad. Nauk. SSSR Ser. Geofiz. No. 1. [ Links ]
Blanchet, J-P., 1990. Comments on atmospheric feedbacks. Global climate feedbacks: Proceedings of the Brookhaven National Library Workshop, June 3-6, 1990, Edited by Bernard Manowitz. [ Links ]
Brunt, D., 1932. Notes on radiation in the atmosphere. Quart. J. Roy. Meteor. Soc., 58, 389-420. [ Links ]
Budyko, M. I., 1969. The effect of solar radiation variations on the climate of the Earth. Tellus, 21, 611-169. [ Links ]
Budyko, M. I., 1974. Climate and life. Academic press, 308 pp. [ Links ]
Bultot, F., G. L. Dupriez and Gallens, 1988. Estimated annual regime of energy balance components evapotranspiration and soil moisture for a drainage basin in the case of a CO2 doubling. Climate Change, 12, 39-56. [ Links ]
Cess, R. D., B. P. Briegleb and M. S. Lian, 1982. Low latitude cloudiness and climate feedback: Comparative estimates from satellite data. J. Atmos. Sci., 39, 53-59. [ Links ]
Cess, R. D. and I. L. Vulis, 1989. Inferring surface albedo solar absorption from broadband satellite measurements. J. Climate, 2, 974-985. [ Links ]
Cess, R. D., E. G. Dutton, J. J. Deluisi and F. Jiang, 1991. Determining surface solar absorption from broadband satellite measurements for clear skies: Comparison with surface measurements. J. Climate, 4, 236-247. [ Links ]
Dogniaux, R., 1994. Prediction of solar radiation in areas with a specific microclimate. Commission of the European Communities Kluwer Academic Publishers, 107 pp. [ Links ]
Heddinghaus, T. R. and A. F. Krueger, 1981. Annual and inter-annual variations in outgoing longwave radiation over the tropics. Mon. Wea. Rev., 109, 1208-1218. [ Links ]
Karner, O., 1993. Global average net radiation sensitivity to cloud amount variation. J. Atmos. Sci., 50, 3994-4000. [ Links ]
Krishnamurti, T. N., 1986. Numerical weather prediction for the tropics. WMO, No. 669. [ Links ]
Kyle, H. L., 1991. User guide and tapespecification for the Nimbus 7 ERB Matrix Summary Tape EMST Part 1. Document of National Aeronautics and Space Administration Godard Space Flight Center. [ Links ]
Kyle, H. L., F. B. House, P. E. Ardanuy, H. Jacobowitz, R. H. Maschhoff and J. R. Hickey, 1984. New inflight calibration adjustment of the Nimbus 6 and 7 Earth radiation budget wide-field-of-view radiometers. J. Geophys. Res., 89, 5057-5076. [ Links ]
Kyle, H. L., P. E. Ardanuy and E. J. Hurley, 1985. The status of the Nimbus 7 Earth radiation budget data set. Bull. Amer. Meteo. Soc., 66, 378-388. [ Links ]
Lau, K. M. and P. H. Chan, 1983a. Short term climate variability and atmospheric teleconnec-tions from satellite observed aoutgoing longwave radiation. Part I: Simultaneous relationships. J. Atmos. Sci., 40, 2735-2750. [ Links ]
Lau, K. M. and P. H. Chan, 1983. Short term climate variability and atmospheric teleconnections from satellite observed outgoing longwave radiation. Part II: Lagged correlations. J. Atmos. Sci., 40, 2751-2767. [ Links ]
Liebmann, B. and D. Hartmann, 1982. Interannual variation of outgoing IR and association with tropical circulation changes during 1974-1978. J. Atmos. Sci., 39, 1153-1162. [ Links ]
Ramanathan, V., 1986. Scientific use of surface radiation budget data for climate studies. In: Surface radiation budget for climate application. J. T. Suttles and G. Ohring Eds., NASA Ref. Publ. 69, NASA Washington, D. C., 20546-0001. [ Links ]
Rossow, W. B., L. C. Garder, P. J. Lu and A. W. Walker, 1994. International satellite cloud climatology project (ISCCP) documentation of cloud data. WMO/TD-266 (revised) 761 pp. plus three appendices World Clim. Res. Program (ICSU and WMO) Geneva. [ Links ]
Schmetz, J. 1993. Relationship between solar net radiative fluxes at the top of the atmosphere and at the surface. J. Atmos. Sci.. 50 1122- 1132. [ Links ]
Slingo, J. M., 1982. A study of the Earth's radiation budget using a general circulation model. Quart. J. Roy Meteor. Soc., 108, 379-405. [ Links ]
Smith, G. L. and D. Rutan, 1994. Spatial variability of outgoing longwave radiation. J. Atmos. Sci., 51, 1808-1822. [ Links ]
Wu, M. L. C., L. A. Chang and W. M., Smith, 1991. The impact of geophysical parameters on longwave radiation budget at the top and base of the atmosphere. Meteo. Atmos. Phys., 46, 29-40. [ Links ]

