


 nueva página del texto (beta)
 Inglés (pdf)
 Artículo en XML
 Referencias del artículo
 Enviar artículo por email
 Citado por SciELO
  Similares en
SciELO
Similares en
SciELO 
 Permalink
Introduction
To achieve highly qualitative and quantitative yields -without harming the ecosystems- agricultural practice demands management activities to control plant nutrition. Soil fertility control by chemical methods and adequate fertilization application are among these practices. Nutrient demand varies as the crop develops, and therefore it is essential to know the concentration dynamics of one or several essential plant tissue elements at the different phenological stages. This knowledge allows performing management practices to satisfy the plant nutritional demand by efficient crop fertilization and simultaneously takes care of the environment (Dobermann, 2005; IPNI, 2013).
The chemical plant tissue analysis to diagnose crop nutritional supply -notwithstanding its reliability- shows limitations for its massive use (Muñoz-Huerta et al., 2013; Ali, Al-Ani, Eamus, and Tan, 2017), including inaccurate knowledge of the sample collection season, high costs, delay in obtaining, and difficulty in interpreting the laboratory results.
Easy-access alternatives and economic methods to diagnose crop N supply have been developed in the last four decades (Rauschkolb et al.,1974; Schepers, Francis, Vigil, and Below, 1992; Withers, 1982). Currently, available semi quantitative methods offer quick results to perform adjustments in the fertilization dose plan during the agricultural cycle (Justes, Meynard, Mary, and Plénet, 1997; Etchevers, 1999) at a reasonable cost (Muñoz-Huerta et al., 2013) and straightforward interpretation (Rauschkolb et al., 1974). Nonetheless, they should be previously calibrated for each crop, and possible for each specific agroecological zone.
Diagnostic methods to assess the nutritional status consist of sampling a given portion of the plant biomass to measure an indicator of the response to the application to an increased nutrient dose. The indicator can be the dry matter accumulation or the nutrient concentration. Biomass accumulation -the product of the increasing fertilizer dose applied- is related to the specific nutrient concentration in plant sap or dry matter extracts. The nutrient concentration is specific to the plant part collected and the phenological stage. The values for making the diagnostic are given in pre-established protocols. The best results are achieved when the experimental crop develops in the absence of restrictive conditions of any growth factor, except for the factor under study, that is, water, light, temperature, etc. (Mills and Jones, 1996; Smith and Loneragan, 1997; Alcántar-González and Sandoval-Villa, 1999; Etchevers, 1999).
Several semiquantitative methods with various functioning principles -electrochemical, colorimetric, optic, enzymatic, photo-tele detection, photochemical activities- to mention some (Sánchez, Molinos, Alcántar, and Sandoval, 2016) are used for diagnosing the N status in crops. For example, Reuter, Edwards, and Wilhelm (1997) and Mills and Jones (1996) suggested using portable ion meters of specific electrochemical principle, to analyze plant N-NO3, including a section with interpretation ranges for different crops. These authors also indicated the feasibility of using optical chlorophyll readers, such as SPAD 502® (Minolta, Osaka JP) for this purpose. In maize, Reuter et al. (1997) showed that N-NO3 ranges in the base of stem on a dry base is useful to interpret the N status of the plant. Several methods for N diagnosis in crops, their functioning, calibration for different crops, linear or non-linear relationships as compared to other more robust diagnostic procedures, and other aspects for their implementation are compiled in extensive literature reviews (Lemaire, Jeuffroy, and Gastal, 2008; Titolo, 20121; Muñoz-Huerta et al., 2013; Ali et al., 2017; Rhezali and Lahlali, 2017; Colaço and Bramley, 2018).
Therefore, this study's objective was to calibrate five semi quantitative field methods and two quantitative laboratory methods with field experiments to diagnose the nutritional N status in maize in the region of El Bajio, Guanajuato, Mexico.
Materials and Methods
Study site
Experimental plots were established with maize (Zea mays L.) crop and fertilized with increasing N doses in a commercial lot of Juventino Rosas Municipality, Guanajuato, Mexico (20° 35' 19.2" N, 100° 56' 46.8" W). The soil classification corresponds to a clayey pellic Vertisols (Vp) (WRB, 2015). Before planting the experiment, non-fertilized maize was established to reduce the soil N content. Soil depth increment (0-30 cm) had a bulk density of 1.1 g·cm‑3, hydraulic conductivity of 0.77 cm·h-1, soil pH = 7.0 cation exchange capacity of 34 cmol(+)·kg-1, and organic matter content of 2.0%. After the lot was depleted of N, the soil contained 89 kg·ha-1 of N-NO3 in the first 0.60 meters.
Twenty-five experimental units with an area of 30.4 m2 each, five seeding furrows distant 0.76 m with 8 m length each, were sown on May 23, 2019 and had a plant density at harvest time of 95 000 plants ha-1. The fertilization treatments consisted of five N doses (0, 120, 240, 360, 480 kg·ha-1), and each treatment was replicated five times. The experimental design was a randomized block.
The plots received N application at three different opportunities: (a) at sowing; 35% of the total N dose corresponding to each treatment applied as monoammonium phosphate and ammonium sulfate, except for the control treatment where only triple superphosphate was applied to maintain the plot without N. The treatments with N at 120 or more kg·ha-1 received: (i) initially 30% of N, using the sources of ammonium suphpate and monoammonium phosphate and the rest of the required dose of N as ammonium sulphate and urea in subsequent dates; (ii) 20 days after sowing, 35% of the corresponding total N dose as urea; and (iii), 54 days after sowing the remaining 35% of the N dose as ammonium sulphate. At sowing, the experimental lot received a basal phosphorus (P) and potassium (K) fertilization of 200 kg·ha-1 of P205 and 100 kg·ha-1 of K2O applied as monoammonium phosphate and potassium chloride, respectively, and an extra 100 kg ha-1 of K2O in the second fertilization.
When the plants reached the vegetative phenological stages V7, V12, and at the start of the reproductive stage R1, plant tissue samples were collected for analysis using four semi quantitative and two quantitative methods to diagnose the nutritional N status. The exception was the sampling for performing the analysis of N-NO3 at the dry stem base of the plant, where the sample was obtained at R5. Phenological stages for sampling were based on selected crop stages provided by Castellanos et al. (2019).
Concentration of plant sap N-NO3 of the central midrib of the RML and of the base of stem
In each experimental unit, 12 central midribs of the RML were collected in the cases previously indicated. In the R1 stage, the samples were obtained from the leaf wrapping the corn ear (feminine maize flower) and that of the base of the stem (ten 15 cm sections were taken from 10 cm above the soil surface) (Binford, Blackmer, and El-Hout, 1990).
Sample collection was conducted between 09:00 and 11:00 am and samples were kept in plastic bags in a cooler at 5 °C before transferring them to the laboratory. Central mid ribs of the RML and base steams were compressed with a manual press (Cadahía-Lopez, 2008) for obtaining the plant sap samples. The plant sap samples were diluted in distilled water (1:10) and homogenized with a vortex to reduce interferences (Di Gioia et al., 2010). The collected material was maintained refrigerated (5 °C) until their analysis later in the day. A portable LAQUAtwin® model NO3-11 (Horiba Kyoto, JP) was used to determine the plant sap, or cellular N-NO3 extract concentration. The N-NO3 determination was carried out in triplicate, and the coefficient of variation verified to not exceed 15%; otherwise, the analysis was repeated. The N-NO3 meter was calibrated with the manufacturer solutions (150 and 2000 mg L-1 of NO3) every two-triplicate series.
N-NO3 concentration in the base of the stem (dry matter)
In samplings at V7, V12, R1, and R5, a basal stem fraction from 10 plants was collected. The samples were taken to the laboratory and oven dried at 70 °C until they achieved constant weight. The plant material was grounded and sieved through a 0.42-mm mesh to determine N-NO3 concentration on a dry base weight (Cataldo, Maroon, Schrader, and Youngs, 1975).
Monitoring recently mature leaves with SPAD
The SPAD instrument measures the relative chlorophyll concentration. When plants reached the phenological stage V7, 15 plants located in the central rows of each plot, were selected, and marked (tagged) to measure them again in V12, and R1 the SPAD units with the MC-100 Chlorophyll Concentration Meter® (Apogee Instruments, USA). The SPAD units were measured on the RML between the vein and the edge of the leave when the plant showed phenological stages V7 and V12; in R1 the measurement was performed in the leaf wrapping of the corn ear of the plant. An average of fifteen readings per plot were used to calculate the variation coefficient.
Normalized difference vegetation index (NDVI)
The NDVI was measured in the phenological stages V7, V12, and R1 using a manual Green Seeker® (Trimble Agriculture, USA). In each plot, readings were performed above each plot's central furrow canopy to avoid the edge effect. The device was displaced 0.60 m above the plants' apex at a constant speed of 0.5 m s-1, and each reading was made in triplicate.
Foliar nitrogen analysis
In the stages V7 and V12, 12 the middle third RML, and in R1 middle third of the leaves wrapping the corn ear were collected in each plot. Total N content was determined in the samples using the Dumas method (Horwitz and Latimer, 2005) in an elemental analyzer (FlashEA 1112® Thermo Fisher Scientific, USA).
Harvest
When maize reached physiological maturity (R6), corn cobs were harvested manually in 2.0 m2 in the central furrows of each experimental unit, avoiding the edges. The corn cobs were shelled, and the yield was quantified adjusted to 155 kg of moisture t-1 of grain (CIMMYT, 2012).
Statistical analysis
An analysis of variance (ANOVA) and a comparison of means test (Duncan, α = 0.05) were performed to determine significant yield differences among the N fertilization treatments. Yield data is expressed as relative grain yield percentage (RY) (Equation 1):
The measurements using each of the described methods were graphically and statistically related to the respective RY obtained at harvest. Data were adjusted with a segmented function model known as the linear plateau (Sprent, 1961), allowing for a lineal ascendant relationship and then a plateau. This result shows the variable "Y" response to the increase of the experimental variable "X" axis. The Y variable corresponds to the RY and the X variable to the measurement value that resulted from applying a diagnostic method. The normal lowered from the inflection point of this curve (where it starts getting parallel to the X-axis) and intercepts the latter is known as critical concentration (CC) or critical value. Data adjustments were performed with significance (P < 0.05). Both N-NO3 concentrations in the dry matter of the base of the stem at R5 were related with relative grain yield (RY) using the Cate-Nelson procedure, which allows estimating a CC as a function of the minimum square sum (Cate and Nelson, 1971). This approach classifies the Y-axis variable in two quadrants with a minimum error, determined arbitrarily in a concentration range ±5% around the estimated CC. Figures 1 to 6 show the correlation coefficients and the corresponding equations of the lineal ascendant part of the linear plateau model. The statistical analyses were managed with the program R vs. 3.5.1 (The R Foundation for Statistical Computing, 2018).
Results and Discussion
Grain yield
Maize grain yield responded significantly (P < 0.001) to the application of increasing nitrogen fertilization doses, which were 0, 120, 240, 360, and 480 kg·ha-1 producing 5.8, 11.2, 13.9, 15.7, and 18.3 Mg·ha-1, respectively. The relationship between N doses and grain yield was adjusted to a quadratic function (P < 0.01) with an adjustment coefficient (R2) of 0.86, that is, 86% of the yield was explained by the N dose applied.
Table 1 shows the CC estimated with each diagnostic method for the three phenological stages (V7, V12, R1), and in the case of the diagnostics that used the base of the stem, one CC estimated in R5 was included. Additionally, a percentage of deviation of the means was included, which considered an arbitrary range where the N concentration of the plant would be adequate.
Table 1: Critical values in different maize phenological stages as estimated in the RML by several diagnosing methods at V7, V12 and R1 by using the Linear-plateau procedure proposed by Sprent (1961) and at R5 by using the procedure proposed by Cate and Nelson (1971)†.
Diagnostic method |
Measurement unit |
V7 |
V12 |
R1 |
R5 |
||||
CC |
±5%‡ |
CC |
±5%‡ |
CC |
±5%‡ |
CC |
±5%‡ |
||
N-NO3 in central midrib sap |
mg·L-1 |
700 |
35 |
450 |
22 |
230* |
11 |
- |
|
N-NO3 in base of stem sap |
mg·L-1 |
330 |
16 |
460 |
23 |
370 |
18 |
350† |
17 |
N-NO3 in base of stem dry matter |
mg·kg-1 |
8500 |
425 |
8300 |
415 |
7000 |
350 |
2647† |
132 |
NDVI units |
NDVI |
81 |
4 |
83 |
4.1 |
80 |
4 |
- |
|
SPAD units |
SPAD |
43 |
2 |
39 |
2 |
47§ |
2 |
- |
|
Total foliar N in RML |
% N |
3.4 |
0.17 |
2.2 |
0.11 |
2.6§ |
0.13 |
- |
|
‡ Concentration ranges were set considering ±5% of each estimated critical concentration. § Samples from the leaf that envelops the jilote.
Plant Sap N-NO3 concentration in the central midrib
The plant sap N-NO3 concentration in the central midrib of the RML measured in the phenological stages V7, V12, R1 was associated to the lineal ascendant of the response expressed in RY (Sprent, 1961). The correlation coefficients (r) of this association were greater than 0.86 (Figure 1).
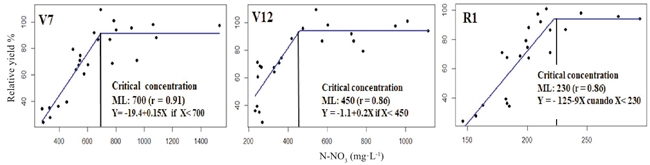
Figure 1: Modeling plant sap N-NO3 concentration in the central midrib of the RML at V7 and V12 and of the leaf wrapping the corn ear at R1 of its relationship with the relative grain yield, estimated with the Linear-plateau model (Sprent, 1961).
The CC and its adequate range of concentration in V7 was 700 ± 35 mg·L-1 of N-NO3. This result agrees with the CC proposed by Withe et al. (1996) for a yield of 15 Mg ha-1 of fresh corn. Reed and Hageman (1980) reported that approximately 20% of the total nitrate ions in V7 were found in the leaves' central midrib, whereas in V12, the plant sap N-NO3 concentration in the central midrib and its respective range was 450 ± 22 mg·L-1. When the CC and their respective ranges of adequate concentration -estimated in V7 and V12- were compared, a decrease of the second one was observed caused by the dilution effect described by Plénet and Lemaire (1999). This result may be because the expression base of the N-NO3 concentration, e.g., the dry leaf matter, increases with the plant age. At the start of the reproductive stage R1, the CC and the range considered acceptable ranges between 230 ± 11 mg·L-1 of N-NO3. This result contrasted with the CC suggested by Reisenauer (1978), 500 mg·L-1 for the same phenological stage of the sampling leaf -the wrapping of the corn ear, but in sweet corn. This difference could be because sweet corn accumulates less biomass than field corn grown for grain, showing less dilution of the N concentration. The hybrid used in this experiment was crystalline white corn and had an average height of ~2.80 m at the start of the reproductive stage, and the differences in critical concentration between sweet and crystalline corn are greater as the cycle advances.
Plant sap N-NO3 concentration of the base of the stem
The plant sap N-NO3 concentration of the maize base of the stem in different phenological stages (V7, V12, R1) was associated positively (r > 0.83) with RY in the linear-plateau model (Sprent, 1961) and were adjusted to Cate-Nelson model in R5 data (Figure 2).
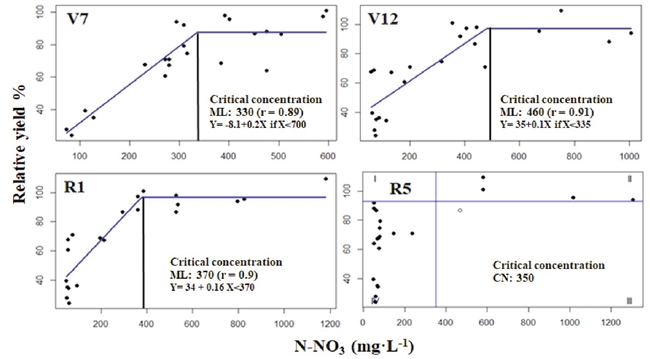
Figure 2: Modeling plant sap N-NO3 of base of stem and its relationship with relative grain yield for the phenological stages V7, V12, R1, and R5, as estimated with the linear-plateau method (Sprent, 1961) and Cate and Nelson (1971) model at R5.
The CC results estimated in the phenological stages (V7, V12, R1, and R5) ranged from 330 to 480 mg·L-1 of N-NO3, and at least the lowest limit of this range agreed with the CC reported by Justes et al. (1997). These authors assessed the relationship between nitrogen nutrition index -dimensional value between 0 and 1.8 obtained by dividing the total N concentration in the biomass by the total N critical concentration- and plant sap N-NO3 concentration from the base of the stem of the phenological stages from V7 to R1. These authors also proposed a general CC of 337 mg·L-1 N-NO3, estimated by using the Cate-Nelson technique. This value represents the minimum concentration of plant sap N-NO3 in the base of the stem, to obtain a nitrogen nutrition index similar or greater than one.
N-NO3 concentration in the base of stem dry matter
The N-NO3 concentration in the base of stem dry matter in the stages (V7, V12, R1) was associated with the relative grain yield adjusting data to the linear-plateau model (Sprent, 1961), and in R5 adjusted by using the Cate-Nelson model (Figure 3).
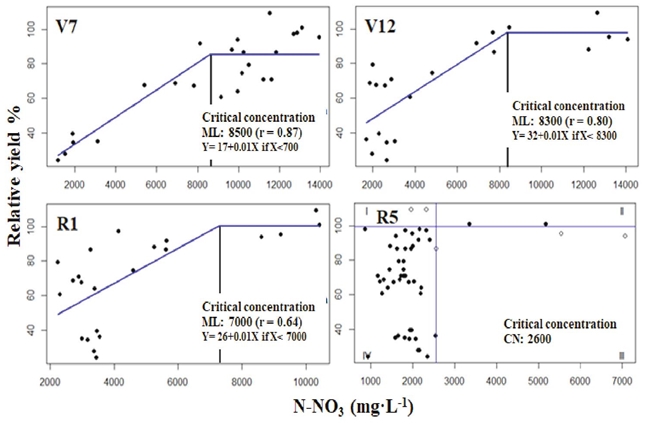
Figure 3: Modeling N-NO3 concentration in the base of stem dry matter estimated with the linear-plateau model from V7 to R1, and the critical concentration estimated with the Cate-Nelson model at R5.
The correlation coefficient of the lineal ascendant model in stages V7 and V12 was higher than 0.80 but lower in R1 (r = 0.64). The CC in stage R5 obtained from adjustment by Cate-Nelson procedure yield better results. According to Ta (1991), as much as 40% of N in corn plants were in the stem during R1. In V7, CC of N-NO3, the base of the stem and its respective range considered as adequate was 8500 ± 425 mg·kg-1, concentrations in agreement with the results reported by Sainz-Rozas, Echeverria, Herfurth, and Studdert (2001) for corn in stage V6 with a yield of 12 Mg·ha-1. The results of V7 contrasted with the CC range reported by Reuter et al. (1997) with values of 9000 to 17 800 mg·kg-1 of N-NO3 - values that corresponded to 95% of relative yield. In V12, the CC and its range resulted in being 8300 ± 415 mg·kg-1 of N-NO3 and in R1 7000 ± 350 mg·kg-1 of N-NO3. These results agree with the CC proposed by Heckman, Samulis, and Nitzsche (2002).
Notwithstanding, this coincidence should be taken with a certain reserve since these authors obtained samples from freshly harvested sweet corn at R2 and R3 stages. According to Dechorgnat et al. (2018) each corn hybrid has specific requirements in acquiring N (ion NH4 or NO3) influenced by the soil-climate condition in which the maize develops. Nitrate concentration in the dry matter of the stem's base undergoes influence of the prevailing solar radiation and soil humidity before sampling (Fox, Roth, Iversen, and Piekielek, 1989). Thus, CC could show some variation among sites and years (Sainz-Rozas et al., 2001). Due to the above, this experiment's results should be considered preliminary and require several years of additional and validated experimentation. Consequently, the CC reported with this and other methods for the vegetative stages and start of flowering may only be extrapolated regionally while more research generates new results. Extrapolation to other ecosystem conditions must be conducted with reserve.
To evaluate if the N application was moderate or excessive, during the final reproductive cycle, Binford et al. (1990) proposed performing the N-NO3 analysis in the dry matter of the base of the stem sample when the crop is close to stage R6 (physiological maturity). This N-NO3 measurement has been calibrated for different soil and climate regions: northern China (Huang, 2013); southeastern Buenos Aires, Argentina (Sainz-Rozas et al., 2001), and Pennsylvania, USA (Fox, Piekielek, and Macneal, 2001).
In the present experiment, we estimated a CC of N-NO3 in the dry matter of the stem base for the stage R5 of 2647 mg·kg-1 N-NO3: this value corresponded with 95% of the relative grain yield index. This value would be the closest one to the high limit of optimum concentration since other authors (Blackmer and Mallarino, 2000; Isla and Blackmer, 2007; Beegle and Rotz, 2009) situated this value in a range from ~700 to ~2000 mg·kg-1 of N-NO3. We can speculate that the sum of fertilization dose and N contribution to soil were higher than N demand to reach a relative grain yield (RY) of 95%, which is not strange in the area.
NDVI
The NDVI units performed on the maize plant canopy in the phenological stages (V7, V12, R1) were associated with RY and adjusted to the linear-plateau (LP) model. In the lineal part of the function, the correlation coefficient was higher than 0.70 (Figure 4).
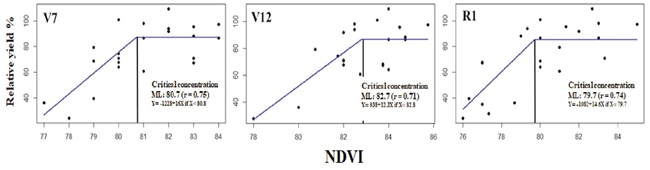
Figure 4: Relationship of NDVI with the relative grain yield of the phenological stages V7, V12, and R1, estimated with the linear-plateau model.
Since we did not measure N-NO3 concentration with this method, we proposed to call the parameter calculated critical value instead of CC. The calculated critical value of the estimated NDVI in V7 (81 units) of maize was lower but close to 83 units proposed by Yin and McClure (2013). These authors estimated this value for V12 of 80 NDVI, which is lower than the calculated in the present study (84 units), for the same stage. When the crop reached the R1 stage, the calculated value was 80 units. The discrepancy in the result agrees with that pointed out by Inman, Khosla, Reich, and Westfall (2007) and Colaço and Bramley (2018), who reported that NDVI measurements showed variation among seasons and sites due to the characteristics of each hybrid (Hatfield, Gitelson, Schepers, and Walthall, 2008), as well as population density and space between plantation rows (Maddonni, Otegui, and Cirilo, 2001). Finally, the present study results showed that NDVI explained -on average- only 53% of the relative yield variability, an exceptionally low value, that contrast with the results reported in wheat by Raun et al. (2001) and Santillano, López, Ortiz, and Raun (2013), 83%.
SPAD units in recently mature leaf
The measurements of SPAD units made in the RML in the phenological stages (V7, V12, R1) were associated with RY and adjusted to the linear-plateau model (Figure 5).
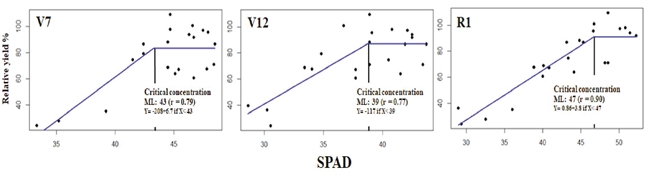
Figure 5: Relationship SPAD units with the relative grain yield in the phenological stages V7, V12 in the RML, and in R1, taken in the leaf wrapping the corn ear, estimating the CC with the linear-plateau model.
The correlation coefficient (r) was higher than 0.78 in all cases. In stage V7, a CV of 43 SPAD units was estimated, slightly lower than the calculated critical value proposed by Edalat, Naderi, and Ega (2019), i. e. 48 SPAD units. In V12, the CV, 39 SPAD units, had a lower value than those defined by those authors of 51 SPAD units. In stage R1, the measurement performed on the leaf wrapping the corn ear was 47 SPAD units - a lower value than that defined by Shapiro, Attia, Ulloa, and Mainz (2016) of 57 SPAD units. The contrast in the results reinforces the conclusion that other reports (Schepers et al., 1992; Xiong et al., 2015) documenting that SPAD measurements were an indirect measurement of N supply affected by environmental factors, such as changes in light intensity in short periods, specific green color characteristics of each hybrid and N fertilization regime. This value must be related to the SPAD index of one well-supplied N band to make sense.
Total N in the RML
Total N concentration of the RML collected at the phenological stages V7, V12, R1 was associated with relative grain yield when they were lower than the critical concentration. In all the cases a correlation coefficient higher than 0.70 was obtained (Figure 6).
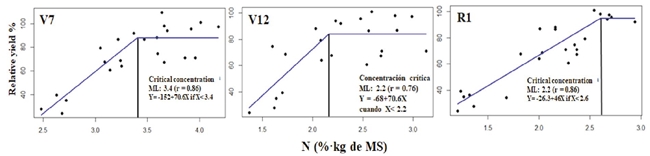
Figure 6: Relationship between total N in the RML and the relative grain yield at the phenological stages V7, V12, R1. In R1 the sample was taken from the leaf wrapping the feminine flower, and CC was estimated with the linear-plateau model.
In stage V7, we estimated a CC of 3.4% ± 0.17 N. This result agrees with the CC reported by Plénet and Lemaire (1999), Campbell (2013), and Castellanos et al. (2019). At the stage V12, the CC was 2.2% ± 0.11% of N, which is slightly lower than that proposed by Castellanos et al. (2019) of 2.5 at 3.5% of N. This difference is probably due to the ability of the hybrid to acquire N, which depends on competence (population density, intrinsic development characteristics of the root system, and soil conditions of the site and N availability in the soil. In stage R1, the CC was 2.6%. This result agreed with the CC proposed by Reuter et al., 1997), Plénet and Lemaire (1999), and Castellanos et al. (2019).
Conclusions
Diagnostic methods for characterizing the N nutritional status in maize crop in El Bajio, Guanajuato, Mexico with potential use under field conditions were successfully calibrated for three different phenological development stages. The critical N-NO3 concentration measured under field conditions with semi quantitative and with quantitative methods conducted in the laboratory presented an acceptable association with the relative yields of maize fertilized with increasing N doses. The plant sap N-NO3 of the central leaf midrib -usually the recently mature leaf- and the N-NO3 measured in the plant sap of the stem base were associated with relative grain yield with a coefficient of correlation higher than 0.80. The measurement obtained with optical sensors (SPAD and GreenSeeker) showed a lesser association with the relative yields although with coefficients of correlation higher than 0.77. The CC of total N measured in the recently mature leaf in the phenological stages (V7, V12, R1) in general agreed with those suggested by other authors. Consequently, maize producers and technical advisors from the Bajio region in Mexico now have references for diagnosing N maize status by different analytical techniques and various development stages. These references allow them to verify the nutritional N status maintained by the plant and take the corrective measurements, so this element does not constitute a limiting factor for the crop to reach the maximum yield possible, allowed by the agroecosystem and at the same time gives better information for not to exceed the N fertilization with adverse effects in the environment.
More studies are required to confirm the CC established and to identify variations among year, environments, and commercial corn hybrids, as well as to validate relative grain yield prediction.
Data Availability
The sets of data used and /or analyzed during the current study are available from the corresponding author.
Funding
This study was conducted through financial support from CONACYT to carry out Master degree studies. The experiments, analyses and equipment were financed by Fertilab® and PROAIN®, Mexican enterprises.
Authors’ Contribution
Conceived, designed, and performed the experiments, analyzed the data, prepared the figures and tables, and wrote and approved the final manuscript draft: E.R.C. Conceived and designed the experiments, analyzed the data, prepared the figures and tables, supervised the writing, and edited the final draft: J.D.E. Conceived, designed, and supervised the experiments, analyzed the data, prepared the figures and tables, corrected, and edited the manuscript: J.Z.C.R.

