


 text new page (beta)
 English (pdf)
 Article in xml format
 Article references
 Send this article by e-mail
 Cited by SciELO
  Similars in
SciELO
Similars in
SciELO 
 Permalink
Introduction
El Niño-Southern Oscillation (ENSO) consists of temperature increases and decreases of the sea-surface water in the Tropical (Equatorial) Pacific Ocean and may occur in two phases known as El Niño and La Niña. Both, El Niño, and La Niña are atmospheric phenomena characterized by temperature anomalies in tropical areas of the Pacific Ocean and changing wind and precipitation patterns in tropical and mid-latitude regions (Almeida Silva et al., 2020). Temperature increases are linked to El Niño events as defined by weak winds, whereas temperature decreases are related to La Niña events characterized by intense winds. Those extreme events may have potential impacts on agricultural systems through different ways as briefly described as follows.
It is widely recognized that precipitation, temperature, air humidity, and winds present large intra and interannual variability linked with ENSO. Then, relationships among ENSO, precipitation and temperature may provide relevant causal connections with agricultural production. This can be explained because ENSO extreme events may intensify dangerous climatic conditions. These circumstances could be, for instance, causes of warm and humid conditions, which may result in the spread of crop diseases (Iglesias and Rosenzweig, 2007). In addition, it could be possible crop yield increases or decreases depending on the prevailing phase of ENSO.
In summary, effects of ENSO events could be measured as their’ immediately impact on crop yields. For instance, corn yields of the Southeastern United States of America changed among ENSO phases (El Niño -warm-, Neutral and La Niña -cold-) from 1971 to 2013 (Mourtzinis et al., 2016); noteworthy, greater corn yields were linked with El Niño phase. The highest historical Brazilian coffee yields were generally correlated with the occurrence of El Niño (Almeida Silva et al., 2020). Nonetheless, ENSO effects on Mexico’s main crops have been scarcely studied. Then, the aim of this work is to identify significant correlations between ENSO indexes (bimonthly extended Multivariate ENSO Index -MEI.ext- or three-monthly Oceanic Niño Index -ONI-) and Mexican lemon (Citrus limonia (L.) Osbeck) or orange (Citrus sinensis L.) annual yield anomalies from 1980 to 2015.
Materials and Methods
Mexico’s lemon and orange annual mean yields from 1980 to 2015 were downloaded from http://infosiap.siap.gob.mx/gobmx/datosAbiertos.php (SIAP, 2017). Then, long-term trends were estimated for each time series by means of linear regression analyses using MicroSoft® Excel®, Version 14.7.1 for Mac (MicroSoft Corp., 2011), and residuals were then standardized (yearly yield standardized anomalies) as pointed out by Valdez-Cepeda et al. (2007). It is supported on the idea of removing effects that could be attributed to several technical advances, including the use of chemical fertilizers, mechanization, pesticides, and higher yielding cultivars (Valdez-Cepeda et al., 1998), among other issues.
Data of the extended multivariate ENSO Index (MEI.ext) and the Oceanic Niño Index (ONI) were downloaded from https://psl.noaa.gov/data/correlation/meiv2.data (ESRL, 2017) and https://psl.noaa.gov/data/correlation/oni.data (CPCIT, 2017), respectively. We involved those ENSO indexes because Wolter and Timlin (2011) recommended using MEI.ext for ENSO impacts research, whereas ONI has been used to demonstrate its correlation with meteorological events such as fire activity in the eastern Amazon as demonstrated by Chen et al. (2011).
By this way, Pearson correlation coefficients (r) were estimated by considering the time series of each bi-monthly ENSO Index (MEI.ext) or three-monthly ENSO Index (ONI) and the lemon or orange yearly yield standardized anomalies to estimate their linear correlations (r’s). The r’s were estimated using MicroSoft® Excel®, Version 14.7.1 for Mac (MicroSoft Corp., 2011). All pairs of variables with significant r coefficients were used to estimate cross correlation coefficients (rc’s) as pointed out by Li and Chen (2014). The rc’s were estimated using the Minitab version 16.2.4.0 (Minitab Inc., 2013). In fact, the rc coefficient has been used to evidence teleconnections between ENSO and climatic factors; for instance, a teleconnection between ENSO and minimum temperature (Li and Chen, 2014). In addition, squared wavelet coherence plots for the strongly correlated pairs of variables (significant r’s) were developed by means of the wavelet coherence analysis as proposed by Grinsted et al. (2004). This approach was carried out with R (R Core Team, 2013). Such a technique can be used to calculate squared wavelet coherence between time series, which can be thought of as the local correlation between the time series in time frequency domain; it may allow finding locally phase locked behavior (Grinsted et al., 2004).
Results and Discussion
Correlations (r’s) between lemon yearly mean yield standardized anomalies and the MEI.ext or ONI expressions were not significant. On the other hand, orange yearly mean yield standardized anomalies were significantly correlated with the MEI.ext in its bi-monthly July-August (r = 0.382, P = 0.038) and August-September (r = 0.399, P = 0.029) expressions, and with the ONI in its three-monthly July-August-September (r = 0.381, P = 0.038), August-September-October (r = 0.404, P = 0.027) and September-October-November (r = 0.373, P = 0.042) expressions. Then, those estimated r values suggest that the ENSO effect on the Mexico’s orange yearly mean yield standardized anomalies is in an important positive way from July to November, although other factors may also have had effects.
A careful analysis of the orange yearly mean yield anomalies, July-August and August-September MEI’s, and July-August-September, August-September-October and September-October-November ONI’s behaviors (Figure 1) indicates that moderately intense (1987-1988), and very intense (1997-1998) El Niño events probably influenced in positive ways on the orange annual mean yield during those years. On the other hand, there appears that La Niña extreme events (1988-1989, 2007-2008 y 2010-2011) did not have significant effects on the orange yearly mean yield.
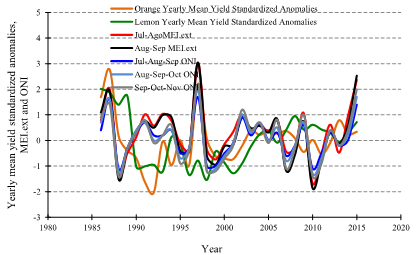
Figure 1: Mexico’s lemon and orange yearly mean yield standardized anomalies, July-August and August-September extended multivariate El Niño-Southern Oscillation Indexes (MEI.ext), and July-August-September, August-September-October, and September-October-November Oceanic Niño Indexes (ONI) time series.
Our results are very interesting because orange harvest in Mexico is performed during two seasons: August-October (Early) and November-April (Late). So, possible effects of ENSO extreme events on orange trees may tend being favorable from developing fruits to mature fruits stages depending on the harvest season. In other words, the evidenced positive effects of El Niño on the orange yearly mean yield standardized anomalies may depend on the region or locality considering the harvest season of the case.
Therefore, a doubt about whether or not the evidenced ENSO extreme event effects remain more than 12 months starting since they started. Thus, cross correlation coefficients were estimated by involving pairs of variables significantly correlated. For instance, Figure 2 shows July-August-September ONI correlates with the Mexico’s orange annual mean yield standardized anomalies since the ENSO extreme event starts (Lag 0, rc= 0.4, P ≤ 0.05). Similar results were estimated for the remaining strongly correlated pairs of variables (data not shown). Then, those results indicate that the positive relationship may be important within a year, i.e. ENSO and the orange annual mean yield standardized anomalies can be strongly tele connected. Then, Mexican orange orchard managers/owners should have in mind this possible strong relationship to take advantage on and to avoid possible insects, weeds, and pathogens proliferation. This recommendation could be important because most pest species may be favored by warm and humid atmospheric conditions (Iglesias and Rosenzweig, 2007).
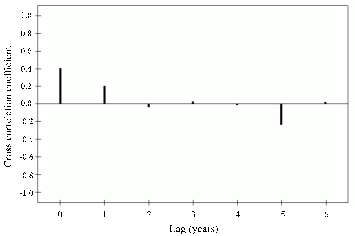
Figure 2: Cross-correlations between July-August-September Oceanic Niño Index (ONI) and Mexico’s orange annual mean yield standardized anomalies from 1980 to 2015.
July-August-September ONI and the Mexico’s orange annual mean yield standardized anomalies time series were involved in a wavelet coherence analysis (Figure 3). Results suggest their correlation is strong (P ≤ 0.05) from 1990 to 2004 at 2- to 6-yr periodicities. Notably, both phenomena were in-phase (horizontal arrows toward right) from 1990 to 2002 at a mean periodicity of 3.5 yr, and July-August-September ONI was leading the Mexico’s orange annual mean yield standardized anomalies (arrows pointing to the right-down) from 1992 to 2004 at mean periodicity of 5 yr and from 1996 to 2002 at mean periodicity of 2.5 yr. In addition, a significant correlation between both variables almost in anti-phase (arrows pointing to the left-down) is markedly noted from 2007 to 2009 at a 3-yr mean periodicity; in other words, the period 2007 to 2009 may be characterized as a short-term with dominant years when July-August-September ONI and orange yearly mean yield standardized anomalies shown opposite behaviors. It deserves be mentioned that during such a short-term took place one La Niña extreme event (2007-2008), which was followed by another (2010-2011, see Figure 1). This means La Niña effect on orange yields in Mexico may also be an important issue; thus, Mexican orchard managers/owners must have in mind such an influence could be negative.
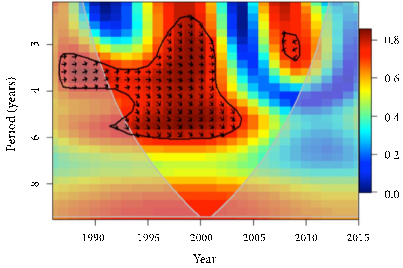
Figure 3: Squared wavelet coherence between July-August-September Oceanic Niño Index (ONI) and Mexico’s orange annual mean yield standardized anomalies time series from 1980 to 2015. The 5% significance level against red noise is shown as a thick black contour. The thick grey contour designates the cone of influence, where edge effects might distort the picture is shown as a lighter shade. The significant red section on the left shows in-phase behavior (arrows toward right), and the significant red section on the right shows anti-phase behavior (arrows toward left).
In general, our results are compelling evidence about El Niño positive effects on orange annual mean yields and agree with that from Mourtzinis et al. (2016) and Almeida Silva et al. (2020). In fact, Mourtzinis et al. (2016) consigned that corn yield of the Southeastern United States of America changed among ENSO phases from 1971 to 2013, and the greater yields were strongly linked with El Niño phase. Almeida Silva et al. (2020) found that the highest historical Brazilian coffee yields were generally correlated with the occurrence of El Niño. Then, our results support the idea about ENSO effects on crop yields at various regions around the world; this could be linked to ENSO influences seasonal precipitation in several places (Roy and Kripalani, 2019) and other atmospheric conditions (Roy et al., 2018).
Our novel and preliminary findings suggest that there remain unknown ENSO impacts on orange yields from main orange growing areas/regions throughout the country, and the underlying involved climatic mechanisms. Such a knowledge can be useful to develop strategies for orange varieties adaptation and orchard management addressed to Mexico’s regions (and localities) by means of quantification of ENSO effects on climatic conditions (e.g. temperature, maximum and minimum extreme temperatures, total and seasonal rainfall, and air humidity) or ENSO effects during specific time linked to orange trees’ phenological stages. That kind of strategies could also be useful in the cases of other perennial crops and species with growing seasons lower than a year.
Conclusions
MEI.ext and ONI were no correlated with Mexico’s lemon annual mean yield anomalies. On the other hand, July-August and August-September extended Multivariate El Niño-Southern Oscillation Indexes, and July-August-September, August-September-October and September-October-November Oceanic Niño Indexes were associated with Mexico’s orange annual mean yield anomalies when both phenomena were in-phase, especially from July to November during the 1990-2004 period. The main effect may correspond to an occurred very intense (1997-1998) El Niño event. Such an effect should be linked to the greater orange yields registered during that period (1990 to 2004). In addition, the period 2007 to 2009 may be characterized as a short-term with dominant years when ENSO and orange yearly mean yield standardized anomalies shown opposite behaviors. During such a short-term took place one La Niña extreme event (2007-2008) followed by another (2010-2011). This means La Niña effect on orange yields in Mexico may be an important issue. Future research works should dedicate efforts to further comprehension on possible relationships between ENSO indexes and Mexico’s orange yields at local or regional levels to provide strong elements to decision makers, i.e. orchard managers and owners.
Data Availability
Mexico’s lemon and orange annual mean yields from 1980 to 2015 are available at infosiap.siap.gob.mx/gobmx/datosAbiertos.php. The extended multivariate ENSO Index (MEI.ext) and the Oceanic Niño Index (ONI) data are available at https://psl.noaa.gov/data/correlation/meiv2.data and https://psl.noaa.gov/data/correlation/oni.data, respectively.
Authors Contributions
Conceived the study: Ricardo David Valdez-Cepeda, Fidel Blanco-Macías, Miguel Márquez-Madrid, Julián Cerano-Paredes. Analyzed the data: Ricardo David Valdez-Cepeda, Julián Cerano-Paredes, Rafael Magallanes-Quintanar. Wrote the manuscript: Ricardo David Valdez-Cepeda, Fidel Blanco-Macías, Martín Martínez-Salvador. All authors reviewed the manuscript.

