


 nova página do texto(beta)
 Inglês (pdf)
 Artigo em XML
 Referências do artigo
 Enviar este artigo por email
 Citado por SciELO
  Similares em
SciELO
Similares em
SciELO 
 Permalink
INTRODUCTION
Wastewater (produced water) is a byproduct of oil and natural gas extraction industry, originated in the formations holding oil and gas or from the water previously injected for oil and gas extraction (Clark and Veil, 2009; Martel-Valles et al., 2016). Physicochemical composition of the produced water varies considerably according to the geographic location, the geologic formation, the type of hydrocarbon and the lifetime of a reservoir (Clark and Veil, 2009). Produced water with high salinity can reach until five or six times the total dissolved solids of seawater (Martel-Valles et al., 2016). According to Mexican Official Standard NOM-143-SEMARNAT-2003 (2005) and (Martel-Valles et al., 2013, 2014), wastewater contains compounds of low molecular weight, such as BTEX (benzene, toluene, etilbenzene, xylene), organic acids, condensates, oils, fats, polycyclic aromatic hydrocarbons (PAHs), and phenols. Most oil producing countries do not use secondary wastewaters, due to most reservoirs have high amounts of salts and hydrocarbons (Veil et al., 2004).
Agriculture uses 76.9% of available fresh water, which comes from groundwater reservoirs, being overexploited the most of these (CONAGUA, 2016). Wastewater characterization has been suggested by oil industry in order to determine its potential use in productive activities (NOM-143-SEMARNAT-2003, 2005; Martel-Valles et al., 2016). Produced water contains minerals essential for plant nutrition such as K, Ca, Mg, Na, Zn, Cu, SO4, CO3, Cl, and NO3, among others. Produced water can be used to irrigate crop plants at low salinity conditions, however the hydrocarbons of produced water can be toxic to plants (Martel-Valles et al., 2014, 2016). According to NOM-001-ECOL-1996 (1997) the maximum permissible limits of heavy metals and cyanides in wastewater discharges in soils for agricultural use are 0.005, 0.05, 0.2, 0.5, 0.5, 2, 2, 4 and 10 mg L-1 for Hg, Cd, As, Cr, Pb, Ni, CN-, Cu and Zn, respectively.
Maximum permissible limit for hydrocarbons in produced water discharge is 15 mg L-1 for freshwater collection systems and 40 mg L-1 for coastal waters and marine areas (NOM-143-SEMARNAT-2003, 2005). Produced water with low hydrocarbon concentration can be used for irrigation in agricultural soils, and can stimulate the plant growth (Martínez and López, 2001).
Hydrocarbons are chemical organic compounds that consist of carbon and hydrogen atoms (NOM-138-SERMANAT/SSAI-2012, 2013), as result of pyrolysis process to produce energy fuels from the addition of heat and temperature (Demirbas, 2008). Hydrocarbons are divided in light (LHF), middle (MHF) and heavy hydrocarbon fraction (HHF), with linear chain molecules of C5 to C10, C10 to C28, and C28 to C40 carbon atoms, respectively (Figure 1). Depending on the distillation process and boiling ranges, the main petroleum products are diesel fuel, gasoline, jet fuel, and kerosene (Herod et al., 2007). Benzene, toluene, ethylbenzene, and xylene (BTEX) are components of crude oil and gasoline (NOM-138-SERMANAT/SSAI-2012, 2013).
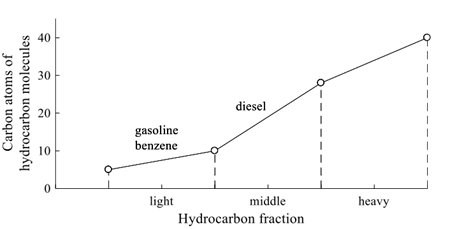
Figure 1: Hydrocarbon fraction according to molecule linear chain of carbon atoms (built from NOM-138-SERMANAT/SSAI-2012, 2013).
Hydrocarbons represent an ecological risk for terrestrial and aquatic flora and fauna (Heiss-Blanquet et al., 2005), through direct ingestion or contact, absorption, uptake, and inhalation of vapors and particles (Sri Ranjan et al., 2006). Light or volatile hydrocarbons, such as BTEX imply a risk of air pollution (Saval et al., 2004), whereas gasoline and diesel pollute soil and groundwater (Altamirano-Sánchez and Fernández-Villagómez, 2001).
Hydrocarbons in agricultural soils cause root asphyxia, reduce soil fertility, subtract vigor to plant growth, and reduce the yield (Bravo, 2005), inhibit germination and reduce vegetal growth and plant biomass (Rivera-Cruz and Trujillo-Narcía, 2004), and at high concentrations (45 to 70%) disrupt the water capture and reduce the field capacity (Adams-Schroeder, 1999). They also represent a significant risk to populations of microorganisms responsible for biogeochemical processes (Joner et al., 2006). Benzenes are carcinogenic due to their hydroxylated metabolites, cause leukemia in humans when drinking water contains benzene at 0.1 mg L-1 (FAO/WHO, 2011).
Several studies show the effects of using oil-contaminated water for crop irrigation. Jackson and Myers (2002) applied connate water in tomato and lettuce plants and reported reductions in mineral absorption and decreased production. Martel-Valles et al. (2013) used connate water to irrigate tomato plants and reported that its use was feasible, although with biomass reduction and nutritional imbalances. Similarly, Martel-Valles et al. (2014) showed that plants irrigated with MHF-containing water decreased leaf dry weight and stem diameter without changes in fruit production, and without hydrocarbon absorption of MHF, LHF or BTEX in the fruits.
The damage caused by hydrocarbons found in produced water depends on the type of hydrocarbon (Pentreath et al., 2015) and its quantity, composition, exposure time, and physical state (Manfra et al., 2010). However, the presence of hydrocarbon mixtures and other compounds in produced water makes it difficult to distinguish the characteristic damage caused by each component to the plants (Martel-Valles et al., 2014, 2016). Consequently, the objective of this study was to evaluate the impact of applying three different types of hydrocarbons to the substrate, i.e., diesel at 20 and 25 mg L-1, gasoline at 40, 50, and 60 mg L-1, and benzene at 75 mg L-1. Specifically, the chemical characteristics of the irrigation leachate were determined, as well as the plant morphological variables, and mineral distribution in the root, stem, leaf and fruit of tomato plants in both the flowering and fruiting stages.
MATERIALS AND METHODS
Experimental Site and Used Crop
The experiment was conducted in a greenhouse at Agrarian Autonomous University Antonio Narro in Saltillo, Mexico: 25° 22’ N, 101° 00’ W, altitude 1760 m. The crop cycle extended from 14 February to 17 July 2015. Seeds of beefsteak tomato (Solanum lycopersicum L.) cv. Montecarlo with an indeterminate growth habit were seeded in polystyrene trays. After 31 days, seedlings were transplanted into black, 16 L, rigid polyethylene containers, using a mixture of peat moss and perlite as the substrate (1:1 v/v). Before transplanting the plants were irrigated for 14 days with Steiner’s nutrient solution at 25% concentration (Steiner, 1961).
Crop Establishment
Plant irrigation was carried out three times a day (09:00, 13:00, and 18:00 h) using a drip irrigation system with high-flow outlets. Steiner’s nutrient solution was applied during the f irst two irrigation events; only water was used in the last irrigation event. Each plant received 500 mL of irrigation water per day. The concentration of Steiner’s nutrient solution was adjusted according to plant growth: 25, 50, 75 and 100% concentration was used 14, 32, 50 and 80 days after transplanting (DAT), respectively. The pH of the nutrient solution was maintained at 6.5 by adding the necessary quantity of concentrated (94%) H2SO4.
Treatments and Hydrocarbon Concentrations
The experiment consisted of seven treatments: a control and six hydrocarbons concentrations: diesel 20 and 25 mg L-1, Magna gasoline 40, 50 and 60 mg L-1, and benzene 75 mg L-1. These concentrations were set based on the results of previous studies (Martel-Valles et al., 2013, 2014), and exceed the limit of 15 mg L-1of hydrocarbons discharged in agricultural soils at monthly weighted average, established by the Mexican Official Standards NOM-138-SEMARNAT/SSAI-2012 (2013) and NOM-001-ECOL-1996 (1997). Hydrocarbon concentrations were computed for a volume of 500 mL per plant per day throughout the experiment, and were applied during the third irrigation event by using a syringe. Crop management consisted of performing standard tasks of pruning and training recommended for the cultivation of greenhouse tomato. applied to the substrate, that is.
pH and EC of Irrigation Leachate
Both pH and electrical conductivity (EC) were monitored in the irrigation leachate. Plastic containers placed beneath the pots in five plants per treatment were used. The measurements were conducted from 14 to 128 DAT after the third irrigation event by using a portable HI98130 pH/Conductivity/TDS Tester (Hanna Instruments Inc.).
Morphological Variables
To evaluate the morphological variables, four plants per treatment were randomly selected at the flowering stage (32 DAT), and five plants per treatment were randomly selected at the fruiting stage (128 DAT). The following measurements were collected: height, measured from the stem base to the apex; stem diameter; and the dry weight of the leaves, stems and fruits. Dry fruit weight was measured on ripe fruits from ive plants per treatment. The measurements were performed weekly from first- through sixth-cluster (93 to 128 DAT). The samples were dried in an oven at 60 °C for 72 h. The fruit dry weight per plant was computed as the sum of the six samplings.
Mineral Concentration
Determination of minerals (N, P, K, Ca, Mg, Na, Fe, Cu, Zn, Mn, Mo, Ni, Cd, and Pb) in the root, stem, and leaf at the flowering and fruiting stages was carried out on the same plants selected for the determination of the morphological variables, at 32 and 128 DAT. The samples were dried and subjected to acid digestion (AOAC, 1980) before analysis using an Optima 8300 ICP‑OES plasma emission spectrophotometer (Perkin Elmer Inc.). Nitrogen was determined using the micro-Kjeldahl method (AOAC, 1980). Determination of fruit minerals was carried out using the same techniques described for the plant roots, stems, and leaves, at 100 and 128 DAT.
Fruit Quality
To assess fruit quality, five ripe fruits from five plants per treatment were randomly selected at 128 DAT for the determination of pH, EC, and total soluble solids (TSS). Ripe, whole fruit pulp was used for the determination of these variables. A portable HI98130 pH/Conductivity/TDS Tester (Hanna Instruments Inc.) was used to measure pH and EC, while an ATAGO MASTER-BR refractometer (ATAGO U.S.A., Inc.) was used to measure TSS.
Experimental Design
Experimental design was completely randomized with 20 plants per treatment. The experimental unit was a potted plant. The variables were subjected to analysis of variance (ANOVA) and Fisher’s least significant difference (LSD) test (α ≤ 0.05) by using the R program (R Core Team, 2015).
RESULTS AND DISCUSSION
Irrigation Leachate
Table 1 shows the mean values categorized according to the results of Fisher’s test (P ≤ 0.05). Despite the fact that statistically significant differences were observed, the pH values of leachate remained close to each other, with differences of 0.09 to 0.18 of pH unit. On average the pH value was lower in the flowering stage compared to the fruiting stage. But again the differences were only a couple of tenths of pH. On the other hand, there was no significant difference that could be attributed to the presence of hydrocarbons. Regarding the EC, the main difference was found between the flowering and fructification stage, with three times higher values in the last stage. Again, there was no significant difference that could be attributed to the presence of hydrocarbons.
Table 1: Average values of irrigation leachate pH and EC in tomato plants treated with different concentrations of hydrocarbons on the flowering and fruiting stages.
| Treatment | Flowering | Fruiting | |||
|---|---|---|---|---|---|
| pH | EC | pH | EC | ||
| mg L-1 | dS m-1 | dS m-1 | |||
| Test | 7.13 a | 1.17 abc | 7.38 b | 3.07 b | |
| Diesel 20 | 7.12 ab | 1.20 a | 7.31 c | 2.97 bc | |
| Diesel 25 | 7.04 c | 1.17 abc | 7.37 b | 3.00 bc | |
| Gasoline 40 | 7.12 ab | 1.12 c | 7.33 bc | 3.01 bc | |
| Gasoline 50 | 7.11 ab | 1.20 a | 7.49 a | 3.02 bc | |
| Gasoline 60 | 7.06 bc | 1.18 ab | 7.46 a | 3.49 a | |
| Benzene 75 | 7.04 c | 1.14 bc | 7.36 bc | 2.90 c | |
Different letters in the same column indicate statistically significant differences (Fisher’s test, α ≤ 0.05).
The hydrocarbon concentrations did not modify significantly (P > 0.05) the leachate EC at the flowering stage respect to test treatment, and the exposure time allowed modify significantly (P ≤ 0.05) the EC at the fruiting stage with gasoline 60 mg L-1 (+) and benzene 75 mg L-1 (-). Whilst the leachate pH only showed significant reduction (P ≤ 0.05) with the higher concentrations of the three used hydrocarbons at the flowering stage respect to test treatment, and only changed significantly (P ≤ 0.05) with gasoline 50 and 60 mg L-1 (+) and diesel 20 mg L-1 (-) at fruiting stage (Table 1).
Adams et al. (2008) mentioned changes in soil pH and EC without indicate the quantity and percent, but this does not allow predict the behavior of pH and EC in substrate, due to different physical and biochemical properties of soil and substrate. Although the used hydrocarbon concentrations exceeded the limit of 15 mg L-1 established by the Mexican Official Standards NOM-138-SEMARNAT/SSAI-2012 (2013) and NOM-001-ECOL-1996 (1997), was not found a defined effect of light, middle and heavy hydrocarbon fractions at leachate pH and EC.
The changes observed in the leachate pH and EC were not associated with the presence of hydrocarbons, which ruled out a process of rapid root intoxication (Petenello et al., 2014) that could induce modifications in pH or EC. Benzene capability to dissolve ionic compounds is very limited, due to its very nonpolar character (Himmel et al., 2010), and similar to other hydrocarbons doesn’t modify the pH value in the leachate solution, which is a specific property of the aqueous solutions. Debye-Hückel effects diminish effective acidity level that may be reached in benzene only at concentrations higher than 1×10⁻⁶ mol L-1 (Himmel et al., 2010), however the used concentration at benzene 75 mg L-1 (9.6×10⁻⁶ mol L-1) increased the leachate acidity respect to test treatment on the flowering and fruiting stages.
Morphological Variables
Applications of LHF (gasoline and benzene) did not modify significantly (P > 0.05) the plant morphology respect to corresponding test treatments in the flowering stage (28 DAT), except gasoline 40 mg L-1 which increased significantly (P ≤ 0.05) the stem diameter. MHF modified significantly (P ≤ 0.05) the plant morphology respect to corresponding test treatments in opposite way, that is, significant increments of the stem diameter and plant height with diesel 20 mg L‑1, which can be attributed to a phenomenon known as hormesis, an adaptive feature characterized by increased responses at low concentrations of a pollutant (Rojas-Loria et al., 2012), but significant reductions of the leaf and stem dry weights with diesel 25 mg L-1 (Figure 2a), as has been reported by Martel-Valles et al. (2013, 2014).
In the fruiting stage (132 DAT) the hydrocarbon concentrations did not modify significantly (P > 0.05) the fruit dry weight and stem diameter respect to corresponding test treatments. MHF did not modify significantly (P > 0.05) the plant morphology respect to corresponding test treatments, except diesel 25 mg L‑1, which decreased significantly the leaf dry weight. LHF modified significantly (P ≤ 0.05) the plant morphology respect to corresponding test treatments in opposite way, that is, significant reductions of the leaf dry weight (gasoline 50 mg L-1) and stem dry weight (gasoline 40, 50 mg L-1 and benzene 75 mg L-1), and significant increments of the plant height (gasoline 50 mg L-1) (Figure 2b). The stem dry weight and plant height decreased in response to benzene application due to the plant stress caused by high benzene concentrations (Pessarakli, 2011). The negative effects of gasoline in the leaf and stem dry weights, are surely related to gasoline toxicity (Quiñones-Aguilar et al., 2003) and to changes in plant nutrient availability (Holwerda, 2006).
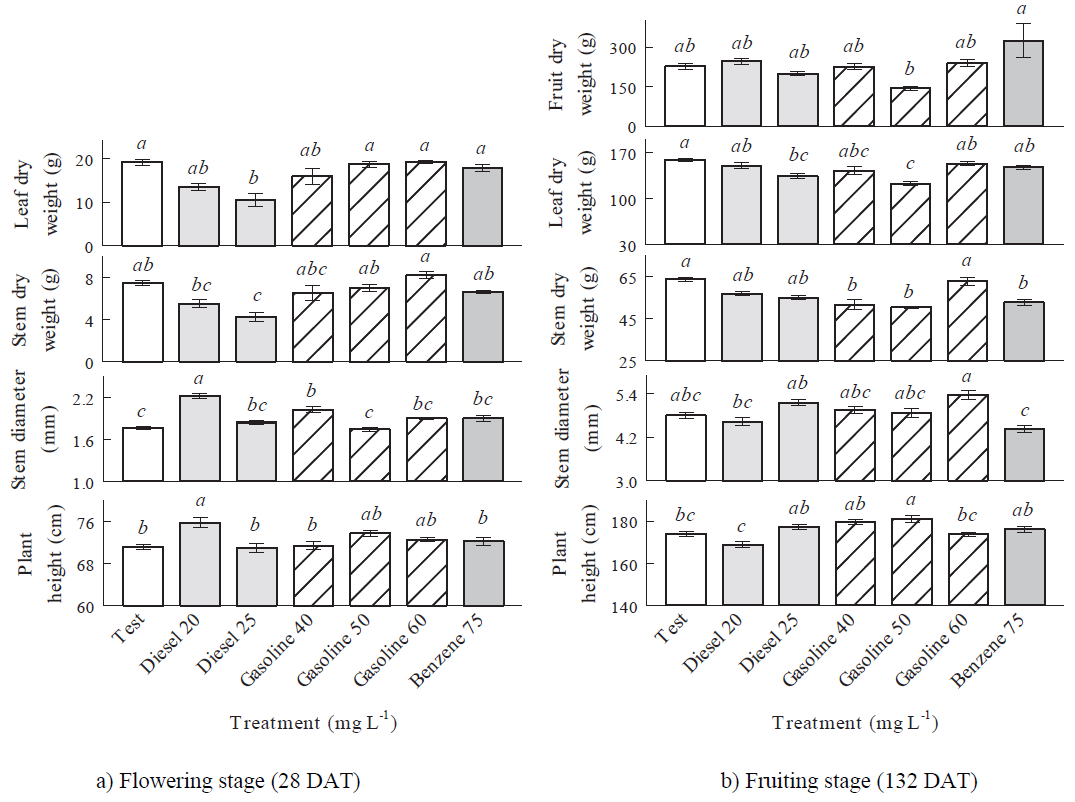
Figure 2: Mean values and standard error of morphological variables evaluated in tomato plants treated with hydrocarbons to different concentrations. Different letters above the bars in the same variable in each growth stage indicate significant differences (Fisher’s test, α ≤ 0.05).
Exposure time from flowering stage (28 DAT) to fruiting stage (132 DAT) inhibited the effect of MHF in the plant morphology, except in the leaf dry weight (diesel 25 mg L-1), while the effect of LHF was inhibited in the stem diameter (gasoline 40 mg L-1), affected negatively the leaf dry weight (gasoline 50 mg L-1), and the stem dry weight (gasoline 40, 50 mg L-1 and benzene 75 mg L-1), and affected positively the plant height (gasoline 50 mg L-1) (Figures 2a and 2b).
Mineral Concentration
In the fruiting stage (132 DAT), the hydrocarbons modified the mineral concentration in the roots with significant increments (P ≤ 0.05) from 54.4 > 34.7 > 29.9 > 24.8% for N gasoline > P benzene > P diesel > Ca benzene, and significant reductions (P ≤ 0.05) from 40.6 > 33.7 > 23.9% for Na benzene > Na gasoline > Mg gasoline, respect to corresponding test treatments. The significant differences (P ≤ 0.05) of mineral concentrations in the root were due to the fact that the hydrocarbons were applied in the substrate, as reported for other pollutants such as heavy metals (Dubey et al., 2014).
In the stem were observed significant increments (P ≤ 0.05) greater than 100% for Fe gasoline > Mn gasoline, and significant reductions (P ≤ 0.05) from 83.7 > 76.5 > 76.0 > 54.3 > 50.1 > 41.5 > 34.0 > 29.5 > 26.4% for Cu gasoline > Cu benzene > Cu diesel > Mg gasoline > Zn gasoline > Zn diesel > Mg benzene > Mg diesel > Ca gasoline, respect to corresponding test treatments. The significant effect of hydrocarbon in the mineral concentration of the stem, suggests the involvement of signaling between the root tissues and the stems without changes in the absorption of the minerals (Moya et al., 2015). The increase of the stem diameter and crop height with diesel 20 mg L-1, maybe related to the possible presence of arbuscular mycorrhizal fungi associated to remediation of diesel polluted soil, which can stimulate early growth stages in seedlings (Trejo et al., 2013), and plant growth when applied below the toxic limits (Pessarakli, 2011) and depending on the concentration and exposure time (Martínez and López, 2001).
In the leaves were observed significant increments (P ≤ 0.05) from 59.0 > 47.2 > 46.3 > 42.6% for Fe gasoline > Mg gasoline > N diesel > Mn gasoline, and a significant decrement (P ≤ 0.05) in 47.8% for Na with gasoline, respect to corresponding test treatments (Table 2).
In the fruiting stage, the exposure time of hydrocarbons allowed the expression of the observed responses (Manfra et al., 2010), and the consequent significant modifying of the mineral concentration in the different plant parts, analogous to those described by Martel-Valles et al. (2013, 2014). It is possible that hydrocarbons may modify signaling between different plant organs by means of growth regulators (Stirk and van Staden, 2014) or through changes in metabolism (Hermans et al., 2006). Martel-Valles et al. (2013) did not found detectable amounts of hydrocarbons in tomato fruits, which reject the theory about the hydrocarbon can be uptaked by the roots and transported to the stems, leaves and fruit, where their toxicity would modify the cell activity, changing the mineral concentration and other metabolic processes.
Table 2: Mineral concentration in the root, stem and leaf of tomato plants treated with hydrocarbons to different concentrations on the fruiting stage (132 DAT).
| Treatment | N | P | K | Ca | Mg | Na | Fe | Cu | Zn | Mn |
|---|---|---|---|---|---|---|---|---|---|---|
| mg L-1 | - - - - - - - - - - - - - g kg-1 - - - - - - - - - - - - - | - - - - - - - - mg kg-1 - - - - - - - - - | ||||||||
| Root | ||||||||||
| Test | 14.51bc | 2.51c | 15.50a | 22.97b | 3.85ab | 2.76a | 261.27ab | 18.42a | 74.94ab | 128.54a |
| Diesel 20 | 16.60b | 3.07abc | 16.29a | 24.92b | 3.82ab | 2.54ab | 192.17b | 18.58a | 82.50a | 82.38a |
| Diesel 25 | 15.42bc | 3.26ab | 16.06a | 23.10b | 3.87a | 2.35abc | 331.41a | 18.68a | 83.16a | 115.32a |
| Gasoline 40 | 13.93bc | 2.52bc | 16.32a | 22.17b | 3.12bc | 2.05abc | 258.25ab | 14.98a | 76.07ab | 107.08a |
| Gasoline 50 | 22.40a | 2.70abc | 16.58a | 22.78b | 3.24abc | 2.00abc | 215.05ab | 16.06a | 100.62a | 118.22a |
| Gasoline 60 | 12.75c | 2.65abc | 18.52a | 22.73b | 2.93c | 1.83bc | 235.46ab | 16.34a | 88.76a | 121.26a |
| Benzene 75 | 13.83bc | 3.38a | 15.36a | 28.66a | 3.98a | 1.64c | 252.04ab | 16.34a | 45.80b | 128.83a |
| Stem | ||||||||||
| Test | 14.27a | 6.04a | 18.13a | 14.16ab | 5.80a | 0.54a | 75.06b | 40.80a | 128.54ab | 24.10b |
| Diesel 20 | 14.26a | 6.76a | 13.35a | 13.16bc | 4.15bc | 0.41a | 30.58b | 9.78b | 84.60bc | 29.78b |
| Diesel 25 | 15.27a | 6.66a | 16.77a | 13.95ab | 4.09bc | 0.45a | 22.83b | 10.36b | 75.20c | 13.70b |
| Gasoline 40 | 11.70a | 5.51a | 13.35a | 10.42c | 2.65d | 0.33a | 20.60b | 6.64b | 64.10c | 24.54b |
| Gasoline 50 | 12.89a | 7.09a | 15.77a | 15.94ab | 5.31ab | 0.39a | 45.48b | 19.72ab | 106.42abc | 29.38b |
| Gasoline 60 | 13.45a | 7.53a | 15.90a | 16.64a | 4.15bc | 0.65a | 330.16a | 13.50b | 141.56a | 76.10a |
| Benzene 75 | 12.73a | 7.68a | 15.25a | 15.41ab | 3.83cd | 0.41a | 120.61b | 9.58b | 101.10abc | 24.94b |
| Leaf | ||||||||||
| Test | 16.82bc | 3.49a | 14.43a | 37.78ab | 3.22b | 0.46ab | 94.37b | 8.66ab | 20.28a | 246.06b |
| Diesel 20 | 14.91c | 3.11a | 20.57a | 40.03ab | 3.52ab | 0.43ab | 120.02ab | 8.64ab | 9.18a | 214.42b |
| Diesel 25 | 24.60a | 3.64a | 15.84a | 42.91ab | 3.81ab | 0.36bc | 113.03ab | 8.56ab | 6.46a | 251.90b |
| Gasoline 40 | 18.45abc | 3.51a | 17.63a | 42.35ab | 3.66ab | 0.35bc | 105.95ab | 8.20b | 6.06a | 227.16b |
| Gasoline 50 | 22.58ab | 4.82a | 23.14a | 46.02a | 4.74a | 0.52a | 150.08a | 10.42a | 20.40a | 247.54b |
| Gasoline 60 | 19.50abc | 2.69a | 21.35a | 36.68b | 3.02b | 0.24c | 122.82ab | 8.42b | 13.08a | 350.78a |
| Benzene 75 | 20.91abc | 3.40a | 15.57a | 42.73ab | 3.84ab | 0.36bc | 114.13ab | 8.46b | 5.60a | 239.20b |
Mineral concentrations are based on dry mass. Different letters in the same column in each plant organ indicate significant differences (Fisher’s LSD, α ≤ 0.05).
In the tomato fruits at 100 DAT the hydrocarbons modified significantly (P ≤ 0.05) the mineral concentrations respect to corresponding test treatments, with significant increments greater than 100% for Mn gasoline > Cu gasoline, and 85.1% for Ca gasoline, and significant decrements from 67.4 > 36.2 > 20.9% for Na gasoline > Cu benzene > P diesel.
In the tomato fruits at 128 DAT the hydrocarbons modified significantly (P ≤ 0.05) the mineral concentrations respect to corresponding test treatments, with significant increments greater than 100% for Ca gasoline, and 24.8% for N diesel, and significant decrements from 75.5 > 57.5 > 36.2 > 27.5 > 25% for Mn gasoline > Na gasoline > N gasoline > Na diesel > Na benzene.
Exposure time of hydrocarbons from 100 to 128 DAT increased the mineral concentrations of N (diesel 20 mg L-1) and Ca (gasoline 50 and 60 mg L-1), and affected negatively about the reduction of mineral concentrations of N (gasoline 50 and 60 mg L-1), Na (diesel 20 mg L-1, gasoline 40, 50 and 60 mg L-1, and benzene 75 mg L-1), and Mn (40 mg L-1) (Table 3).
Significant changes in the mineral concentrations of Mg, Fe and Zn in the fruit were not observed, which only the Fe accumulation increased significantly in the stem with gasoline 60 mg L-1, and is well known that minerals and photosynthates transported to the fruit were originated from the roots and leaves and moved through the stems (Mengel and Viro, 1974). These results suggest that changes in the mineral concentration in the different organs were independent of each other and possibly depended on other regulators or signals distinct from the mineral concentration in each organ (Hermans et al., 2006). It is advisable to expand the analytical determinations that are performed on plants treated with hydrocarbons, such as the enzyme activity and transcriptome studies, as has been reported by Mutz et al. (2013).
Table 3: Mineral concentration in the fruits of tomato plants treated with hydrocarbons to different concentrations at the 2- and 6-cluster (100 and 128 DAT).
| Treatment | N | P | K | Ca | Mg | Na | Fe | Cu | Zn | Mn |
|---|---|---|---|---|---|---|---|---|---|---|
| mg L-1 | - - - - - - - - - - - - - g kg-1 - - - - - - - - - - - - - | - - - - - - - - mg kg-1 - - - - - - - - - | ||||||||
| 100 DAT | ||||||||||
| Test | 17.85ab | 5.60a | 22.57abc | 1.14b | 1.89ab | 0.46a | 44.31a | 9.16b | 23.16a | 2.78c |
| Diesel 20 | 18.75ab | 4.43b | 17.03cd | 0.92b | 1.66b | 0.31ab | 220.98a | 8.10b | 25.18a | 4.84bc |
| Diesel 25 | 22.68a | 5.77a | 25.14ab | 1.31b | 1.95a | 0.28ab | 54.28a | 9.10b | 46.58a | 1.56c |
| Gasoline 40 | 19.86ab | 5.54a | 20.43bcd | 1.16b | 1.91a | 0.26ab | 40.92a | 9.36b | 18.08a | 2.24c |
| Gasoline 50 | 18.46ab | 5.40a | 28.88a | 2.11a | 1.85ab | 0.50a | 63.73a | 8.86b | 76.28a | 11.04a |
| Gasoline 60 | 15.12b | 5.03ab | 23.35abc | 2.05a | 1.77ab | 0.15b | 43.42a | 34.04a | 25.32a | 9.56ab |
| Benzene 75 | 23.66a | 5.28a | 14.40d | 0.94b | 1.77ab | 0.24ab | 36.96a | 8.26b | 24.96a | 1.74c |
| 128 DAT | ||||||||||
| Test | 22.22bc | 3.44a | 24.32ab | 0.79b | 1.95a | 0.40a | 187.08ab | 10.26a | 19.70ab | 14.54ab |
| Diesel 20 | 27.73a | 3.68a | 23.04b | 0.75b | 1.92a | 0.33ab | 225.77ab | 10.04a | 20.12ab | 13.20abc |
| Diesel 25 | 23.49ab | 3.30a | 27.48ab | 0.89b | 1.84a | 0.29bc | 76.45b | 8.32a | 19.14ab | 8.08bc |
| Gasoline 40 | 21.96bc | 2.96a | 25.04ab | 0.93b | 1.76a | 0.28bc | 306.10ab | 7.28a | 15.26b | 3.56c |
| Gasoline 50 | 14.18d | 3.07a | 29.13ab | 1.97a | 1.75a | 0.23cd | 296.16ab | 8.62a | 20.24a | 13.22abc |
| Gasoline 60 | 16.08d | 3.47a | 35.10a | 2.06a | 1.77a | 0.17d | 435.68a | 14.44a | 17.20ab | 22.16a |
| Benzene 75 | 17.23cd | 3.18a | 26.31ab | 0.96b | 1.69a | 0.30bc | 64.05b | 7.36a | 15.26b | 7.71bc |
Mineral concentrations are based on dry mass. Different letters in the same column in each harvest date indicate significant differences (Fisher’s LSD, α ≤ 0.05).
Gasoline showed the clearer significant changes, with increments in the Fe and Mn concentrations in stems and leaves, decrements in the Mg concentration in roots and stem, and the Na concentration in roots and leaves. At the same time, the gasoline increased the Ca concentration and decreased the Na concentration from 100 to 128 DAT on the fruiting stage. On the other hand, no matter the applied hydrocarbon, Mg was reduced in roots and stems and raised in leaves, maybe following its presence in the leaves in the form of the chlorophyll molecule.
Concentrations of Mo, Ni, Pb, and Cd were below the ICP´s limit of detection in all plant organs at the both sampling times.
Fruit pH, EC, and TDS
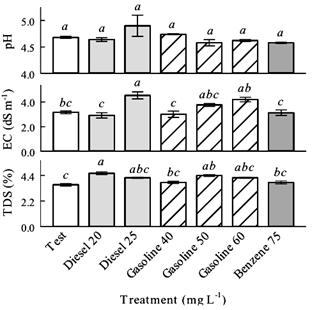
Regarding the fruit quality variables, the hydrocarbons did not modify significantly the pH (P > 0.05) respect to test treatment. EC only increased significantly (P ≤ 0.05) with diesel 25 mg L-1 respect to test treatment, equivalent to 43.4%. TDS increased significantly (P ≤ 0.05) with diesel 20 mg L-1 respect to test treatment, equivalent to 27.8%. It was observed that only the MHF increased quantitatively the pH, EC and TDS (Figure 3).
CONCLUSIONS
- Hydrocarbon concentrations did not modify the leachate EC at the flowering stage (28 DAT), and the exposure time influenced the LHF increase the leachate EC with gasoline 60 mg L-1but decrease it with benzene 75 mg L-1 at the fruiting stage (132 DAT). Leachate pH at the flowering stage decreased in the higher concentrations of the three used hydrocarbons (diesel 25 mg L-1, gasoline 60 mg L-1 and benzene 75 mg L-1), whilst in the fruiting stage the leachate pH increased with LHF and decreased with MHF. The changes observed in the leachate pH and EC were related to exposure time of hydrocarbons and not due to the presence of hydrocarbons.
- Plant morphology in the flowering stage (28 DAT) was not modified by LHF, except gasoline 40 mg L-1 increased the stem diameter. MHF showed opposite effects in the plant morphology, due to increased the stem diameter and plant height with diesel 20 mg L-1, but reduced the leaf and stem dry weights with diesel 25 mg L-1.
- In the fruiting stage (132 DAT) the hydrocarbon did not modify the fruit dry weight and stem diameter. MHF did not modify the plant morphology, except diesel 25 mg L-1 decreased the leaf dry weight. LHF modified the plant morphology in opposite way, that is, reduced the leaf dry weight (gasoline 50 mg L-1) and the stem dry weight (gasoline 40, 50 mg L-1 and benzene 75 mg L-1), and increased the plant height (gasoline 50 mg L-1).
- The mineral concentration in the fruiting stage (132 DAT) in the roots improved the N gasoline > P benzene > P diesel > Ca benzene, but were reduced the Na benzene > Na gasoline > Mg gasoline. In the stem increased the Fe gasoline > Mn gasoline, but reduced the Cu gasoline > Cu benzene > Cu diesel > Mg gasoline > Zn gasoline > Zn diesel > Mg benzene > Mg diesel > Ca gasoline. In the leaves were increased the Fe gasoline > Mg gasoline > N diesel > Mn gasoline, but decreased the Na with gasoline. The Fe and Zn mineral concentration were not affected by the hydrocarbons, and the Cu and Mn were improved on the 100 DAT.
- The mineral concentration in the tomato fruits at 100 DAT improved the Mn gasoline > Cu gasoline > Ca gasoline, but decreased the Na gasoline > Cu benzene > P diesel. Whilst at 132 DAT were increased the Ca gasoline > N diesel, but decreased the Mn gasoline > Na gasoline > N gasoline > Na diesel > Na benzene. Mineral concentrations of N showed antagonism to hydrocarbon exposure time, due to it was improved by the MHF and decreased with the LHF.
- Fruit pH, EC and TDS were increased quantitatively only by the MHF. All hydrocarbon treatments did not modify the pH, while the EC increased with diesel 25 mg L-1, and the TDS increased with diesel 20 mg L-1. In future researches related to hydrocarbons in agricultural crops, it is advisable quantify the hydrocarbon partition in the plant canopy, including the hydrocarbon translocation in the cell and vegetables tissues, stem, leaves, flowers and fruits.

