


 nova página do texto(beta)
 Inglês (pdf)
 Artigo em XML
 Referências do artigo
 Enviar este artigo por email
 Citado por SciELO
  Similares em
SciELO
Similares em
SciELO 
 Permalink
Introduction
The most frequently cropped soils of the Pampean region of Argentina are Mollisols developed on deep eolian sediments under grassland, with prevailing udic and thermic soil water content and temperature regimes. In Entre Ríos province (Argentina), the most representative Mollisol is Aquic Argiudoll (Soil Survey Staff, 2010) with a silty loam A horizon and signs of hydromorphism in the textural B horizon. The main soil-related constraint to cropping is the soil susceptibility to water erosion, with almost 50% of the area being affected. Thus, it is very important when analyzing soil structural conditions, to include soil porosity, pore size distribution, structural stability measurements, and their effects on infiltration rate and runoff.
Many studies indicate that these properties change over time (Strudley et al., 2008; Schwen et al., 2011), and have been observed at different time scales: a few hours, seasonally and annually (Bodner et al., 2008).
The dynamics of soil physical properties is affected by growth of plant roots, activity of soil organisms, rainfall and other climatic variables, but mainly by tillage and soil compaction caused by wheel traffic (Fuentes et al., 2004; Bormann and Klaassen, 2008). Studies on the effect of crop rotation and tillage on soil physical properties have found no influence of crop type but an important effect of tillage (Chang and Lindwall, 1992; Capowiez et al., 2009). As a result, non-agricultural soils and no-till systems do not undergo these cyclic changes.
Plant canopy and mulch cover in crop rotations affect the structural porosity of the soil by protecting soil aggregates from the effect of heavy rains (Blanco-Canqui et al., 2006). Crop roots also modify the properties of the porous system by generating new pores, clogging existing ones, favoring drying and local compaction of the soil, and inducing hydrophobicity on pore walls (Bodner et al., 2013a). Some studies have shown a beneficial effect of crops on aggregate stability and soil infiltration (Kabir and Koide, 2002; Liu et al., 2005), whereas others have shown a reduction in hydraulic conductivity caused by a decrease in fissure formation on the soil surface due to soil cover (Carof et al., 2005).
The number and duration of wetting and drying cycles have been also identified as key processes of aggregate formation and strength (Bodner et al., 2013b). Successive soil wetting and drying cycles lead a massive soil structure to evolve into a structure with a large number of large interconnected pores (Pires et al., 2009). Increases in macro-, meso- and micro-porosity were found as a result of wetting and drying soil cycles (Bodner et al., 2013b). By contrast, after successive wetting-drying cycles a decrease in macroporosity (Phogat and Aylmore, 1989) and lower infiltration rates (Sarmah et al., 1996) were observed, probably due to breakage and collapse of soil aggregates.
Wetting and drying cycles can affect soil structure either directly through physical and chemical processes or indirectly via their effect on microbial activity (Cosentino et al., 2006). In this sense, capillary forces enhance soil aggregation with drying, while rewetting may increase structural instability (Bodner et al., 2013a). However, effects of wetting and drying on soil structure are still unclear because this process has been shown both to strengthen and weaken structural stability (Denef et al., 2001).
In addition, soil water content also influences soil properties. An increase was found in the proportion of macropores resulting from the formation of cracks and microcracks during soil drying (Seguel and Horn, 2006). Vertisol and vertic intergrades increased in macroporosity with soil drying, resulting in a higher infiltration rate as soil moisture decreased (Lin et al., 1998). Similar behavior of various USA soil series under different land use systems were reported (Zhou et al., 2008). However, a positive correlation between infiltration and soil moisture was also found (Fuentes et al., 2004) since, when soil was moistened, pores expanded due to high soil carbon content, leading to an increase in their infiltration rate. At the same time, soil structural stability can be affected by soil water content (Perfect et al., 1990; Chan et al., 1994). In this sense, a negative relationship between these two soil characteristics has been determined.
Soils with high silt content have low sensitivity to changes in volume after soil wetting and drying. This behavior would determine that abiotic factors that affect the structure and pore system of the surface horizon of these soils are not important (Taboada et al., 2008). However, it has been shown that structural regeneration of silty soils is a product of both abiotic and biotic factors (Denef et al., 2001). In this sense, a positive response in soil porosity on the surface horizon of a Pampean grassland silty loam Typic Argiudoll (Soil Survey Staff, 2010) after a succession of wetting-drying cycles was observed (Sasal, 2012)1
Cropping in the Pampean region (Argentina) is currently carried out under no-till systems (Derpsch et al., 2010). Therefore, temporal changes in soil physical properties are mainly determined by the effect of climatic conditions, crop type and wheel traffic. Given the susceptibility to erosion of soils present in the northern area of this region (Hall et al., 1992) and particularly in Entre Rios province (Argentina), it is important to identify the factors that regulate the temporal variation of soil properties associated with infiltration and runoff.
The aim of this study was to analyze the seasonal variation of selected soil physical properties of an Aquic Argiudoll under no-tillage (NT), focusing on their relationship with water partitioning between infiltration and runoff during a typical crop sequence of the Pampean region (Argentina).
Materials and Methods
Study site
The study was carried out in an agricultural field located at the Paraná Experimental Station of the Instituto Nacional de Tecnología Agropecuaria (INTA) in Entre Ríos province (Argentina) (31º 51′ S and 60º 31′ W) (Figure 1). The region has a humid and temperate climate, with 1000 mm mean annual rainfall and mean annual temperature of 18.3 ºC. Winter temperatures rarely fall below 0 ºC. The soil is a fine, illitic, thermic Aquic Argiudoll (Soil Survey Staff, 2010) belonging to the Tezanos Pinto Series, with a silty clay loam A horizon (0-17 cm) (45 g kg−1sand, 679 g kg−1 silt and 276 g kg−1 clay) and a silty clay B21t horizon (17-34 cm) (39 g kg−1sand, 546 g kg−1 silt and 415 g kg−1 clay) (Plan Mapa de Suelos, 1998). Soil surface organic carbon content is 2% in the 0-5 cm layer, and 1.29% at 5-10 cm depth (Castiglioni et al., 2014). The A horizon exhibits a coefficient of linear extensibility (COLE) of 0.06, indicating a moderate to high sensitivity to volume change with changes in soil water content (Soil Survey Staff, 1997). The study area (0.5 ha) is located on a 4% hillside slope within a 13-ha plot (Figure 1). During the last 15 years, cropping consisted of a corn-soybean-wheat/soybean double crop rotation under no-till and in rows perpendicular to the slope to prevent soil water erosion. During the study period (2 years) crop rotation was a double-crop wheat/soybean in the first year followed by corn in the second year (Table 1).
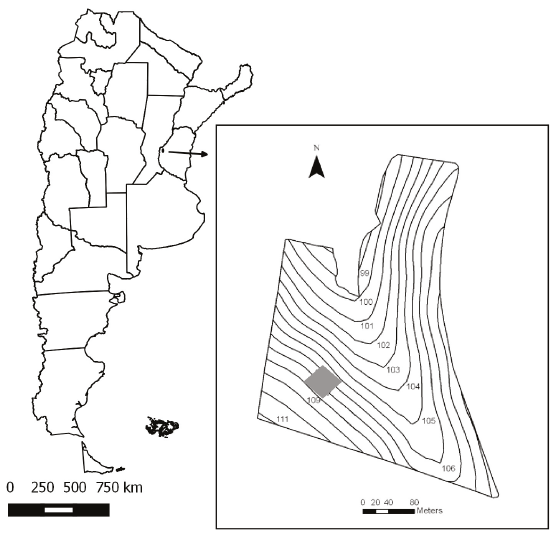
Table 1: Soil sampling dates, crop type and crop development stage during the study period.
| Date | Period | Crop | Crop stage |
|---|---|---|---|
| 01/07/2010 | F1 | Wheat | Emergence |
| 13/10/2010 | F2 | Wheat | Flowering |
| 09/12/2010 | F3 | Fallow | Postharvest |
| 09/03/2011 | F4 | Soybean | Small beans |
| 04/08/2011 | F5 | Fallow | Postharvest |
| 13/12/2011 | F6 | Corn | Vegetative (V6) |
Soil sampling and measurements
Soil samples were taken at six different times during the crop rotation cycle (Table 1) to evaluate the seasonal effects on soil properties. On each sampling date, three replicates of soil surface samples (0-5 cm depth) were taken at random within the sampling area (0.5 ha) and the following variables determined: soil water content (SWC), bulk density (BD), pore size distribution and structural stability. At these times (Table 1), water infiltration and runoff were determined in the field with a rainfall simulator.
Soil water content, bulk density and pore size distribution
Soil water content (SWC) was measured on a mass basis (Gardner, 1986), bulk density (BD) was evaluated by the core method (Blake and Hartge, 1986) on undisturbed soil samples taken with 0.05 m long and 0.05 m diameter cylinder cores, and pore size distribution was estimated with undisturbed soil cores of 0.05 m long and 0.05 m in diameter. In the latter case, the soil was saturated slowly under vacuum conditions over 24 hours to minimize structural breakdown, and subsequently brought to -6 kPa matric potential using a suction table and to -33 kPa matric potential by means of pressure plates (Klute, 1986). Soil water retention was expressed in terms of volumetric water content using bulk density for the conversion. Based on the assumption that the soil pore space consists of capillary tubes, the pore effective diameter that corresponds to an applied tension was calculated according to the Young-Laplace equation (Tuller et al., 1999). Soil pores were classified as mesopores, i.e. those with an effective diameter between 10 and 50 µm, and macropores, i.e. those with an effective diameter greater than 50 µm.
Soil structural stability
Structural stability was analyzed on disturbed soil samples (De Leenheer and De Boodt, 1958). Aggregates smaller than 8 mm were dry-sieved by hand with a nest of three sieves with mesh apertures of 4.8, 3 and 2 mm. The mass fraction remaining on each sieve was multiplied by the mean mesh aperture of the adjacent sieves. Each of these values was added to calculate the mean weight diameter of aggregates between 8 and 2 mm (MWDD). Then, a proportional mass of aggregates of each class (8-4.8, 4.8-3 and 3-2 mm) similar to that obtained in the dry sieving were moistened by dripping to field capacity, followed by 24 h incubation. After that, each category of aggregates was placed on the corresponding sieve within a sieve column with the following mesh apertures: 4.8, 3, 2, 1, 0.5 and 0.25 mm. Aggregates were then submerged in water and sieved for 5 min. After drying at 105 °C the soil remaining on each sieve was weighed. The mass fraction remaining on each sieve after sieving multiplied by the mean mesh aperture of the adjacent sieves was added to calculate the mean weighted diameter of wet-sieved aggregates smaller than 8 mm (MWDW). The change in aggregates mean weighted diameter (CMWD) was calculated as the difference between MWDD and MWDW. This was considered an indicator of soil structural stability. Thus, the greater the CMWD values, the lower the soil structural stability.
Water infiltration and runoff
To separate the effect of a given soil physical condition on infiltration related to the sum of crop coverage and soil physical condition, rain simulations were carried out on bare and covered soil (crop canopy + stubble), using a rainfall simulator over a 0.25 m2 plot (Irurtia and Mon, 1994). Bare soil was obtained by manually removing the stubble from the soil surface, and as the crop grew, aerial biomass was removed by cutting the stems with scissors. At each sampling time during the crop rotation (Table 1), three replicates were carried out in the same field (three in bare and three in covered soil) where the samples for the other variables had been collected. The rainfall simulator used was 1.5 m high, having a drop former that produced droplets of an average 4.7 mm diameter and a falling rate of 5.04 m s-1. Rain simulations lasted an hour with constant intensity of 60 mm h-1. The infiltration rate, defined as the difference in millimeters between rainfall and runoff generated, was calculated every 5 min. The runoff coefficient (RC) was calculated taking into account total water runoff and amount of rainfall during the 1-h-long rain simulation. We also determined the equilibrium infiltration rate (EIR), averaging the last three infiltration rates calculated before rain simulation ended.
Weather parameters
To relate soil variables to weather conditions, we considered total rain fallen 5, 10 and 15 days prior to each sampling date (R5, R10, R15) and the average mean daily temperature of the 5, 10, 15 and 30 days prior each sampling date (T5, T10, T15, T30), recorded at a conventional weather station located 500 m from the study area (Agrometeorological Observatory INTA - EEA Paraná, Argentina).
Statistical methods
We used analysis of variance (ANOVA) to compare the six sampling dates with three replications taken at random, to determine the seasonal effects on soil physical properties. When effects were significant at a level of 0.05, means were tested with the Tukey test. Pearson’s correlation analysis was performed between soil moisture content and mean weighted diameter of soil aggregates, determined on each sampling date, with weather parameters. Also, a correlation analysis was carried out between the runoff coefficient and the equilibrium infiltration rate with weather and soil variables. To perform a multiple linear regression analysis, we selected those significant variables that presented high correlation coefficients. At the same time, the step wise method was used to select the variables that made up the most representative multiple linear regression model. INFOSTAT software (Di Rienzo et al., 2015) was used.
Results and Discussion
In December and March (periods F3, F4 and F6), SWC was lower than the permanent wilting point (0.17 g g-1). It was close to field capacity (0.27 g g-1) in F1, between field capacity and permanent wilting point in F2, and above field capacity in F5 (Table 2).
Table 2: Values of soil water content, rain fallen in the 5, 10 and 15 days prior to each sampling date and mean daily temperatures of the 5, 10, 15 and 30 days prior to each sampling date.
| Date | Period | SWC | CV | R5 | R10 | R15 | T5 | T10 | T15 | T30 | |
|---|---|---|---|---|---|---|---|---|---|---|---|
| g g-1 | % | - - - - - - mm - - - - - - | - - - - - - - - - °C - - - - - - - - - | ||||||||
| 01/07/2010 | F1 | 0.27 | 6 | 2.0 | 2.0 | 11.0 | 10.0 | 11.1 | 11.4 | 12.2 | |
| 13/10/2010 | F2 | 0.22 | 5 | 0.0 | 4.4 | 12.5 | 17.3 | 17.4 | 15.7 | 16.1 | |
| 09/12/2010 | F3 | 0.10 | 9 | 0.0 | 6.0 | 15.2 | 24.3 | 23.6 | 23.6 | 21.8 | |
| 09/03/2011 | F4 | 0.11 | 5 | 0.0 | 0.0 | 22.0 | 24.9 | 24.3 | 23.8 | 24.0 | |
| 04/08/2011 | F5 | 0.36 | 7 | 21.7 | 32.4 | 10.7 | 7.1 | 10.7 | 10.6 | 12.0 | |
| 13/12/2011 | F6 | 0.11 | 9 | 0.0 | 0.0 | 10.1 | 25.0 | 24.7 | 23.7 | 23.4 | |
SWC = soil water content prior to rainfall simulations. R5, R10, R15 = rain fallen during the 5, 10 and 15 days prior to each sampling date, respectively. T5, T10, T15, T30 = average daily mean temperature of the 5, 10, 15 and 30 days prior to each sampling date, respectively. CV = coefficient of variation.
Among the variables related to the previous rains, only the rainfall during the 5 days prior to sampling was correlated with soil water content (Table 3). By contrast, all correlations between SWC and mean daily temperature for up to 30 days before sampling were statistically significant (Table 3).
Table 3: Correlation coefficients between soil water content and change in mean weighted diameter of soil aggregates with rain fallen during the 5, 10 and 15 days prior to each sampling date and mean daily temperatures of the 5, 10, 15 and 30 days prior to each sampling date.
| SWC | CMWD | |
|---|---|---|
| SWC | 1.00** | 0.77ns |
| R5 | 0.80* | 0.62ns |
| R10 | 0.76ns | 0.58ns |
| R15 | -0.52ns | -0.73ns |
| T5 | -0.98** | -0.84* |
| T10 | -0.96** | -0.84* |
| T15 | -0.97** | -0.80ns |
| T30 | -0.95** | -0.83* |
*(P < 0.05), **(P < 0.01), ns = non-significant differences. SWC = soil water content prior to rainfall simulations. CMWD = change in the mean weighted diameter of soil aggregates. R5, R10, R15 = rain fallen during the 5, 10 and 15 days prior to each sampling date, respectively. T5, T10, T15, T30 = average daily mean temperature of the 5, 10, 15 and 30 days prior to each sampling date, respectively.
A multiple linear regression that fitted the relationship between SWC and R5 + T30 was established: (R2 = 0.98; mean quadratic error: 0.00038). Using this function and weather information, we estimated soil moisture dynamics during the study period (Figure 2).
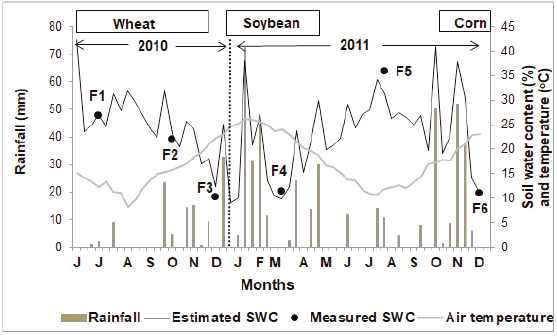
Figure 2: Measured and estimated soil water content (SWC), rainfall, mean air temperature and cropping season of the different crops.
From roughly mid-fall to early spring there were lower temperatures and scarce rainfall, and soils were more humid although with some fluctuations in water content. From early spring to mid-fall, on the other hand, temperatures were higher and precipitation and SWC fluctuations were greater, as shown by the soil moisture coefficient of variation calculated in each period: >40% in early spring to mid-fall vs. <20% in mid-autumn to early spring (Figure 2).
Table 4 shows the mean value of soil variables associated with structure and porosity. Of these, only volume occupied by pores with effective diameters between 10 and 50 µm exhibited significant differences between sampling dates (Table 4), despite differences in climatic conditions (Figure 2), different evolution of soil moisture (Figure 2), diverse crops in the rotation (Table 1, Figure 2) and measurements carried out at different crop development stages (Table 1). The lowest values (P < 0.05) were in March 2011 and the highest in October 2010 (P < 0.05). These differences did not significantly correlate with the other soil variables studied. However, the relationship between volume occupied by pores >50µm and SWC could be fitted with a linear function (R2: 0.75; mean quadratic error: 0.00028) indicating that SWC influenced macropore volume, which decreased when the soil was wetter.
Table 4: Soil physical properties determined at different times of the rotation cycle.
| Date | Period | >50 µm | CV | 10-50 µm | CV | BD | CV | CMWD | CV |
|---|---|---|---|---|---|---|---|---|---|
| cm3 cm-3 | % | cm3 cm-3 | % | g cm-3 | % | mm | % | ||
| 01/07/2010 | F1 | 0.15 a | 40 | 0.15 ab | 17 | 1.33 a | 12 | 0.65 a | 32 |
| 13/10/2010 | F2 | 0.17 a | 64 | 0.16 a | 35 | 1.29 a | 17 | 0.53 a | 12 |
| 09/12/2010 | F3 | 0.20 a | 33 | 0.11 bc | 18 | 1.17 a | 12 | 0.56 a | 15 |
| 09/03/2011 | F4 | 0.18 a | 21 | 0.11 c | 15 | 1.38 a | 5 | 0.47 a | 23 |
| 04/08/2011 | F5 | 0.13 a | 34 | 0.13 abc | 19 | 1.35 a | 11 | 0.64 a | 13 |
| 13/12/2011 | F6 | 0.16 a | 41 | 0.13 abc | 36 | 1.34 a | 16 | 0.54 a | 18 |
Different lowercase letters within a column indicate significant differences (P < 0.05). >50 µm = volume occupied by pores with effective diameter larger than 50 µm. 10-50 µm = volume occupied by pores with effective diameter between 10 and 50 µm. BD = bulk density. CMWD = change in the mean weighted diameter of soil aggregates. CV = coefficient of variation.
Structural porosity is a highly dynamic property that varies on different time scales in response to crop rotation, tillage, soil wetting and drying cycles, rainfall intensity and soil compaction caused by heavy machinery (Bodner et al., 2013a). In this sense the increase in intensity of soil wetting and drying cycles favors an increase in the hydraulic parameters related to macroporosity (Bodner et al., 2013a). Other studies (Bruand and Prost, 1987; Seguel and Horn, 2006) showed an increase in the proportion of macropores during soil drying, as a result of the formation of cracks and microcracks. We were not able to show that soil wetting and drying cycles and/or the different crops present during the rotation influenced the volume occupied by pores >50 µm. However, differences in SWC at the time of sampling explained 75% of the temporal variation in this variable. This highlights the great expansion capacity of these soils, despite their high silt content.
On the other hand, and although we were unable to detect significant differences between the CMWD values in the six sampling dates, this soil property was significantly associated with the average mean daily temperature of the 5, 10 and 30 day-periods before each sampling date (T5, T10, T30) (Table 3). However, CMWD values were not correlated with rainfall of the 5, 10 and 15 days prior to each sampling date (R5, R10, R15) (Table 3). A positive linear regression (R2: 60; mean quadratic error: 0.0024) fitted the relationship between SWC and CMWD, with higher CMWD values (less structural stability) with wetter soil. The worst CMWD values (F1 and F5) coincided with low average temperatures (<13 ºC) during the days prior to sampling and with a soil water content >0.26 g g-1. By contrast, the best CMWD values (F2, F3, F4 and F6) occurred with mean temperatures higher than 16 ºC and soil moisture lower than 0.22 g g-1 during the previous days (Table 4, Figure 2).
The aggregation state is a function of the balance between the formation and degradation processes that determine soil structure, and it varies during the crop growing season (Chan et al., 1994). The trend found in our results agree with those reported by Cosentino et al. (2006), who found that soil structural stability exhibits the worst values in winter and the best in spring, and that this behavior is most strongly influenced by factors associated with climate and those dependent on carbon content of the soil.
Oscillations in estimated soil water content (Figure 2) and behavior of CMWD (Table 4) indicate that soil wetting and drying cycles did not affect aggregate stability. In this regard, the F3 and F6 periods, which exhibited equal initial soil moisture and similar previous-days temperature, had very similar CMWD values, in spite of the fact that prior to the F3 sampling, the intensity of changes in estimated soil moisture was less than that determined before F6 sampling.
In addition, we found no significant effect of crop type or crop development stage on CMWD, as different crops at different development stages (Table 1) had similar CMWD values across sampling dates (F1 and F5 on the one hand and F2, F3 and F6 on the other) (Table 4). Similarly, no effect of the crop on the structural stability in soils under NT was found by other authors (Chan et al., 1994), linking this response to the high soil structural stability obtained under NT. We also found high structural stability values for the surface soil studied, so we may assume that in our study area crop type had no effect on this variable.
The runoff coefficient (RC) and the equilibrium infiltration rate (EIR) showed significant differences between some of the studied periods (Table 5). These differences cannot be explained by different crop type or crop development stage, as no significant differences were found in RC or EIR values in covered soil between F3, F4 and F6, between F1 and F2, and between F1 and F5. In this sense, values recorded in F3, F4 and F6 corresponded to several crops (fallow, soybean, corn). For F1 vs. F2, wheat was at different phenological stages and in F1 there was a growing crop while F5 was a fallow period (Table 1).
Table 5: Runoff coefficient (RC) and equilibrium infiltration rate (EIR) values in covered and bare soil for the different periods studied.
| Date | Period | Covered soil | Bare soil | |||||||
|---|---|---|---|---|---|---|---|---|---|---|
| RC | CV | EIR | CV | RC | CV | EIR | CV | |||
| - - - - % - - - - | mm h-1 | % | - - - - % - - - - | mm h-1 | % | |||||
| 01/07/2010 | F1 | 46.0 ab | 53 | 18.9 bc | 92 | 56.0 a | 16 | 8.6 e | 64 | |
| 13/10/2010 | F2 | 10.7 bc | 173 | 46.2 ab | 47 | 26.7 b | 67 | 25.6 cd | 46 | |
| 09/12/2010 | F3 | 0.0 c | 0 | 60.0 a | 0 | 0.0 c | 0 | 60.0 a | 9 | |
| 09/03/2011 | F4 | 7.0 c | 38 | 52.8 a | 3 | 13.5 bc | 4 | 43.7 b | 14 | |
| 04/08/2011 | F5 | 70.0 a | 11 | 7.5 c | 75 | 62.8 a | 7 | 11.1 de | 40 | |
| 13/12/2011 | F6 | 2.6 c | 105 | 53.3 a | 7 | 15.0 bc | 49 | 35.7 bc | 13 | |
Different lowercase letters within a column indicate significant differences (P < 0.05). CV = coefficient of variation.
Under covered soil, the EIR was closely linked to initial soil moisture content (Tables 2 and 5). Thus, in the wettest periods (F1 and F5) (Figure 2) EIR was lower (P < 0.05) (Table 5) than in the driest periods (F3, F4 and F6). The EIR in F2, with intermediate initial soil moisture content (Table 2), was only statistically different from that in F5, a consequence of the difference in initial soil moisture between the two sampling dates (Table 2).
In bare soil, with no influence of canopy or stubble, the general trend in EIR and RC values was similar to that observed in covered soil (Table 5). However, EIR in F3 was higher than in F4 (P < 0.05) and in F2 was equal to the one in F5, but higher than in F1 (P < 0.05). The results of these first two comparisons were not conditioned by initial soil moisture content (Table 2).
RC and EIR were always associated with SWC, T5, T10, T30 and >50 µm pore size in both bare and covered soil (Table 6). CMWD also influenced EIR and RC but only in covered soil (Table 6). In addition, those variables were generally not correlated with the amount of rainfall prior to the infiltration tests (Table 6). When the effect of climatic conditions of the days prior to sampling on soil moisture was analyzed, it was found that the effect of temperature proved more important than that of rainfall (Table 3). The different response of SWC to those two climatic variables was because half the samples were taken in soil with very low moisture content due to the absence of rain in the 5 days prior to sampling, and so SWC was mainly regulated by mean temperatures.
Table 6: Correlation coefficients between runoff coefficient (RC) and equilibrium infiltration rate (EIR) with other weather and soil variables.
| Covered soil | Bare soil | ||||
|---|---|---|---|---|---|
| RC | EIR | RC | EIR | ||
| SWC | 0.95** | -0.96** | 0.96** | -0.88* | |
| R5 | 0.86* | -0.80ns | 0.72ns | -0.55ns | |
| R10 | 0.78ns | -0.71ns | 0.62ns | -0.43ns | |
| R15 | -0.44ns | 0.49ns | -0.52ns | 0.58ns | |
| T5 | -0.95** | 0.97** | -0.97** | 0.89* | |
| T10 | -0.92* | 0.95** | -0.95** | 0.89* | |
| T30 | -0.87* | 0.90* | -0.91* | 0.86* | |
| >50 µm | -0.90* | 0.93** | -0.94** | 0.92** | |
| CMWD | 0.82* | -0.83* | 0.80ns | -0.69ns | |
*( P < 0.05),**( P < 0.01), ns = non-significant. SWC = soil water content before rainfall simulations. R5, R10, R15 = rain fallen during the 5, 10 and 15 days prior to each sampling date, respectively. T5, T10, T15, T30 = average daily mean temperature of the 5, 10, 15 and 30 days prior to each sampling date, respectively. >50 µm = volume occupied by pores of effective diameter larger than 50 µm. CMWD = change in the mean weighted diameter of soil aggregates.
As mentioned above, SWC affected the volume occupied by macropores, thus influencing the EIR (Figures 3 and 4). This agrees with results found by some authors (Lin et al., 1998; Zhou et al., 2008) but not by others (Fuentes et al., 2004). Due to the moderate to high COLE of the surface horizon of the Argiudoll we studied, a low SWC determined an increase in macroporosity in the dry soil and thus a greater EIR, and had the opposite effect when SWC increased.
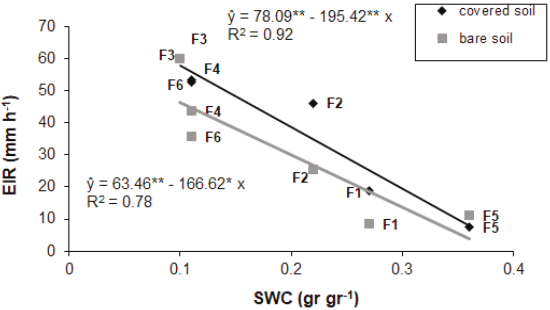
Figure 3: Relationship between soil water content (SWC) and equilibrium infiltration rate (EIR) for covered and bare soil. * and ** significant at, respectively, 5 and 1%, by the “t” test.
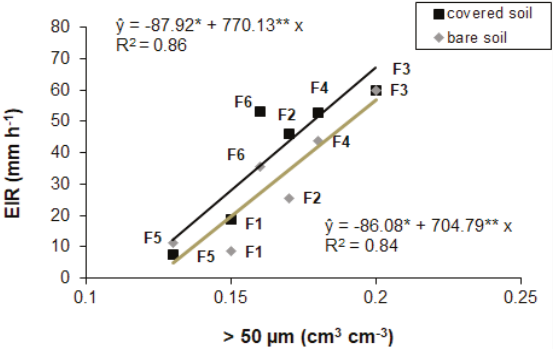
Figure 4: Relationship between volume occupied by macropores (> 50 µm) and equilibrium infiltration rate (EIR) for covered and bare soil. * and ** significant at, respectively, 5 and 1%, by the “t” test.
However, despite the expansion capacity of this Argiudoll, the different intensity of the wetting and drying cycles experienced by the soil before some of the sampling dates (Figure 2) did not influence EIR values. For example, under covered soil, F3 and F4 which had similar initial soil moisture but differences in wetting and drying cycle intensity (Figure 2) had equal EIR (Table 5).
In five of the six sampling dates, both in covered and bare soils, the EIR/CMWD relationship had a significant correlation coefficient (data not shown). Thus, excluding the results for post-harvest period of wheat (F3) and regardless of the degree of soil cover, EIR was high due to a more stable soil structure (Figure 5). In F3 both EIR (in covered and bare soils) were higher than those corresponding to the EIR/CMWD relationships of Figure 5. This was probably because, in this case, the dry soil condition had a stronger effect on EIR than CMWD.
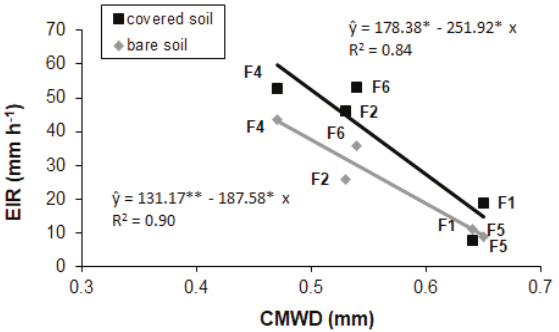
Figure 5: Relationship between the change in the mean weighted diameter of soil aggregates (CMWD) and equilibrium infiltration rate (EIR) for covered and bare soil. * and ** significant at, respectively, 5 and 1%, by the “t” test.
Soil cover affected the relationship between CMWD and EIR. For a given structural stability, the EIR was lower in bare soil than in covered soil but R2 was higher (Figure 5).
Since there are numerous factors that regulate soil water infiltration, the seasonal pattern of this property is sometimes difficult to establish. However, situations in which one of these factors is dominant allows establishing a temporal pattern of behavior (Fuentes et al., 2004). In our study, seasonal patterns for EIR and RC were determined primarily by differences in SWC (Figure 3), which regulated soil macroporosity. However, aggregate stability had an additional effect, which was evident in the results of some of the sampling dates (Figure 5).
Conclusions
In the Aquic Argiudoll of this area of the Pampean region (Argentina) under a no-till wheat/soybean-corn rotation, no effect of crop type on soil properties associated with infiltration and runoff were found. Nor was it possible to show that fluctuations in soil moisture influenced the behavior of the studied soil properties. However, in this high silt Argiudoll and with a moderate to high topsoil COLE (coefficient of linear extensibility), macroporosity increased as a result of soil drying with an increase in infiltration rate and a decrease in the runoff coefficient. The structural condition of the soil was mainly regulated by the temperature prior to the sampling period, improving with higher temperatures. This improvement in structural stability favored soil infiltration during some stages of crop rotation. Our results show that the most critical period of this Argiudoll to generate runoff in this region is from mid fall to early spring, when soils are wetter and colder and thus have less structural stability and lower macroporosity, which will result in lower infiltration rates and increased runoff. Winter cover crops is a management practice that would decrease runoff in that period.

