


 nueva página del texto (beta)
 Inglés (pdf)
 Artículo en XML
 Referencias del artículo
 Enviar artículo por email
 Citado por SciELO
  Similares en
SciELO
Similares en
SciELO 
 Permalink
Introduction
Generally, the surface temperatures play a key role in increasing the evaporation from the oceans and land, leading to an increase in globally averaged precipitation. Those changes in rainfall distributions have attracted much attention because of the particular vulnerability of human activities to hydrological extreme events such as flood-producing rains and droughts (Kharin et al., 2007). It is widely known that hydrological droughts are caused by lack or scarce rainfall.
It has been evidenced that precipitation trends vary by regions and over time, although land-surface precipitation has generally increased North of 30° N over the past century and decreased over much of the tropics since the 1970's (IPCC, 2007). On the other hand, the evaporation of water as measured from pan evaporimeters has decreased in many regions of the world over the past half-century (Roderick and Farquhar, 2004; Blanco-Macías et al., 2011), thus this suggests a recent decrease in the terrestrial evaporation component of the hydrologic cycle (Lawrimore and Peterson, 2000).
In addition to the traditional statistical analysis, evaporation and precipitation time series could be analyzed using other approaches; for instance, they could be treated like fractal profiles (Blanco-Macías et al., 2011; Valdez-Cepeda et al., 2012). The fractal concept is very useful for interpretation of time series data in various branches of earth science, like horizontal variability of temperature, humidity, rainfall, and cloud water in the atmosphere, among others. All these phenomena obey power law behavior over well-defined wavenumber ranges. These results are of great importance for understanding the variability of the atmosphere and for an improved characterization of these fields into large-scale models of the climate system (Dimri, 2005).
Hence, the aim of this study was to analyze long-term anomaly time series of evaporation and precipitation registered at 32 meteorological stations located within the Mexico's State of Zacatecas by means of the power spectrum analysis in order to acquire knowledge at local and regional levels.
Material and methods
Data
The original data were long-term records of monthly evaporation and precipitation. We acquired those data sets from 32 meteorological stations located within the territory of the Mexico's State of Zacatecas. Generalities for each station and series are presented in Table 1. Data were kindly provided by the Comisión Nacional del Agua, the national official institution in charge of registration of climatic and meteorological data in Mexico. For the analysis, we considered stations with at least 30 years of records, within a period from January 1943 to May 2006. In other words, we involved time series without missing data.

Linear Trends
Experimental series are often affected by non-stationarity and fractality (Ming, 2010). Climate time series are in general non-stationary, and frequently present long-term trends. Among several methods to calculate the trend of a climatological time series, the simplest and broadly used one is the interpretation of the time series as a superposition of a linear trend (Tromel and Schonwiese, 2008). This technique has been used by Muhlbauer et al. (2009), Guerreiro et al. (2010), Nickl et al. (2010), Xie et al. (2010), and Xie et al. (2011). Therefore, linear trends were estimated through least squares linear regression analyses, taking into account the following simple model (Draper and Smith, 1966).
 (1)
(1)
The presence of a trend can make it more difficult to analyze other components of interest, such as the cycle or the seasonal (White and Granger, 2011). Thus, the purpose of removing a trend is then simplifying the analysis of those other components (White and Granger, 2011). In other words, removing the trend is an important issue in order to avoid that non-stationary behavior accompanying these data which will give spurious results (Peng et al., 1994; Hausdorff and Peng, 1996).
Then, the series' precipitation and evaporation linear trends were removed following the Eq. 2:
 (2)
(2)
where Ŷ di is the detrended monthly precipitation or evaporation. When the above step is performed, the new time series is known as anomaly time series (i.e. monthly precipitation anomaly or monthly evaporation anomaly), which is the time series of deviations of a quantity from some mean (Wilks, 2011).
Fractal Analysis
Temporal variation of natural phenomena has been difficult to characterize and quantify. To solve these problems, fractal analysis was introduced by Mandelbrot (1982). Time series can be characterized by a noninteger dimension (fractal dimension), when treated as random walks or self-affine profiles (Valdez-Cepeda et al., 2003). Self-affine systems are often characterized by roughness, which is defined as the fluctuation of the height over a length scale (Moreira et al., 1994). For self-affine profiles, the roughness scales with the linear size of the surface by an exponent called the roughness or Hurst exponent (Valdez-Cepeda et al., 2003). However, this exponent gives limited information about the underlying distribution of height differences (Evertsz and Berkner, 1995). There is the fact that the Hurst exponent, as well as the fractal dimension, measures how far a fractal curve is from any smooth function which one uses to approximate it (Moreira et al., 1994). There are a lot of approaches to estimate fractal dimension for self-affine profiles, but we only used the power spectrum technique, because it is sensitive and a good exploratory tool for real data (Weber and Talkner, 2001).
Power spectrum approach. Self-affine fractals are generally treated quantitatively using spectral techniques. The power spectrum variation P(f) with frequency f appears to follow a power law (Turcotte, 1992):
 (3)
(3)
The power spectrum P(f) is defined as the square of the magnitude of the Fourier transform of the monthly precipitation anomaly data. Denoting anomaly data as a function of time by Z(t), we have
 (4)
(4)
where t0 and t1 are the limits oftime over which the series extend. Regarding such precipitation or evaporation anomalies record, which is sampled at discrete time intervals, we should use the discrete version of Eq. 4:
 (5)
(5)
The next step is to obtain a relationship between the power b and the fractal dimension (D). By considering two time series Z1(t) and Z2(t) separated by the distance r, and related by
 (6)
(6)
it can be observed that Z1(t) has the same statistical properties as Z2(t), and since Z2 is a properly rescaled version of Z1, their power spectral densities must also It follows that be properly scaled. Thus, we can write
 (7)
(7)
It follows that.
 (8)
(8)
 (9)
(9)
and
 (10)
(10)
where Ds is the fractal dimension estimated from the power spectrum and H is the Hurst exponent. The Hurst exponent provides a measure for long-term memory and fractality of a time series; it quantifies the relative tendency of a time series to either regress to a long-term mean value in certain direction.
Since the periodogram is a poor estimate of the power spectrum because the estimate of power at any frequency is very noisy, with the amplitude of the noise being proportional to the spectral power, we followed the strategy proposed by Valdez-Cepeda et al. (2007), that is, we rather use the Welch's method of averaging periodograms in order to obtain 50 regular logarithmic intervals of the two records (complete series and partial series); in addition, we used the 'running sum' transformation to shift, by a factor of + 2, the slope, and thereby the Hurst exponent and the Ds because data trace had a slope between -1 and 1 on the log-log plot.
In practice, with the aim of obtaining an estimate of the fractal dimension Ds, one calculates the power spectrum P(f) (where f = 2π/l, f is the wave-number, and l is the wavelength), and plots the logarithm of P(f) versus the logarithms off If the profile is self-affine, this plot should follow a straight line with a negative slope -β.
Correlation
In addition, in order to find possible bivariate associations between geographical coordinates of the stations and the estimated self-affinity statistics, as well as trends in Zacatecas territory, correlation coefficients were estimated. Pearson's correlation coefficient (r), sometimes also called the cross-correlation coefficient, is a quantity that gives the quality of a least squares fitting to the original data. This value allowed the authors to analyze the relationship among self-affinity statistics of the monthly evaporation and precipitation anomaly time series, and geographic coordinates of the stations.
 (11)
(11)
where X i is the geographic coordinate latitude or longitude, and Y di. is the monthly precipitation or evaporation anomaly.
Results and discussion
Advances on climate change research, apart from assessing the potential impacts of climate change on water resources, would allow understanding the spatial and temporal variability of land-surface precipitation and evaporation time series at local and regional levels. In addition to common statistical analysis, evaporation and precipitation time series could be analyzed using other approaches, like the spectral analysis that uses several algorithms such maximum entropy, autoregressive moving average, non-harmonic method, singular spectral analysis, and the traditional Fourier analysis (Lana et al., 2005). In the present study, spectral analysis approach was applied on monthly evaporation and precipitation anomaly time series in order to estimate their self-affinity statistics: Fractal dimension (Ds), Hurst exponent (H) and slope (-β). All analyzed evaporation and precipitation anomaly time series yielded straight lines on the log-log plot with slope (-β) (Table 2), suggesting that P(f) α f-β. Therefore, it means that each spectrum is singular and that it is represented by a curve on the complex plane for monthly evaporation or precipitation anomaly time series.
Table 2 Statistics for monthly evaporation and precipitation anomaly time series for Zacatecas State meteorological stations.

Evaporation Anomaly Time Series
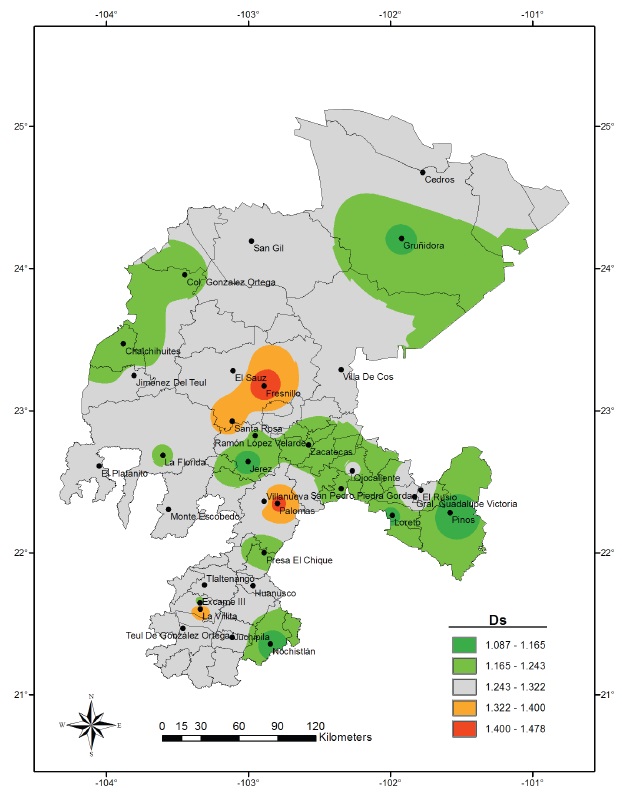
Most of the spectral fractal dimension (Ds) values varied from 1.087 to 1.478, and H values changed from 0.521 to 0.913 (Table 2); consequently, the behavior of estimated Ds values throughout Zacatecas State territory is very irregular (Figure 1), although noise in most of the evaporation anomaly time series tends to have persistent (long-term memory) behavior. Notably, most of the Ds values fall in the 1.243-1.322 range, and they represent an area that may be covering almost 62.60% of the State area (Figure 1). On the other hand, time series with Ds values in the range of 1.4-1.478 represent only 0.67% of the State area. These results indicate most of the monthly evaporation anomaly time series showed long-term positive autocorrelation, which means that a high value in these series will probably be followed by another high value. In addition, a few monthly evaporation anomaly series (those with Ds near to 1.5) tend to have a behavior like the Brownian movement or random walk.
Precipitation Anomaly Time Series
Spectral fractal dimension (Ds) values varied from 1.411 to 1.791, and H values changed from 0.209 to 0.589 with a mean of 0.47. Most of the Ds values are in the range of 1.486 to 1.562; so their corresponding area in the map could be covering 49.08% of the State area (Figure 2). In addition, a time series (El Sauz) showed Ds ≈ 1.5. Hence noise in that monthly precipitation anomaly time series tend to be like the Brownian movement or random walk. Results for these series suggest that autocorrelations at small time lags can be positive or negative, but where the absolute values of the autocorrelations decay exponentially quickly to zero.

Figure 2 Precipitation time series anomalies fractal dimension (Ds) through Zacatecas State territory.
On the other hand, high Ds values are in the range of 1.638 to 1.796. However, they may represent as much as 0.16% of the State area. Therefore, noise in the corresponding monthly precipitation anomaly series tends to have anti-persistent (short-term memory) behavior. As a consequence, prediction of these time series values is not an easy task since a single high value will probably be followed by a low value or vice versa.
Yet oddly enough, there is a recent report (Velásquez-Valle et al., 2013) about the H spatial variability of the daily rainfall series for almost all the same stations considered by us. Velásquez-Valle et al. (2013) presented a map and a figure showing a close positive relationship (r = 0.57) between H and Longitude (westwards). By carefully looking that map, anybody may be able to identify that H value diminishes from Northeast to Southwest and from Northwest to Southeast in the upper half of the territory (the driest); in such a map, H values also diminishes from Southwest to Northeast in the lower half of the State. Thus, it might seem eerie but our results partially match those of the map from these authors, although used rainfall scales were different (monthly versus daily). In the present case, Ds values appear to decrease toward the Northwest and Northeast, in the upper half of the State, and toward small areas in the Southwest, South and Southeast in the lower half of the territory (Figure 2). It is worth pointing out that both maps (Figures 1 and 2) were developed using a digital elevation model in order to correct a potential orographic influence.
Correlation Analysis
Monthly evaporation or precipitation anomaly time series self-affinity statistics and the stations' geographic coordinates were used in order to estimate correlation coefficients. Results can be appreciated in Tables 3 and 4. High correlations between fractal statistics mean a great interdependence, whereas these significant correlations between geographical coordinates and central tendency or dispersion statistics suggest the strong influence of orography on the precipitation case.
Table 3 Correlation matrix among geographic coordinates and fractal statistics for monthly evaporation anomaly time series at Zacatecas State.

†Correlations are significant at P ≤ 0.05; n = 32; Ds = fractal dimension; H = Hurst exponent; SD standard deviation.
Table 4 Correlation matrix among geographic coordinates and fractal statistics for monthly precipitation anomaly time series at Zacatecas State.

†Correlations are significant at P ≤ 0.05; n = 32; Ds = fractal dimension; H = Hurst exponent; SD standard deviation.
There, significant correlations between each fractal statistic and latitude were estimated; for instance, a significant negative correlation (r = -0.41) between Ds values for the precipitation anomaly time series and latitude. In addition, significant positive correlations (r = 0.41) between H and P values of the precipitation anomaly time series and latitude were evidenced. The present findings strongly suggest that Ds values of the monthly precipitation anomaly decrease as latitude increase, and H and P values of the monthly precipitation anomaly increase as latitude does within Zacatecas State territory. In order to test such possible associations, linear relationships were estimated. Results showed clearly that the model was significant (P = 0.019) for monthly precipitation anomalies Ds against latitude, as can be appreciated in Figure 3. Thus, such results are compelling evidence that monthly precipitation anomalies behavior may be more regular toward North of Zacatecas State territory, that is, toward driest areas.

Figure 3 Linear model and Pearson correlation between geographic latitude and fractal dimension (Ds = 2.4354 - 0.04 Latitude; P = 0.0191; R2 = 0.1699) for Zacatecas State monthly precipitation anomaly time series.
Future research to gain knowledge about the behavior of the monthly evaporation and precipitation time series for each station (punctual) or area should take into account their fractal level and their possible association with periodic phenomena, such as the sun cycle and El Niño Southern Oscillation. This might be possible when using other techniques, such as wavelet cross spectrum and wavelet coherency analyses (Maraun and Kurths, 2004; Hartmann et al., 2008), among others.
Conclusions
The spatio-temporal behaviour of monthly evaporation in almost the whole Zacatecas territory showed a persistent behavior when measured through self-affinity statistics; that is, most of the evaporation anomaly time series tend to have long-term memory behavior (Ds < 1.5). Regarding monthly precipitation, our results suggest small areas in the Southwest, South and Southeast (areas in grey, orange, and red in Figure 3) of the territory showed an anti-persistent behavior; this means that what predominates in the involved time series are high values of monthly rainfall, followed by low values or vice versa, hence monthly precipitation is practically unpredictable in these cases. In addition, monthly precipitation behavior tends to be more regular toward North of Zacatecas State territory, that is, toward driest areas. We recommend carrying out research about a possible association between monthly evaporation and precipitation time series for each station (punctual) or area by taking into account their fractality level and periodic phenomena, such as the sun cycle and El Niño Southern Oscillation, among others. In this context, using other scales (hourly, daily, weekly) may be advisable in order to gain more detailed knowledge about time series fractal properties.

