


 nueva página del texto (beta)
 Inglés (pdf)
 Artículo en XML
 Referencias del artículo
 Enviar artículo por email
 Citado por SciELO
  Similares en
SciELO
Similares en
SciELO 
 Permalink
Introduction
Since Mathematics are relied upon by researchers across many fields of study in both Humanities and Sciences, its bibliometric behaviour has often been the subject of research, the results of which exhibit bibliometric behaviour that does not match with what one might expect from a field classified as science. Beyond understanding its bibliometric profile as a discipline is recognized that descriptive studies at a country level are scarce. Some publications have addressed topics such as scientific outputs and levels of co-authorship in countries such as Cuba, Brazil, China, and Norway (Herrera-Vallejera et al., 2017; Zhou and Tian, 2014; Gutierres-Castanha and Cabrini-Gracio, 2013; Aksnes, 2012; Dang and Zhang, 2003). Other studies have discussed strategies to improve scientific impact, e.g.: Croatia which established new research institutes and universities after World War II (Dravec-Braun, 2012) and India which has increased its collaboration with USA, Canada, Germany, France, Italy, Japan and UK (Arunachalam, 2001). Nevertheless, a global study on this subject over a period of 140 years (1868-2008) showed a growth of scientific publications. In that, a distribution of such publications was analyzed employing Bardford’s model to know its growth rate and Lotka’s model to study the productivity of authors (Behrens and Luksch, 2011).
Several studies question the usefulness and applicability of bibliometric indicators in the evaluation of researchers and the allocation of budgets for scientific-technological activity in institutions (Adler, Ewing and Taylor, 2009; Smolinsky and Lercher, 2012; Ayaz and Afzal, 2016). These studies have shown that, even when dealing with disciplines within the same field of knowledge, not all of them can be evaluated in the same way. Moreover, traditional bibliometric indicators have been criticized largely because they are often used indiscriminately. More recently, a new generation of indicators have been developed whose aim is to differentiate the best among them. Bearing the latter in mind, the approach to the problem to be solved would be the following question: Among the current bibliometric indicators, which are the ones that accurately explain impact rates in the field of Mathematics? To answer this question, the LabSOM software was used to evaluate the impact of the field of Mathematics at international level. This software allowed simultaneous analysis of several indicators, revealing differences between world’s leading countries, institutions, and authors of this discipline.
In recent decades, Artificial Neural Networks (ANN) have been used to conduct multi-parametric studies that serve to describe a discipline in greater detail; since it has been shown that ANN can secure useful information from large volumes of data and, more particularly, are very useful in the creative organization of information, discovery of knowledge and information visualization (Sotolongo-Aguilar, Guzmán-Sánchez, and Carrillo-Calvet, 2002). ANNs are nourished by mathematical models that allow intelligent computing (Jain, Mao, and Mohiuddin, 1996) and are largely used in pattern recognition, adaptive control, time series prediction, signal classification and clustering, among others (Guzmán-Sánchez et al., 2004). Nowadays there are dissimilar neural network models, developed to examine specific circumstances and solve determined problems.
One type of neural network, the Self-Organizing Map (SOM), preserves the original structure of data through neighbouring relationships. Such maps are termed ‘self-organizing’ because they do not need of supervised training, making them very useful for discovering the structure of a database and the knowledge its holds (Kohonen, 1993). Maps based on SOM algorithm are inspired by the cerebral cortex’s own functions and are of special interest due to their classification capacity. This model is an efficient neural algorithm that allows the projection of data from a multidimensional space to a two-dimensional grid called map, while qualitatively preserving the organization (topology) of the original set (Guzmán-Sánchez et al., 2004). Neural network has topological variants, which are classified in accordance with number of levels or layers, number of neurons per level and forms of connection (Sotolongo-Aguilar and Guzmán-Sánchez, 2001). The SOM algorithm efficiently displays large volumes of multidimensional data (Börner, Chen, and Boyack, 2003; Moya-Anegón, Herrero-Solana, and Jiménez-Contreras, 2006) which is certainly among the most important contributions to the visualization of information (Kohonen, 2013).
One of the applications of SOM algorithm is Multiparametric Analysis. This analysis allows the study of items with different scientometric performance profiles by several bibliometric indicators. In the present study, the ViBlioSOM Methodology is used, which is precisely based on the multiparametric analysis. It should be noted that this analysis allows to automatically visualize very different profiles of scientometric performance. Its maps group in the same cluster items that share certain similarity in their performance profiles and show in separate clusters those that present specific behaviours. Multiparametric analysis has been used in the study of Information Sciences (Moya-Anegón, Herrero-Solana, and Jiménez-Contreras, 2006), the development of vaccines against Tuberculosis (Guzmán-Sánchez et al., 2010), the identification of Mexican mainstream journals core (Arencibia-Jorge et al., 2016) and the scientometric analysis of Mexican higher education institutions (Villaseñor-García, Arencibia-Jorge, and Carrillo-Calvet, 2017).
At present, there are no previous studies published that use the ViBlioSOM methodology to evaluate Mathematics as a disciplinary field, hence the originality of the present study. The main objective of the study is to determine whether the leaders in each impact indicator coincide at each analyzed level of aggregation. On the other hand, the specific objectives are to determine the leading countries and institutions in the field of Mathematics; as well as to demonstrate whether there is a single scientific impact indicator capable of assessing the visibility of science at the macro, meso and micro levels.
Methodology
Information source was taken from Web of Science Core Collection using Essential Science Indicators tool during the period 2009-2019. The records obtained were filtered by discipline (Mathematics) and by level of aggregation, that is, by country, institution and author. Records were ranked in descending order by their Hot Papers values and analyzed using LabSOM software (Carrillo-Calvet, Villaseñor-García, and Jiménez-Andrade, 2011). The bibliometric indicators are as follows (Table 1).
Table 1 Bibliometric indicators
| Bibliometric Indicator | Concept | Operational definition |
|---|---|---|
| Cites | Cites received from the databases of Science Citation Index Expanded, Social Science Citation Index, and Arts and Humanities Citation Index | Total number of cites |
| Cites/paper | Cites count for each published paper | Ratio between cites and published paper |
| Highly Cited Papers (HCP) | Highly Cited Papers reflect the top 1% of the most cited papers by field and publication year | 1% of the most cited papers in the ranking of cited papers in the same field and year of publication |
| Hot Papers (HP) | Hot Papers are in the top 0.1% of the most cited papers in a current bimonthly period | 0.1% of the most cited papers in the ranking of cited papers in the first 2 months after publication and in the same field |
The analysis was focused on three levels of aggregation. Macro, meso and micro levels correspond to countries, institutions and authors respectively that generate the greatest scientific impact.
The ViBlioSOM methodology (Bibliometric Visualization using the SOM Neural Network) (Guzmán-Sánchez, 2009) has been partially implemented in a software system called LabSOM. This tool is very useful for visualizing and interpreting multidimensional data. In this research the methodology is applied to identify the bibliometric performance profiles occurring in the field of Mathematics. LabSOM software implements the neuro-computational processing stage.
A. Data was obtained using Essential Science Indicators tool and exported to Microsoft Office Excel 2010.
B. Construction of a matrix, wherein columns provide values for each indicator and rows show the analysis items (reference vectors). Many indicators used for analysis exhibit disparate variability ranges. Therefore, for indicators with larger values don’t prevail during training, a pre-processing technique called MIN_MAX was executed. This technique consists of dividing the value of each indicator by the highest value in the column corresponding to that indicator. As such, this highest value divided by itself will always be 1, and the rest values will be less than 1, obtaining then a variation of range between zero and one in all the indicators.
C. Next, neural network is trained with matrix values, considering the size of the network in terms of length x width (15 x 15), the number of neurons (300) and the number of iterations (1000).
D. Finally, two types of visualizations are analyzed: component maps and clustering map. Each component map represents the values obtained from each indicator analyzed. These maps are drawn on a hexagonal grid, where each hexagon represents a neuron.
E. The visualizations are saved in JPG format and the process of interpreting the results begins.
Clustering map visualizes the analyzed items considering their similarity and the indicator component maps of each one of the indicators enrich the interpretation of the results. The analysis of these clusters is considered a multiparametric analysis, which allows characterizing the bibliometric profiles of the items under analysis.
Analysis and presentation of results
Historical analysis of Mathematics for the period 2009-2019
A total of 426,123 records indexed in the Web of Science Core Collection were retrieved for the period 2009-2019; these were ranked in descending order by their Hot Paper values and analyzed by Essential Science Indicators tool. These papers received 1,885,511 cites, with an average of four cites per published paper, 4,305 of which are HCP and 80 are HP. Table 2 shows the evolution of these indicators for five-year periods.
Table 2 Bibliometric development of Mathematics in Essential Science Indicators, for the period 2009-2019
| Indicators | 2009-2013 | 2010-2014 | 2011-2015 | 2012-2016 | 2013-2017 | 2014-2018 | 2015-2019 |
|---|---|---|---|---|---|---|---|
| Total papers | 192,561 | 200,814 | 207,333 | 212,540 | 216,408 | 219,084 | 189,828 |
| Total cites | 361,129 | 378,292 | 386,747 | 402,890 | 422,481 | 453,569 | 343,655 |
| Cites per paper | 1.88 | 1.88 | 1.87 | 1.9 | 1.95 | 2.07 | 1.81 |
| HCP | 1949 | 2024 | 2100 | 2162 | 2190 | 2233 | 1921 |
| HP | 0 | 0 | 0 | 0 | 24 | 69 | 80 |
The table above shows that output and impact increased approximately by 2.5% and 4.5%, respectively, each year. Although an average of two cites per paper remained constant, HCP increased on an average of 57 papers annually, as HP began to emerge after 2013. This result coincides with a study where it is showed that the average output in Mathematics increased after 1870 (Behrens and Luksch, 2011). In the last five years, a decrease was observed in all indicators except HP. This was due to the period of data analysis in Essential Science Indicators tool. The increasing HP indicator shows that output and impact of Mathematics has not only grown, but also that the time needed to receive cites has diminished.
This study omits the 2-year and 5-year impact factor analysis; as well as the citation lifetime; because several studies on the subject have shown that these indicators are very unstable and particularly unsuitable in the field of Mathematics (Ferrer-Sapena et al., 2016; Bensman, Smolinsky, and Pudovkin, 2010).
Overview of multi-parametric analysis of Mathematics
In this study Artificial Intelligence (AI) provides a neural network to perform a multi-parametric analysis of four indicators: cites, cites/paper, HCP and HP. This network automatically identifies the bibliometric profiles of authors and institutions at international level, as well as the leading countries in the field of Mathematics according to the classification criteria of Essential Science Indicators tool. Using the visualization technique, five maps or cartographies were constructed consisting of a clustering map and others of four components.
Observing in general terms the multi-parametric analysis it was determined that two countries were excluded at macro level (China, and The United States of America) as they had values of HCP, HP and cites much higher than the rest of the countries analyzed. Table 3 shows these values.
Table 3 Performance of The United States of America (USA) and China in the indicators of cites, cites/paper, HCP, and HP
| Country | Cites | %Cites | HCP | %HCP | HP | %HP |
|---|---|---|---|---|---|---|
| China | 395,648 | 15.2 | 1,567 | 23.5 | 57 | 38.5 |
| USA | 544,521 | 21 | 1,324 | 19.8 | 20 | 13.5 |
| Others | 1,657,140 | 63.8 | 3,786 | 56.7 | 71 | 48 |
| Total | 2,597,309 | 100 | 6,677 | 100 | 148 | 100 |
In this study, the scientific impact of the United States exceeded that of China by 6%; however, the latter has 4% more HCP and three times the number of HP compared to United States. This simple comparison shows that a country can have a high impact, but its papers may not achieve it in short periods of time and vice-versa.
The fact that the United States generates the greatest impact, but without achieving greater immediacy, will become evident when analyzing the rest of the countries, institutions, and the most prominent authors throughout different indicators associated with scientific impact.
Multi-parametric analysis at the macro level
A neural network was used to perform a simultaneous analysis of four bibliometric indicators (cites, cites/paper, HCP and HP), taking advantage of the strengths offered by artificial intelligence, through multiparametric analysis. This neural network has a clustering map and other component maps according to bibliometric indicators. Clustering map allows to automatically observe the bibliometric profiles, to determine which entities have specific profiles by forming independent clusters and to identify the entities that share qualitatively similar profiles because they are located within the same cluster. The component maps of each indicator enrich the neural network interpretation. The analysis of these indicators makes it possible to characterize the bibliometric profiles of countries, institutions and authors, according to the gray scale used. This gray scale is shown at the bottom of each map, which determines that the highest values of each indicator are displayed in dark gray, the medium values in light gray and finally the lowest values in a medium shade of gray.
Figure 1 shows the multiparametric analysis of these indicators for the top fifty countries in terms of HP quantity. Countries are represented by the ISO 3166-1 two-letter code system (ISO, 2013).
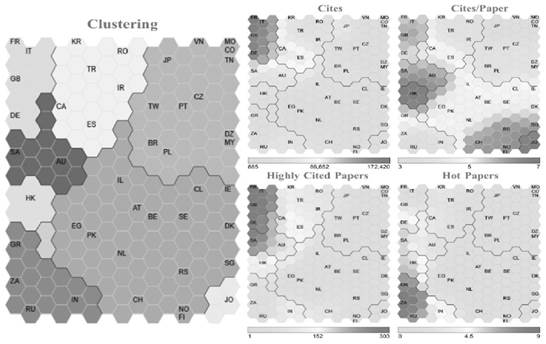
The clustering map shown in Figure 1 identifies eight clusters, two of which, Hong Kong and Jordan, have very specific profiles, unlike Saudi Arabia and Australia which share the same cluster and therefore have very similar profiles. The ViBlioSOM methodology groups items with similar bibliometric performance profiles into the same cluster. In view of the above, the upper left cluster (France, Germany, United Kingdom and Italy) contains the four leading countries on bibliometric indicators analyzed. The bottom left cluster (Greece, Russia, South Africa and India) contains countries with different geographical, social and economic characteristics, but with a very similar bibliometric profile. The remaining clusters include countries from all geographic zones and therefore very different from each other but share similarities in their bibliometric performance profiles. These clusters are as follow: the cluster in the top of the middle map includes 12% of the countries analyzed (Canada, Spain, Turkey, Romania, South Korea and Iran), the top right cluster contains 24% (Tunisia, Colombia, Macau, Vietnam, Algeria and Malaysia, among others) and the bottom right cluster holds 30% (Netherlands, Pakistan, Egypt, Israel, Austria, Belgium, Sweden, among others). It should be noted that the closeness of the clusters doesn’t necessarily imply a similarity between them.
Component maps correspond to each of the four bibliometric indicators. The cites map as well as the HCP map share the same cluster (dark gray) where the four most prominent countries in these indicators are shown: France (FR), Germany (DE), Great Britain (GB) and Italy (IT) with 172,420, 141,509, 127,134 and 117,550 cites, respectively; as well as with 303, 293, 268 and 262 HCP, respectively.
However, the cites/paper and HP maps show different behaviours. In the case of the former, there are two clusters (dark gray) distant from each other, corresponding to very specific profiles of Hong Kong (HK) and Jordan (JO), both with 7 cites/paper. In contrast, in the HP map this area is occupied by three countries: South Africa (ZA), Greece (GR), and Russia (RU) with 9, 7 and 6 HP, respectively.
Clustering map reveals a fundamental core including FR, DE, GB, and IT with the highest number of cites and HCP; however, of these, only DE and GB have HP. An opposite situation is observed in the cluster containing ZA, GR, and RU with the highest HP values, but with an average of 19% of the maximum HCP value and 15% of the highest number of cites. This map highlights that HK and JO, leading countries in the cites/paper indicator, have a unique performance profile compared to the rest of the countries.
Multi-parametric analysis at meso level
Figure 2 shows the multi-parametric analysis of these indicators for the fifty institutions with the highest number of HP at international level. Each of the institutions are represented through their corresponding official acronyms (ISO, 2013).
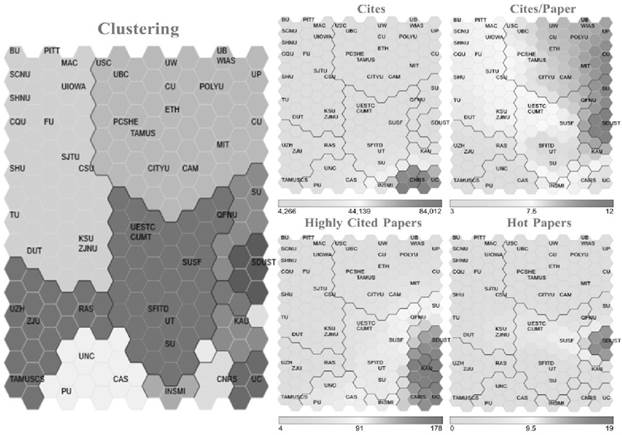
The clustering map shown in Figure 2 identifies eleven clusters, six of which belong to institutions with very particular bibliometric performance profiles (Shandong University of Science & Technology, Stanford University, King Abdulaziz University, Centre National De La Recherche Scientifique, National Institute for Mathematical Sciences and University of California System). The bottom left cluster (8% of the institutions studied) contains institutions from different countries such as the United States, China, Russia and Germany. However, in the top left cluster and the central cluster (30% and 14% of the institutions analyzed), Chinese institutions predominate, unlike the top right cluster and the bottom cluster (30% and 6% of the total number of institutions), where North American institutions are predominant.
The rest of the component maps correspond to the same bibliometric indicators. These maps show some overlap between the cites and HCP maps with respect to the cluster (dark gray) where the most outstanding institutions are shown taking into consideration these indicators. It should be noted that Centre National de La Recherche Scientifique (CNRS) and University of California System (UC) are on both maps with 84,012 cites (167 HCP) and 58,703 cites (124 HCP), respectively. However, the HCP map shows other institutions in this dark gray cluster, such as King Abdulaziz University (KAU) and Shandong University of Science and Technology (SDUST) with 178 and 148 HCPs, respectively.
Like the previous analysis, the cites/paper and HP maps have some overlap in the dark gray cluster, which shows the most prominent institutions in these indicators. This overlap is given by only one institution (Shandong University of Science and Technology (SDUST), which has 12 cites/paper (19 HP). On the other hand, the HP map shows other outstanding institutions, among them: Cankaya University (CU) and Stanford University (SU) both with 11 cites/paper, respectively.
Clustering map highlights SDUST’s profile as the institution that received the most cites/paper, published the highest number of HP and ranked 3rd in the HCP indicator, with only 8% of the impact generated by CNRS (institution with the highest number of cites). The closeness between the CNRS and UC clusters demonstrates the similarity between their performance profiles, where both are outstanding in cites and HCP; however, their HP values are almost null and only CNRS barely exceeds the middle value of cites/paper. A reverse situation is observed when analyzing the cluster formed among other institutions as State University System of Florida (SUSF), China University of Mining and Technology (CUMT) and University of Electronic Science and Technology of China (UESTC), all with values between 8 and 4 HP, but the average of their HCP and cites correspond to 28% and 10% of SDUST, respectively. This map shows that leading institutions such as CNRS, KAU, SDUST and UC form individual clusters where their characteristic profiles of bibliometric performance are visualized.
Multi-parametric analysis at micro level
Figure 3 shows the multiparametric analysis of the four indicators analyzed applied to the top fifty authors at international level, considering the number of HP. Due to the length of authors’ names, each was assigned the letter “A” followed by a consecutive number.
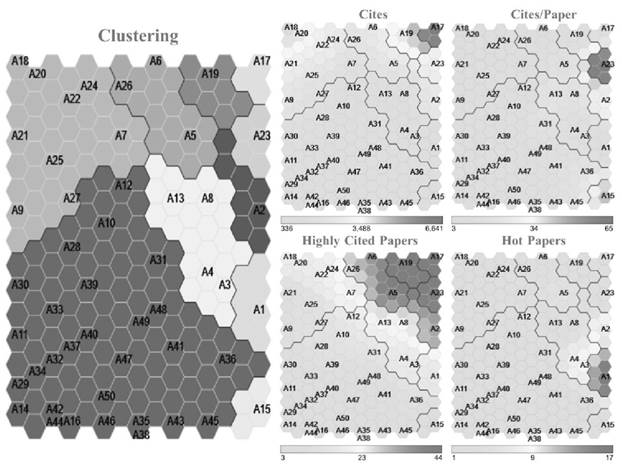
Clustering map in Figure 3 identifies ten clusters, six of them belonging to authors with their own research profiles. Each of them coincides with the most prominent authors regarding to the indicators analyzed below. The rest of the clusters are formed by three to twenty-eight authors with similar profiles, whose information will not be analyzed for ethical reasons.
The other four component maps correspond to each of the indicators that have been analyzed. A comparison of the four maps shows many coincidences among them. The dark gray cluster of the HCP map contains four prominent authors; A19 (44 HCP), A17 (43 HCP), A23 (42 HCP) and A5 (41 HCP), of these A17 is the only one included in the dark gray area of the cites map with 6,641 cites and A23 is the only one present in the dark gray area of the cites/paper map with 65 cites/paper. However, it should be noted that none of these authors are in the dark gray cluster of the HP map. In the latter map only A1, who has 17 HP, stands out.
In clustering map, emphasis should be made on two clusters corresponding to A17 and A23, which are the most prominent authors in terms of cites and cites/paper, respectively, but have only 1 HP. This situation is similar for A1, who is the author with the highest number of HP in the study but has only 5% of the cites of A17 and 17% of the cites/paper of A23. The multiparametric analysis shows that A17, A23, A19 and A1 (leading authors in terms of cites, cites/paper, HCP and HP, respectively) each form an independent cluster, so that their scientific performance profiles are distinguished from the rest of the authors in the study.
Discussion
The main objective of the study is to determine leadership through scientific impact. At micro level, there is only one leading author for each indicator, except for HCP, while at meso and macro levels leadership is distributed between two and four items. This behaviour is due to at analyzing the bibliometric performance of the authors, it is better to differentiate the particularities in the publication habits and therefore the scientific impact profiles obtained at this level. These particularities are not shown at meso and macro levels, since at higher levels of aggregation publication patterns and impact become more general.
This study has analyzed the best authors, institutions and countries, considering the number of HP. It presents the differences and similarities in relation to the leadership of each of them for each studied bibliometric indicator. To compare each component map, it is observe that as the level of aggregation increases, the correspondence between cites and HCP maps increases as well. However, there is no relationship when analyzing the HP indicator with any other indicator in the study, at any level of aggregation.
On the other hand, years ago, evaluation systems for researcher are required the publication of a certain number of papers per year in mainstream databases. Evaluation standards became more demanding, and it was not enough to publish but it was also needed to earn cites. Years later these cites began to have a weighted value depending on the positioning of the journal in the main quartiles of those databases. Moreover, evaluators began to look for these cites to be distributed in ascending fashion among published papers (h-index). Nowadays, it is argued that much more is needed to obtain responsibilities in research projects, receive budgets for their development and other incentives. Authors must boast highly cited papers in very short periods of time, which is problematic since the speed of impact of research varies appreciably from field to field (Galiani and Gálvez, 2019).
In this sense, it would be necessary to evaluate which of these indicators would be the most useful and fair for the evaluation of researchers. This dilemma has been exposed in other studies demonstrating that not all prolific authors produce papers with an impact on the scientific community and viceversa, there are authors who have laid the foundations in a discipline with few publications and in a reduced context of contributors (Berg and Wagner-Döbler, 1996; Huber and Wagner-Döble, 2001).
Scientific impact using Essential Science Indicators tool is one of the most widely used dimensions for academic recognition, international visibility of universities and their international rankings (Aguillo et al., 2006) and for the awarding of prizes and grants to researchers (Rodríguez-Navarro, 2011), but the use of these indicators has been questioned in other studies (Ayaz and Afzal, 2016; Smolinsky and Lercher, 2012; De Filippo, Pandiella-Dominique, and Sanz-Casado, 2017). It is a fact that reliance on a single indicator leads to misleading results, so decision making should be based on several indicators and as much information as possible. For this reason, the use of multiparametric analysis to evaluate researchers establishes a more comprehensive, realistic and fairer vision of them.
Final considerations
The United States receives the most cites in the study, but China is the country that publishes the most highly cited papers as well as the papers that receive cites in the shortest periods. On the other hand, the field of Mathematics examined in this study shows that the leaders of each bibliometric indicator related with impact do not coincide. The results obtained show that there is not a single indicator to evaluate scientific impact at any level (macro, meso and micro). In the same way, it is suggested that appropriate strategies for encouraging research activity and measuring its impact on the scientific community must be specific for each discipline. This issue is especially important since it is considered that each scientific discipline has different growth rates, conditioned by the presence of very active research fronts that attract a greater number of cites (Davis and Cochran, 2015). Finally, the ViBlioSOM methodology using LabSOM software allows to automatically perform a simultaneous analysis of several indicators through a neural network visualizing more accurate bibliometric performance profiles from micro to macro level.
However, this study only includes one size-independent indicator (cites/ paper), which limits the scope of the research, since these indicators consider variables that homogenize the analyzed items, thus achieving a more precise analysis. Examples of variables used in size-independent indicators are Total number of published papers, Total number of cited papers, Total number of institution researchers or Total number of country population. Bearing in mind this, it is recommended for future studies the application of other size-independent indicators or the analysis of the ratio of HCPs to the number of published articles, as well as the ratio of HPs to the number of published articles. These recommendations will allow a clearer analysis of the bibliometric profiles of large countries such as China and the United States compared to smaller countries such as Greece, Jordan and South Africa.

