


 nueva página del texto (beta)
 Inglés (pdf)
 Artículo en XML
 Referencias del artículo
 Enviar artículo por email
 Citado por SciELO
  Similares en
SciELO
Similares en
SciELO 
 Permalink
Introduction
The principles for the integration of Research Data Management (RDM) and bibliometry, and in particular the role of academic libraries in this process, have been explored in detail in the past. Torres-Salinas and Jiménez-Contreras (2012) proposed a model for the creation of bibliometric units within universities to function as central actors in managing research data and to impact institutional decision making regarding scientific policy. Cox et al. (2017) identified in a series of case studies that RDM is often accompanied by the generation of new services intended to support research and academic communication.
Many RDM systems have been developed and are currently in use by universities (Schöpfel, Prost, and Rebouillat, 2017), with Spain clearly being the breeding ground for the earlier initiatives. A pioneering example is that of Universitas XXI (1994, https://www.universitasxxi.com/), a modular system developed as a joint effort by a large consortium of Spanish universities including Alcalá, Carlos III de Madrid, Castilla-La Mancha, Salamanca and Valladolid. This platform performs varied administrative functions (including human resources and finances), with a modular focus on RDM, specifically management of researcher CVs. Another example is GREC (https://www.uv.es/uvweb/servicio-investigacion/es/investigacion-uv/produccion-cientifica/introduccion-datos-grec-1285907192537.html), developed by the Universitat de Barcelona and other research institutions of the Comunitat Valenciana, Catalunya y Baleares and intended to centralize research information of the participating institutions. Lastly, GesBIB (http://bibliotecas.csic.es/es/gesbib) is an RDM system developed at the national level by the Scientific Information Resources Unit (URICI) of the Network of Libraries and Archives of Spain’s Superior Council for Scientific Research (CSIC).
An example in Europe outside Spain is FRIDA, created in 2003 and consolidated as CRISTINA in 2010. Developed initially by the IT department of the University of Oslo and then as a joint project with other Norwegian universities (Toft, 2003; Royal Ministry of Education and Research, 2004), it manages information on research results, a catalog of researchers, annual reports and research projects. Many examples also exist in Latin America, for example in Argentina the Information System for University Management (SIGUA) developed by the Superior Art Institute (ISA) integrates information of students, university workers, teaching resources and research reports of the institution (Guillot Jiménez, 2011). In Chile, the University of Talca develops the Research Management System (SGI, http://sgi.utalca.cl), which includes an academic directory, research statistics, and deploys a web site that serves to facilitate the interaction between academia, the private sector and society. In Colombia, the EAFIT University develops πEAFIT (http://www.eafit.edu.co/investigacion/produccion-investigativa/Paginas/produccion-investigativa.aspx) that collects information related to academic production, scientific activities, CVs of teaching staff and students, and also facilitates information that can be used to generate metric indicators. Another example in Colombia is CRAI-USTA (https://crai.usta.edu.co/), a digital platform intended to organize and offer resources related to teaching and research.
In Mexico, the state university of Veracruz maintains the Sistema Integral de Información Universitaria, SIIU (https://www.uv.mx/siiu), which is oriented towards academic and administrative management, automatizing processes, methods and procedures that are common in academic-administrative functions. It also produces some indicators targeted at orienting decision-making processes. At UNAM, the SIAE (https://www.dgae-siae.unam.mx/) system collects information on student registration and curricular activity in a single unified university-wide system, and all student theses are collected in a centralized repository. However, there is no university-wide research data management system in place, instead leaving individual schools or institutes to tackle this task as they see fit. Some institutes at UNAM have made attempts at creating RDM systems and repositories. The Physics Institute created SALVA (https://salva.fisica.unam.mx/), an information service dedicated to academic curricula, but that does not report additional bibliometric indicators. The Scientific Research Coordination of UNAM (http://www.cic-ctic.unam.mx:31220/cisic/index.cfm) implements a web-based service for the capture of metric indicators related to scientific production at the institutional level. These systems are usually limited to a few specific aspects of RDM that are most relevant to the institution’s needs and are not meant to act as unified, integral systems for the institute or the university.
The objective of this paper is to present SIGI (Sistema Integral de Gestión de Información, or Integrated Information Management System), a research data management (RDM) system developed in-house by the academic library of the Instituto de Ciencias Nucleares (ICN) at the Universidad Nacional Autónoma de México (UNAM). Our intention is to describe the design philosophy and main features and products of the system, to showcase two examples of scientiometric analyses conducted from data integrated by the system, and to discuss our experiences, as an academic library, in developing and utilizing an RDM system. While the ICN is a basic science research institute focused mainly on physics and chemistry, both the SIGI system and our experience are directly applicable to academic institutes in other fields. It is a good example of how academic libraries can leverage information technologies to create added value services for their community.
The principal feature of SIGI is that it is a system designed to integrate information from all aspects of the academic life of the institute, from publications of academic articles and books, participation and organization of academic events, to research grants, curricular teaching and thesis direction. It also acts as the mechanism for researchers to create and submit annual activity reports, handles student registration for the institute, and automatically generates user-customizable researcher profiles. Finally, but importantly, SIGI generates a variety of metric indicators of academic activity, while also offering other more traditional library services to the community. We are aware of few RDM systems as complete as SIGI.
Our paper is organized as follows. In "The SIGI system" we describe the SIGI system, specifying in some detail its different modules. "Results" describes some of the bibliometric information products produced by SIGI using our particular institute (the ICN-UNAM) as a case study. The metric indicators (related to publications, conferences, teaching activities, etc.) generated from this database are discussed in "Bibliometric indicators generated by SIGI", additional, non-traditional indicators (mostly related to teaching) are discussed in "Indicators related to other academic activities", a study of the collaboration networks of the institute’s researchers is given in "Analysis of academic collaboration", and a study of the main research lines determined using publication keyword frequency analysis is described in "Analysis of keyword frequencies in academic publications". Finally, the results are summarized in "Conclusions".
The SIGI system
As a project conceived under the RDM philosophy, SIGI implements an integrated approach to information management and was designed to satisfy international guidelines and standards. The theoretical design of SIGI is rooted in several RDM standards, including the Frascati Manual (OECD, 2015) and the OSLO Manual (OECD and Eurostat, 2018). It satisfies the three fundamental pillars identified by Torres-Salinas and Jiménez-Contreras for a bibliometric unit (González Fernández-Villavicencio, 2017), but builds beyond them by including other functionalities not usually present in this kind of platforms.
The SIGI system innovates over similar projects in that it was designed from the start as an integrated system that centralizes all academic activity of an academic institution across different domains of academic life. SIGI seeks to bring all relevant data into a single database, where it can be normalized, curated, cross-referenced and analyzed. The entry site of the system can be accessed at https://sigi.nucleares.unam.mx/, with the researcher directory available at https://sigi.nucleares.unam.mx/sgiicn/people and the metric indicators subsystem at https://sigi.nucleares.unam.mx/sgiicn/statistics. Many other parts of the system are only accessible after login.
Because of its integrated design, SIGI offers significant added value over common scientific publication databases such as the Web of Science (Arciniegas Tinjacá, Gómez Gutiérrez, and Gregorio-Chaviano, 2018; Tarrats Pons, 2012) or the NASA-Smithsonian Astrophysics Data System (Sierra et al., 2009). As our system is primarily fed by the annual reports of the researchers, it includes not only information concerning academic journal and conference publications, but also teaching (undergraduate and graduate level courses, theses direction), attendance and organization of academic conferences, obtained research grants, outreach activities, and received awards, to name but a few items. SIGI was developed and is currently used by a particular research institute in Mexico, so its user interfaces are currently in Spanish. However, the underlying framework and code are already prepared for language localization, allowing the software to be deployed in other languages.
SIGI is composed of six independent component modules that provide separate user-facing interfaces connected to a single centralized software backend, which acts as an intermediary between them and maintains the database where all data is stored (Figure 1).

Annual Research Reports: allows users (researchers and librarians) to capture, validate and generate the individual annual academic reports. Through this module researchers self-report their production and activities through a user-friendly web-based graphical user interface (Figure 2). The module allows importing bibliographic records from major academic databases (Web of Science, Scopus, and ADS).
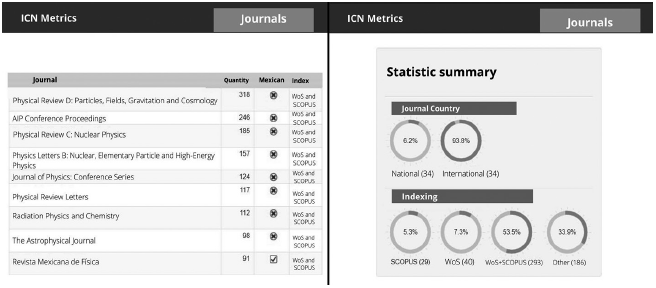
ICN Metrics: computes and displays metric indicators of the Institute’s productivity, including refereed and non-refereed publications (Figures 3 and 4), courses taught, graduated thesis students, etc.
Students Module: tracks student information at all levels, from short research internships to undergraduate and graduate thesis students as well as postdoctoral researchers.
Researcher Profiles: automatically generates researcher profiles, which are publicly viewable in a web interface. Information on scientific production, graduated students, projects and prizes is displayed (Figure 5).
Library Services: offers a unified interface for the management of library services.
Admin Module: the main interface through which the library staff validates and normalizes data input into SIGI, manages data catalogues, etc.


Bibliographic and academic information is entered into the SIGI system mainly through two means: by the researchers themselves, as the system is the means to fill in and generate their annual activity reports, and by library staff, who periodically review entered information and performs manual searches of new items. The system can import full bibliographic records from the Web of Science and Scopus databases, automatically translating imported fields into their equivalents in the local database (which is tailored to the information needs of the institute). Direct import capabilities from other indices such as Scielo, Redalyc and Latindex could also be added with ease.
The information collected through any of these modules is normalized and curated through several means, both (semi-)automatic and manual. For instance, research articles submitted by users to the system are automatically checked for possible duplicates (using fuzzy string matching), with the user being presented choices if a possible duplicate. Normalization is also done manually through intuitive web-based user interfaces, which allow library staff to search through data catalogues and easily edit information.
SIGI contrasts with commercial RDM solutions such as Elsevier’s Pure (www.elsevier.com/solutions/pure), Clarivate’s Converis (https://clarivate.com/webofsciencegroup/solutions/converis/) or Symplectic’s Elements Platform (https://www.symplectic.co.uk/theelementsplatform/), which aim at offering one-size-fits-all data analysis services and products, at a substantial price tag. While this constitutes a possibly alternative, non-profit academic projects created and developed within universities (such as SIGI) are in a much better position to offer solutions tailored to the specific needs of the institutions with a minimal resource investment. SIGI benefits from and builds upon the high adaptability and collaboration potential of open-source software.
Compared to similar open-source initiatives, such as VIVO (https://duraspace.org/vivo/), SIGI innovates by integrating a wider range of types of academic information (with the goal of building a more complete picture of academic life through data), and by offering added-value services to the institute, all from a centralized information platform. One example of the latter is the student information system, which is used not only to track academic progress and to generate associated indicators, but also to control student access at the institute’s entrance booth.
Results
Bibliometric indicators generated by SIGI
The SIGI database was designed with the generation of indicators in mind, be they of bibliometric type or related to human resources, teaching, outreach, etc. Because of this, SIGI offers indicators that cannot be computed from public bibliographic databases, including participation in academic events, directed theses, outreach events and publications for the general public, etc. Hence, SIGI can be used to characterize individual researchers, the department or the institution as a whole, not only by their traditional scientific production but by all aspects of academic life.
We started developing SIGI around 2005, directly using data from the ICN institute at the UNAM. The historical data of this institute since 1970 was retrospectively captured either from bibliographic electronic databases or manually from paper records, and now includes almost 8000 documents of all types, more than 2700 student records, and recognizes thousands of authors and hundreds of academic journals. From this ICN database, SIGI currently generates over a hundred indicators that allow to draw a very complete picture of the Institute’s activity.
These indicators can be roughly grouped in 5 categories (Peralta González, Frías Guzmán, and Gregorio-Chaviano, 2015):
Scientific production: refereed and non-refereed research publications, patents and software. Indicators are computed at the individual researcher, department and institute levels.
Visibility and impact: the number and type of participation in academic conferences and outreach events, as well as published outreach documents and audiovisual items.
Scientific activity, students and teaching: statistics on courses taught, theses (graduated and in process), student projects and postdoctoral researchers.
Scientific activity, research grants and financing: research grants, student scholarships, and other financing sources obtained by researchers, as indicators of scientific activity and achievement.
Scientific activity, individual achievements: awards and prizes obtained by researchers and professional advancement categories (e.g., pay grade category and tenure status).
SIGI includes the capability to export data and indicators in popular data exchange formats such as CSV or XML, which allows the data to be loaded and analyzed using other tools.
In Figure 3 we show the scientific production of the ICN for all years on record. It is clear that the Institute’s main focus is the publication of academic refereed journal articles. Figure 4 shows the academic journals in which the ICN publishes. We clearly see that physics (including astrophysics) and chemistry are the main research areas, and that the vast majority of publications are in international journals. Figure 5 shows examples from the public profile generated for each ICN academic (https://sigi.nucleares.unam.mx/sgiicn/people), which is populated automatically with indicators and statistics obtained from the ICN Metrics module.
The scientific production can also be broken down by researchers and aggregated by academic department within the ICN. This is shown in Figure 6 for the 2015-2019 period, yielding a useful comparison of the productivity of researchers and departments. Each vertical bar represents the production of individual researchers, who are grouped by academic department (EM: Structure of Matter, FAE: High Energy Physics, FPIRM: Plasma Physics, GTC: Gravitation and Field Theory, QRR: Radiation Chemistry).
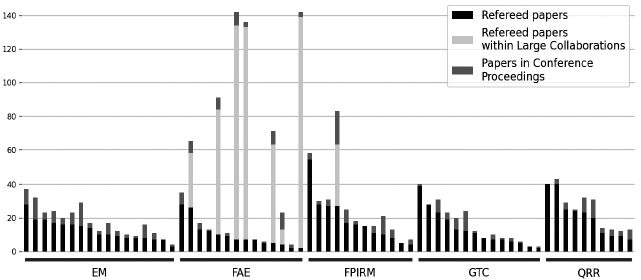
Figure 6 Scientific production (refereed journal publications and conference proceedings) of ICN broken down by individual researcher and by academic department in the 2015-2019 period. Articles with more than 50 authors are further identified as belonging to Large Collaborations
Notably, we see that the production of the High Energy Physics (FAE) department is dominated by the participation in Large Collaborations (in dark black defined as articles having more than 50 authors), a rising mode of academic output in some fields of science. Excluding large collaborations, the distribution of individual productivity within each department is similar across departments.
Indicators related to other academic activities
The SIGI system includes information that is not found in public bibliographic databases such as the Web of Science (i.e., research publications) that are also important parts of academic activity. One such example are indicators related to participation in academic events. Also calculated are indicators related to academic mobility, such as research visits abroad by ICN researchers and visiting scholars from other institutions.
Another group of indicators not directly related to academic production computed by SIGI are those tied to student activity: university courses taught by institutional researchers (at both undergraduate and graduate levels), social service students (a roughly 6-month academic internship that undergraduate students must complete during their last year), and, importantly, the direction of theses in the three academic levels recognized in Mexico (bachelor’s, master’s and doctorate). Tracking this kind of indicators is crucial if academic evaluation is to shift away from the dominance of research articles as the main evaluation metric used in many contexts worldwide. The task of tracking this information naturally falls on the information units and libraries of universities.
Analysis of academic collaboration
An interesting example of metric analysis that can be extracted from SIGI data is the collaboration network between the institutional researchers. Bibliographic data of all refereed research articles published by 104 researchers in the 2009-2019 period was exported from SIGI, including those of Large Collaborations. This yielded 1634 records. Using Python code we analyzed the authors field of the records, identifying co-authorships of the Institute’s researchers. We excluded academics with no publications in the studied period (84 academics remained).
The resulting collaboration network was visualized using the open-source software Gephi (gephi.org) and is shown in Figure 7. Each circle (node) represents a researcher, its size proportional to the number of published articles in the studied period. Links between researchers indicate co-authorships, with the width of the line proportional to the number of collaborations. The tones of grey of the circles and links correspond to the different departments and information units of the ICN. The Fruchterman-Reingold algorithm was used to direct the node placement in the plot, resulting in a natural spatial grouping of clusters.
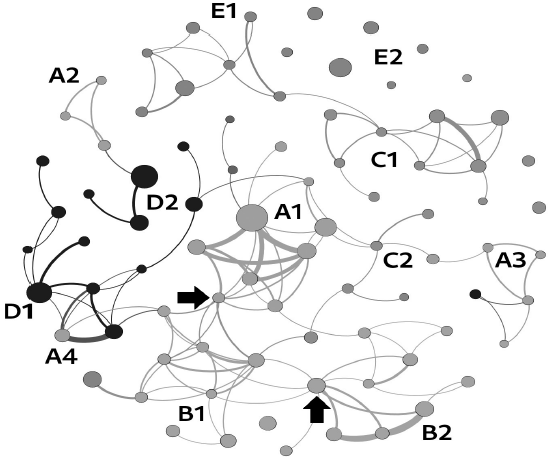
Figure 7 Scientific collaboration map of the Institute. Each circle is a researcher, its size proportional to the number of published articles in 2015-2019; links indicate the frequency of co-authorships between two researchers. The individual departments are indicated with different shades of grey
Several interesting patterns are observed in the map. While the collaborations mainly cluster according to the five academic departments (which means that intra-department collaborations are more frequent than inter-department ones), all departments are somewhat fragmented into smaller sub-clusters of researchers. For instance, one of the departments (FPIRM) is separated into a main cluster (indicated as A1 in the Figure 7), two smaller isolated clusters (A2 and A3) and one researcher with no intra-department collaborations (A4). Three of the other departments display two distinct clusters (B1 and B2, C1 and C2, D1 and D2). Curiously, the last department is split into one main cluster (E1) and a set of researchers with no collaborations whatsoever within the institute, at least in the study period (E2).
The strong clustering of departments is an indication of the strong coherency and affinity in the research areas of the Institute, while the sub-department fragmentation speaks of further specialization (for instance, the main cluster, A1, is composed of researchers in plasma astrophysics, while the researchers of the other clusters of this department work in fusion plasmas and laboratory plasmas) or of interpersonal relationships among researchers.
It is interesting to note that inter-department collaborations are often mediated by researchers that act as bridges by collaborating with researchers from more than one department. The two best examples are the two researchers indicated by the black arrows. The one on the left connects clusters A1 and B1 of two departments, while the other one connects two clusters B1 and B2 within the same department. These researchers act to transfer knowledge and techniques from one research area to another and constitute good examples of the rising trend of multidisciplinary research. The analysis also reveals that 10 out of 84 researchers do not collaborate (at least within the studied period) with the rest of the academic community of the Institute.
Figure 8 shows the same graph but with node sizes indicating the number of collaborations (not publications as in Figure 7). Only one researcher coincides in being both highly productive and highly collaborative (the central node in cluster B1). One could infer from this that, at least in this particular field of science, productivity and collaboration are not necessarily linked. This highlights the separate importance of highly collaborative researchers, suggesting that a full characterization of a researcher should look beyond common indicators like the number of publications.

In Figure 9 we show computed network metrics for the large, connected component (N = 52, shown in the right panel) of the collaboration network of the ICN. The histograms are the degree distribution (left) and the distribution of node distances (shortest path lengths); also shown to the right are the other two smaller connected components. While this component is too small to reliably determine whether it is scale-free, the distribution does exhibit a downwards trend, with most researchers having few collaborations and a few researchers (the hubs that we identified above) having a large number of collaborations. The shortest path length distribution reveals a slightly right-tailed distribution with a small average distance of 4.26 and an intermediate average clustering coefficient of 0.412. This suggests that the network may be considered "small-world", where the average distance between nodes is short despite the network not being very highly interconnected (as indicated by the intermediate clustering coefficient). This is confirmed by computing the "small-worldness coefficient" σ of Humphries and Gurney (2008), which for the largest component yields σ = 3.41, where a value of larger than one indicates a small-world network.
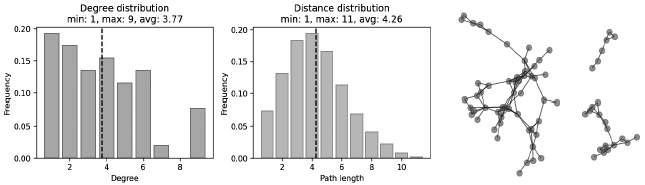
Figure 9 Network metrics of the ICN internal collaboration network: degree distribution (left) and path lengths distribution (center) for the largest connected component (52 nodes). This component, as well as the two other smaller connected components, are shown in the right panel
Using SIGI data we can also study the international collaboration network of the ICN. From the same data set spanning the 2009-2019 period we extracted the country information from the author affiliations. From this we mapped the geographical distribution of the ICN’s international collaborations using the Python cartographic library (scitools.org.uk/cartopy).
The resulting map, with grey scale shading indicating the number of refereed articles with at least one non-Mexican co-author, is shown in Figure 10. The Institute maintains collaborations with researchers from 74 countries, with the bulk being with Germany and Italy in Europe and the United States in the American continent. We also identified a few collaborations with countries with small populations or with emerging scientific traditions, such as Bangladesh and Ghana.

Analysis of keyword frequencies in academic publications
Another interesting analysis that can be extracted (and in the future automated) from the SIGI database is semantic analysis of the frequencies of keywords associated with academic publications. The keywords of 2465 refereed journal articles published by our example institution in the 2009-2019 period were extracted from our ICN database. We carried out an effort to manually normalize these keywords by identifying synonyms and abbreviations (such as "QFT" and "quantum field theory") and grouping them into synonymic sets. Keywords of little semantic value such as "origin", "generation" and "objects" were also removed from the analysis. The frequencies of the resulting keywords were then counted for articles published in two separate time periods, from 2009 to 2013 and from 2014 to 2019. Comparing the analyses over two periods lets us track the evolution of research interests over time while maximizing the statistics in each period.
Figure 11 shows two-word clouds of the 100 most common keywords found in all publications in the two time periods. It is made clear that the creation of theoretical models is the main academic focus of the institute and that this remains a constant through time. We also recognize the specific main fields of research of the institute by noticing keywords that remain frequent in both time periods: ISM jets & outflows (astrophysics), field theory, quantum mechanics and states, general relativity, gravitation (theoretical physics) and irradiation and thermoluminescence (chemistry).
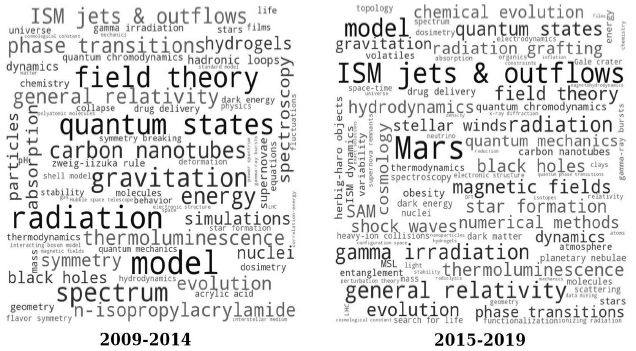
Figure 11 Word clouds showing the most frequent keywords in academic publications of the Institute for the 2009-2014 (left) and 2015-2019 (right) time periods
Another interesting result is detecting keywords that either gained or lost prominence between these two time periods. One example is "carbon nanotubes", which was the 7th most frequent keyword in the first period but fell to the 30th in the second, echoing the global decline in interest in this research topic after its peak in the first decade of the 21st century. Another example is "Mars", which rose to become the most frequent keyword in the second period while not even appearing in the top 100 in the first period. In this case this reflects the simple fact that this keyword appears in NASA collaborations related to the Curiosity rover, which landed on Mars in 2012.
Conclusions
The SIGI system is a valuable tool for Research Data Management that allows the collection, storage, validation and analysis of all academic activity of a teaching-research institution. Based mainly on the data captured by the researchers as part of their annual reports, it integrates information from traditional scientific production with other aspects of academic activity into a user-friendly web-based application. From this rich database, SIGI automatically calculates a variety of metric indicators that are useful to fulfill evaluation requirements, as well as preparing data for further scientometric analysis.
In this article we described the ideas behind the genesis of the SIGI system, described the software architecture and the main modules and services, and showcased some of the generated scientometric indicators and analyses that can be performed. From this database SIGI builds an integral characterization of the academic trajectory of individual researchers, departments and the institution as a whole. This characterization goes beyond the main academic production metrics to include other activities that also constitute important parts of academic life.
Using a database generated for a particular research institute, the ICNUNAM, we showed some of the main data products and indicators produced by SIGI. These include automatically generated public researcher profiles as well as various metric indicators and statistics that summarize the Institute’s academic activity. We showed how from this information it is possible to conduct further analyses, such as mapping the internal and external collaboration networks. We also showed other useful indicators not centered on direct academic production, such as participation in academic events and scholarly visits, as well as those associated with teaching and students (which is an important academic activity in all research universities), including courses taught and graduated students.
This paper gives an overview of the design philosophy, the implementation details and the actual results obtained with the new system. It is aimed at providing a valuable example for other academic libraries that wish to embark on the RDM initiative even if they do not have access to the resources that inter-institutional consortia or national efforts can leverage. In the future, we propose to support the implementation of the SIGI to study and manage the indicators of other institutions.
The potential impact of SIGI is clear from our institute’s experience with the system, as not only the researchers but also the outreach and administrative departments of the institute have benefited from its information products and services. The system’s adaptability and flexibility has allowed our small academic library to implement the RDM principles, with tangible benefits to our community.
We hope that this study can serve as an example of the creation and operation of RDM services by specialized units within academic libraries in Latin America. Our experience in developing this project, and the presented details on design, implementation and results, might be a useful reference for other small academic libraries seeking to assume a more central role in the RDM philosophy without a great expenditure of resources. Furthermore, the collected research data and generated metric indicators are by themselves interesting from a scientometric point of view, as shown by the two scientometric analysis examples that we presented.

