


 nova página do texto(beta)
 Inglês (pdf)
 Artigo em XML
 Referências do artigo
 Enviar este artigo por email
 Citado por SciELO
  Similares em
SciELO
Similares em
SciELO 
 Permalink
Introduction
Libraries as one of the main learning centres provide a variety of services to support teaching, learning and scientific research activities in societies. They are expected to provide the best possible services (Fernández Ramos, 2016). However, with the advent of new technologies, the dominant role of libraries as information providers have been challenged. The libraries, further, are facing other challenges including the budget cuts and changing expectations of the users (Hernon, Dugan, and Matthews, 2014).
By addressing such concerns, libraries need to evaluate their performances and promote the quality of their services. The evaluations of the library’s performances often focused on meeting the user’s expectations, and the ways libraries use available resources to provide high-quality services to their clients (Kwak and Young, 2002). Over the past few decades, parametric and non-parametric methods have increasingly been used to measure and analyze the performance of library services. Performance can be defined as an appropriate combination of efficiency and effectiveness.
Efficiency generally refers to the use of the minimum number of inputs for a given number of outputs. Various models and frameworks have been used to evaluate the efficiency performance of libraries. These models including ratio analysis, Least-Squares Regression (LSR), Stochastic Frontier Analysis (SFA) and Data Envelopment Analysis (DEA) are often used to determine how well a unit or service is realising its intended objectives (Ozcan, 2014; Saunders, 2003). The DEA model has widely been used to evaluate the performance of institutions and organizations in recent years (Emrouznejad and Yang, 2017). Given the nature of libraries in using multiple input and output variables to produce multiple and varied services, DEA is more capable in analysing and evaluating the performance of libraries.
DEA measures the relative efficiencies of organizations with multiple inputs and multiple outputs according to the flow of time. As a nonparametric linear programming-based technique, DEA develops an efficiency frontier by optimizing the weighted output/input ratio of each provider, subject to the condition that this ratio can equal, but never exceed, unity for any other provider in the data set (Noh, 2012). Further, DEA provides an efficiency score for each of the inefficient units, as well as a benchmark set of efficient units that lead to that conclusion. The results of the DEA analysis can be used in the performance measurement of libraries, especially for benchmarking purposes.
The efficient library based on the DEA model can be defined as a library that uses minimal input for a given level of service (input-oriented) or the highest output at the same level of input (output-oriented). This can represent the degree of relative efficiency of libraries under study, suggesting that an efficient library is a benchmark and model for inefficient libraries (Reichmann, 2004). The homogeneity of the units to be evaluated, the use of appropriate input and output variables, and the selection of a suitable number of Decision Making Unit (DMU)s are among the requirements of this type of study.
Data Envelopment Analysis (DEA)
In this section the fundamental concepts of DEA are briefly reviewed. Charnes, Cooper, and Rhodes (1978) initially introduced DEA as a nonparametric efficiency evaluation method. Their model is known as CCR constant return to scale model. DEA is usually applied to evaluate the performance of a set of homogeneous units, called DMU that uses a vector of input variables to produce a vector of output variables. Suppose that there are n DMUs, where each (DMU)_j,j=1,2,…,n, used m-dimensional input vector x_j to produce an s-dimensional output vector y_j. The set of all DMUs constitute the production possibility set (P). If X and Y be the input and output matrices of DMUs, the CCR model production possibility set is constitute as below (cf. Cooper, Seiford, and Tone 2006; Tone, 2017):
The above production possibility set is constructed based on the assumptions that (1) all DMUs belong to the P, (2) P follows constant return to scale property, i.e. if (x,y)ϵP then (tx,ty)ϵP, (3) if (x,y) ϵP, then (x ̄,y ̄)ϵP for any x ̄≤ and y ̄≤y, and (4)P is a convex set (Cooper, Seiford, and Tone, 2006; Tone, 2017). Charnes, Cooper, and Rhodes (1978) proposed a non-linear programming model to find the relative efficiency θ for any DMU being evaluated. This nonlinear model is transformed into a linear equivalent as below:
The further extensions on DEA models are proposed by changing the properties of P. One the prominent extensions of CCR model is proposed by Banker, Charnes and Cooper (1984) as BCC model by removing the assumption of constant return to scale. In another direction, some models like additive model (Ali and Seiford, 1993) or slack-based measure (Tone, 2001) eliminate the radial efficiency assumption of DEA models, i.e. presence of a radial value of θ. Also, Deprins, Simar, and Tulkens (2006) proposed free disposal hull (FDH) model based on the idea of evaluating efficiency based on only actually observed performances. For a detailed discussion about DEA models, readers are referred to Cooper, Seiford, and Tone (2006), and Tone (2017).
Regarding the necessity of more attention and familiarity with DEA and its application process in libraries performance evaluation studies in different countries over the past two decades, this study aimed to identify, thematic analysis, categorize, and summarise the current published literature about library performance evaluation with DEA. For this purpose, we used systematic mapping to investigate the status and trend of DEA use in performance evaluation investigations in libraries. Mapping studies are also reviews, but they do not discuss the findings. They are based on the concept that published articles not only represent findings, but, indirectly, represent activity related to the finding. It indicates where the research took place and, of course, in what journal it was published. So mapping collects data on kinds of activity, locations where it occurs, and media where it is published (Cooper, 2016).
Research aims
This study is aimed to provide insights on the state-of-the-art of the current research about performance evaluation of libraries using the DEA. In the reviewed studies particular attention was paid to the following issues:
How do published articles distributed chronologically?
In which journals the articles have been published?
What is the status of articles in terms of citation/scientific impact and specialized fields of researchers?
Which DEA models have been used?
What is the status of published articles regarding the adequacy of the number of DMUs (rule-of-thumb)?
Which input and output variables are considered in the reviewed articles?
Which variables are listed as slack factors (inadequate) of inefficient units that have been cited in papers?
Methodology
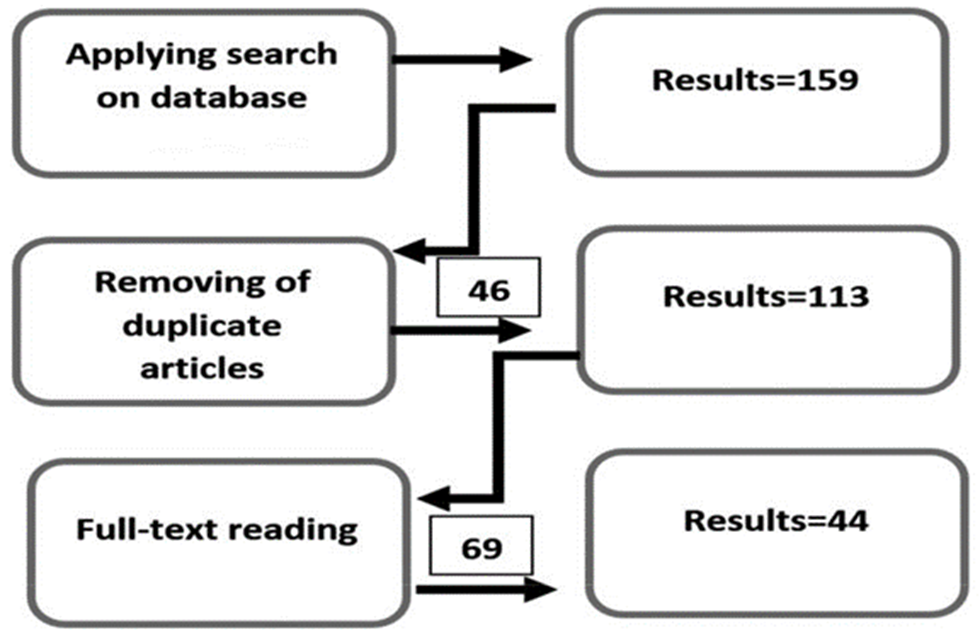
Providing an overview - in most of the cases a visual summary −, systematic mapping study enable us to identify, thematic analysis, categorize, and summarize the research in a specific research filed for a specific period (Cooper, 2016). The mapping process consists of three activities: (i) search for relevant publications, (ii) definition of a classification scheme, and (iii) mapping of publications (Petersen, Vakkalanka, and Kuzniarz, 2015). Further, systematic mapping study outlines an overview of the conducted studies’ method, findings, and trends over time. This can lead to identify the research gaps, establish facts, and draw new conclusions in the addressed research filed. It can be argued that the systematic mapping study is closely aligned with the systematic literature review (SLR), which is aimed to evaluate and compare the findings of the studies in a research area (Bailey et al., 2007). The systematic mapping is, however, differed from systematic review in terms of the aim, breadth, depth, implications and validity issues (Akoka, Comyn-Wattiau, and Laoufi, 2017). The following steps particularly were carried out to obtain an overview of the current research about performance evaluation of Libraries using DEA (Figure 1):
Defining the research questions,
Identifying and selecting related articles,
Providing the first outline of the selected articles,
Analysing selected article keywords and abstracts as the benchmark to exclude the unrelated articles,
Analysing the included articles and extraction of information and mapping of presentation.
Search strategy
The search process was initiated early in the planning process of this mapping study by defining and delimiting the relevant search concepts.
The search string used to perform the automatic research in selected citation Databases was formulated as follows:
SCOPUS
TITLE-ABS-KEY ( ( dea OR ( data AND envelopment AND analysis ) )
AND librar* )
WEB OF SCIENCE
TS=( ( dea OR ( data AND envelopment AND analysis ) ) AND librar* )
This search string was applied in the title, abstract and keywords of the investigated papers to reduce the search results. The formal searches is conducted by the first author in 20th of April 2019. The complete search and inclusion process is illustrated in Figure 1. We limited the formal search to peer-reviewed articles, including original and review articles which is written in the English language.
In addition to manual classifications of the articles, the articles abstracts were also organized based on their focus using Mendeley 44 articles were selected for further review.
Inclusion criteria and data classification
To explore the current trends and the relevant research papers, a systematic review was performed within Web of Science and Scopus. Initially, a combination of the following keywords “Library”, “Data Envelopment Analysis”, and “DEA” were searched in any of the given Databases. 159 sources were found in the database search. For further exploration and prevent unnecessary duplicate entries, the articles were inserted to Endnote. The article which is written in other languages than English as well as duplicate entries were removed. 46 duplicate entries were detached from the collection. In the second step, 113 articles were selected for detailed review. The title, keywords, and abstracts of these articles were precisely reviewed. Finally, 44 articles met the following inclusion and exclusion criteria:
Original research articles published in scientific journals and conferences and indexed at Scopus and Web of Science databases.
Peer-reviewed and written in English.
Relevance to the given keywords.
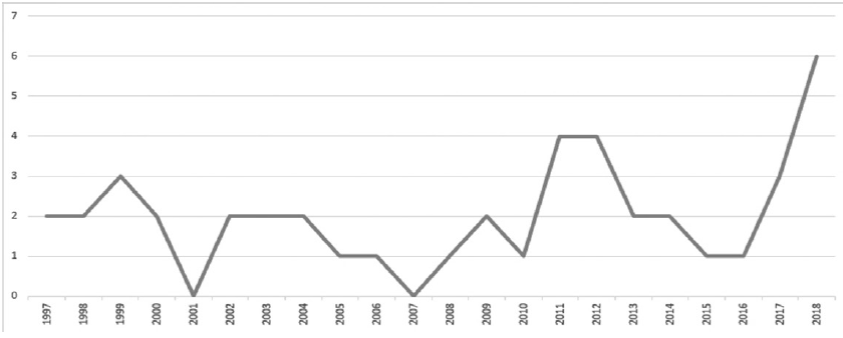
Published articles between 1997 and 2018. As indicted in Figure 2, the first articles about library performance evaluation using DEA were published in 1997. Therefore, we could include just articles published between 1997 and 2018.
Results
Initially, an overview of the chronological and background of the published studies on library performance evaluation based on DEA are outlined. Figure 2 demonstrates the chronological distribution of the 44 identified articles published between 1997 and 2018.
As indicated in Figure 2, the first articles focused on library performance evaluation using DEA were published in 1997. These articles focused on evaluating the performance of academic libraries in Taiwan and the United States which were written by the same author i.e. Chen (1997a, 1997b). No article was published in 2001 and 2007, but there is a significant increase in 2017 and 2018.
Studies conducted up to 2000 were mostly centred on assessing the university libraries. About 66% of the published studies have focused on academic libraries; however, there has been a significant increase to assess the performance of public libraries in recent years. For example, five out of seven studies conducted between 2015 and 2018 are related to performance evaluation of public libraries.
Interestingly, a large number of the published articles about evaluation of performance in public libraries have been carried out in the United States. More than 40% of the studies about academic libraries have been conducted in Taiwan (Table 1).
Table 1 Distribution of published articles based on the type of library and location of studied libraries
| No. | Country | No. of publications | Type of library | |
|---|---|---|---|---|
| Public | Academic | |||
| 1 | Taiwan | 9 | 0 | 9 |
| 2 | USA | 8 | 4 | 4 |
| 3 | Austria | 4 | 0 | 4 |
| 4 | China | 4 | 1 | 3 |
| 5 | South Korea | 3 | 0 | 3 |
| 6 | Brazil | 3 | 0 | 3 |
| 7 | UK | 2 | 1 | 1 |
| 8 | Czech | 2 | 2 | 0 |
| 9 | Others | 9 | 7 | 2 |
| Sum | 44 | 15 | 29 | |
| Percent | 100% | 34.1 | 65.9 | |
Distribution of published work in different journals
As demonstrated in Figure 3, the International Journal of Production Economics with 3 articles has published the largest number of articles about performance evaluation of libraries using DEA over the past 22 years. Seven journals including Socio-Economic Planning Sciences, Performance Measurement and Metrics, and Libri have published two articles (i.e. two articles in each of the given journals and 14 articles all together). Remaining papers i.e. 27 articles are scattered among 27 journals.
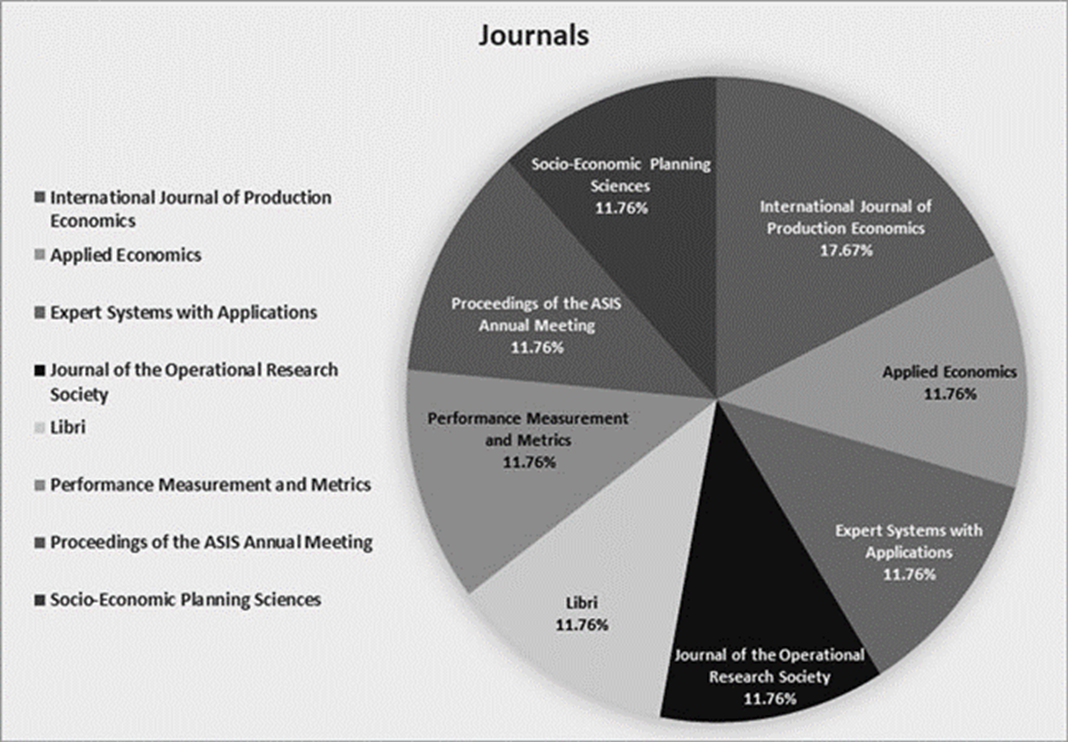
Ironically, only one journal in the field of library and information science has showed interest to publish articles about evaluating library performance using DEA.
The current situation and citation impact
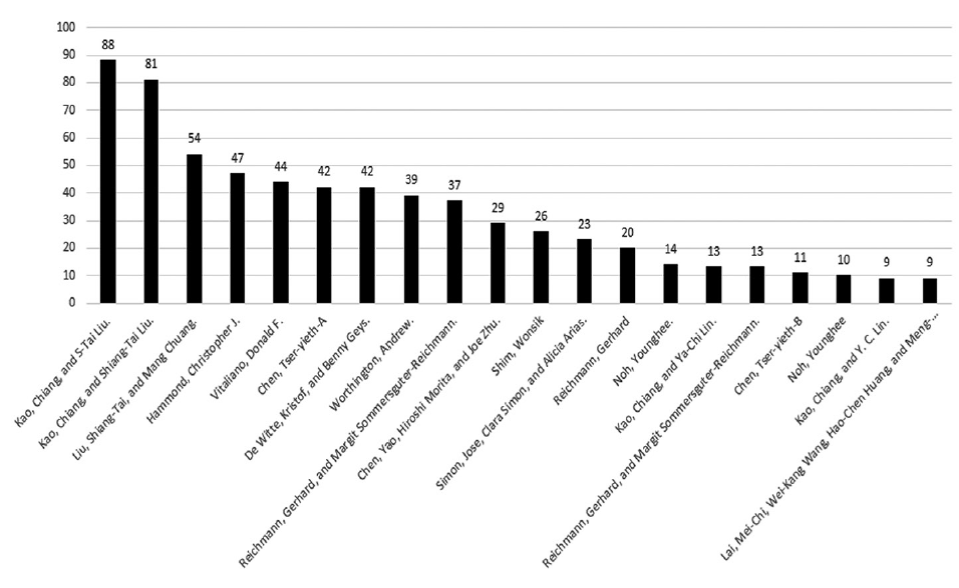
Citation as an indicator is showing the importance and impact of an article in a research area. The most cited authors in evaluating the performance of libraries were respectively expert in the Economics, Management and Library and information science. Among the authors, Kao from Taiwan received a total of 169 citations for his two papers, followed by Liu from Taiwan and Hammond from England.
The articles having high citations are often published in journals of fields other than library and information science, including operational research, economics, and computer science. Only two articles, namely Shim (2003) and Reichmann (2004) published in library and information science journals have been listed as high-citation articles.
DEA models
A variety of models of ِDEA techniques have been used in the collected articles. As outlined in Table 2, 41% of the published articles have utilized basic CCR, BCC or a combination of the two models (CCR & BCC). Other models such as Assurance Region and fuzzy DEA have particularly been used in recent evaluation studies. In some of the studies, other models including Free Disposal Hull Approach, Stochastic Frontier Regression and Malmquist index approach along with DEA were employed to evaluate the library’s performances.
Table 2 DEA models used in studies
| DEA models | Publications* | No.of publications | % |
|---|---|---|---|
| BCC (VRS) | 1,8,11,15,21,26,39 | 7 | 15% |
| CCR (CRS) | 16,24,31,34,35,37,43 | 7 | 15% |
| Assurance Region | 5,6,8,13,14,20 | 6 | 13% |
| CCR & BCC | 22,24,33,38,40 | 5 | 11% |
| DEA & Bootstrap | 23,25,33,37,40 | 5 | 11% |
| FUZZY DEA | 9,12,20,22 | 4 | 9% |
| DEA & Free Disposal Hull Approach | 23,33,41 | 3 | 7% |
| DEA & Stochastic frontier regression | 3,11 | 2 | 5% |
| DEA & Malmquist index approach160 | 21,25 | 2 | 4% |
| Network DEA | 40 | 1 | 2% |
| DEA & Markovian Hypothesis | 26 | 1 | 2% |
| Dynamic DEA modelling | 43 | 1 | 2% |
| Multiple Criteria DEA (MCDEA) | 27 | 1 | 2% |
| DEA & Cluster Analysis | 37 | 1 | 2% |
* See the list of references with numbers in Appendix 1
Adequacy of the number of DMUs
Using a rule known as the “rule of thumb” for selecting an appropriate sample size in DEA can help us to avoid model saturation effects. According to this rule, the appropriate sample size in the DEA should not be less than three times the total number of input and output variables used in the study. The efficiency of a particular DMU in evaluating the library’s performance mostly depends on the selected input and output variables.
Table 3 shows the distribution of decision-making units as well as the selected input and output variables in the published studies. The data shows that more than 84% of studies had an appropriate sample size − less than one-third of total input and output variables based on the rule of thumb −, and 16% of them had an inappropriate sample size.
Table 3 Distribution of articles based on the number of DMUs (sample size) and inputs and outputs
| Author | Year | DMU | Input | Output | Rule of thumb |
|---|---|---|---|---|---|
| Chen | 1997a | 23 | 3 | 4 | Yes |
| Chen | 1997b | 23 | 3 | 4 | Yes |
| Vitaliano | 1998 | 184 | 4 | 2 | Yes |
| Shim and Kantor | 1998 | 95 | 10 | 5 | Yes |
| Shim and Kantor | 1999 | 95 | 10 | 5 | Yes |
| Worthington | 1999 | 168 | 8 | 3 | Yes |
| Kao and Liu | 2000 | 24 | 5 | 1 | Yes |
| Shim | 2000 | 95 | 9 | 3 | Yes |
| Hammond | 2002 | 99 | 3 | 6 | Yes |
| Kao and Liu | 2003 | 24 | 1 | 5 | Yes |
| Saunders | 2003 | 88 | 1 | 6 | Yes |
| Shim | 2003 | 95 | 10 | 5 | Yes |
| Kao and Lin | 2004 | 89 | 4 | 11 | Yes |
| Reichmann | 2004 | 118 | 6 | 3 | Yes |
| Chen, Morita, and Zhu | 2005 | 23 | 4 | 2 | Yes |
| Reichmann and Sommersguter-Reichmann | 2006 | 118 | 2 | 4 | Yes |
| Miidla and Kikas | 2009 | 20 | 4 | 2 | Yes |
| Liu and Chuang | 2009 | 24 | 5 | 5* | No |
| Reichmann and Sommersguter-Reichmann | 2010 | 68 | 2 | 3 | Yes |
| Lai et al. | 2011 | 33 | 3 | 3 | Yes |
| Simon, Simon, and Arias | 2011 | 34 | 4 | 7 | Yes |
| Noh | 2011 | 89 | 8 | 4 | Yes |
| De Witte and Geys | 2011 | 290 | 3 | 4 | Yes |
| Morovati Sharifabadi, Tahari Mehrjadi, and Babaei Mybodi | 2012 | 30 | 6 | 3 | Yes |
| Noh | 2012 | 20 | 12 | 10* | No |
| De Carvalho et al. | 2012 | 37 | 3 | 4 | Yes |
| Shahwan and Kaba | 2013 | 11 | 3 | 3* | No |
| Lee, Kwak, and Garrett | 2013 | 25 | 4 | 4 | Yes |
| Hsieh, Chin, and Wu | 2014 | 16 | 3 | 3* | No |
| Stroobants and Bouckaert | 2014 | 79 | 1 | 1 | Yes |
| Clark | 2015 | 35 | 5 | 10* | No |
| Han and Sun | 2016 | 12 | 4 | 3* | No |
| Vrabková and Friedrich | 2017 | 33 | 3 | 1 | Yes |
| Srakar et al. | 2017 | 58 | 9 | 8 | Yes |
| Vrabková | 2018 | 34 | 6 | 3 | Yes |
| Guccio, Mignosa and Rizzo | 2018 | 44 | 4 | 4 | Yes |
| Guajardo | 2018 | 999 | 17 | 3 | Yes |
| Neto and Hall | 2018 | 98 | 4 | 4 | Yes |
*In these studies, the number of DMUs is less than the expected level, which makes the unit performance to be falsely higher.
Addressed input and output variables and DMUs
The input and output variables define the efficiency of DMUs. Identifying appropriate inputs and outputs variables can inform the performance of DMUs. These inputs and outputs variables are identified based on the type of library, available resources and the type of services to be provided to different users (Table 4). In the reviewed articles, variables such as human resources (labour), financial resources (current costs, salaries, etc.) and physical resources (space, library equipment, etc.) are considered as main inputs. Other variables including products and provided services including the number of users, hours of service, and circulation volume are used as key outputs.
Table 4 Distributions of input and output used in papers
| No. | Inputs variables | Freq. | No. | Output variables | Freq. |
|---|---|---|---|---|---|
| 1 | Staff (1,2,3,4,6,10,11,12,13,15, 16,17,19,21,22,23,24,25,26, 27,30,31,32,33,34,35,37,38, 39,40,41,43) | 32 | 1 | Book circulation (1,2,3,4,6,8,10, 11,12,15,16,17,19,21,22,24,25, 26,27,30,31,32,33,34,35,37, 38,40,41,43) | 30 |
| 2 | Library collection (1,2,4,9,10,13, 15,16,17,19,20,24,26,27,30,31, 33,34,38,41,40) | 21 | 2 | Reader (1,2,16,19,20,24,25,26, 27,32,34,35,37,38,39, 40,41,43) | 18 |
| 3 | Library space (1,2,7,9,16,19,20, 24,25,27,26,35,37,38,40) | 15 | 3 | Interlibrary lending (1,2,6,8,10,11,25,31,34,40) | 10 |
| 4 | Budget (9,20,24,25,30,31,33, 34,35,37,39,43,40) | 13 | 4 | Reference transaction (1,2,3,4,6,8,11,13,25,31) | 10 |
| 5 | Serials (3,4,8,10,24,38,40) | 7 | 5 | Opening hours (11,15,17,20,23,33,34,43,41) | 9 |
| 6 | Acquisition (1,2,11,19,32,33,34) | 7 | 6 | Instructions (4,6,8,13,25,34,37,41) | 8 |
| 7 | Volumes added (3,4,6,8,13,10) | 6 | 7 | Interlibrary borrowing (4,6,8,11,13,25,34) | 7 |
| 8 | Population (3,7,16,27,31,39) | 6 | 8 | Services (9,12,14,18,20,31,32) | 7 |
| 9 | Opening hours (3,7,10,38,43) | 5 | 9 | Cards (27,26,30,35,37,38) | 6 |
| 10 | Student employee (4,6,8,13,34) | 5 | 10 | Collection (9,12,14,18,40) | 5 |
| 11 | Equipment (24,27,32,40,41) | 5 | 11 | Expenditures (7,9,12,14,18) | 5 |
| 12 | Wages (11,19,23,32,39) | 5 | 12 | Building (9,12,14,18,22) | 5 |
| 13 | Monographs (4,6,8,13) | 4 | 13 | Book added (15,17,21,30) | 4 |
| 14 | Total student enrolment (4,6,13) | 3 | 14 | Serial subscriptions (15,17,21,40) | 4 |
| 15 | Patronage (9,12,14) | 3 | 15 | Employees (9,12,14,18) | 4 |
As shown in Table 4, variables such as employees (specialist staff, staff, and student employee), library collections, library space, budget, and library serial number were most used inputs in the published articles. Similarly, most used outputs in the articles were circulation of resources or book loan, reader visits and number of users, interlibrary loan, reference interactions, and libraries opening hours.
Highlighted slack variables (inadequate)
There are times when reduction of inputs or augmentation of outputs is not sufficient. For example, even when a Library reduces its input from 4 units to 2, there is still a gap between it and its peer library in the amount of one unit of output. In DEA, this is called the “slack” which means excess input or missing output that exists even after the proportional change in the input or the outputs (Shim, 2000). Identifying and controlling these variables are very important in DEA. In DEA, it is often assumed that all of the studied units can be inefficient. In the published studies, accordingly, inefficient decision-making units are examined determining the contributions of any of the input and output variables in the inefficiency of the unit. Table 5 demonstrate identified deficiencies (slacks) in the published studies. It is particularly indicated that work hours, resource circulation rates, collection of books, and budget per capita are some of the slack variables mentioned in papers.
Table 5 Input and output slacks of papers
| Author | Year | Slacks |
|---|---|---|
| Chen | 1997b | Book acquisition expenditure and book circulation |
| Chen | 1997a | Book circulation |
| Vitaliano | 1998 | Hours and the circulation |
| Worthington | 1999 | Expenditures per capita and issues per capita |
| Shim | 2000 | Circulation and books |
| Hammond | 2002 | Stock of books, audio-visual materials and opening hours |
| Miidla and Kikas | 2009 | Staff expenditure |
| Liu and Chuang | 2009 | The student size |
| Lai et al. | 2011 | User satisfaction, seat occupancy, and loans per student |
| Noh | 2011 | Electronic resources |
| Shahwan and Kaba | 2013 | Circulation, no. of books added, registered members books held, library staff, actual budget |
| Lee, Kwak, and Garret | 2013 | Total holdings, expenditure, staff, and total enrolment |
| Hsieh, Chin, and Wu | 2014 | Cost, collection and service |
| Vrabková and Friedrich | 2017 | The number of employees, and also the number of cultural and educational events |
| Srakar et al. | 2017 | Loans |
| Guajardo | 2018 | Operating costs |
Discussion
This article reports the findings of a systematic mapping study on library performance evaluation using DEA. 44 articles are included in four-staged selection and validation processes. The findings of the study suggests a significant increase in published articles about library performance evaluation using DEA starting mainly from 1997. This increase are intensified between 2015 and 2018. A large number of these studies (65%) are focused on evaluating academic libraries wherein 35% of reported researches are related to public library performance. Interestingly, a majority of the published studies evaluating the performance of public libraries are carried out in the United States and more than 40% of studies focused on academic library evaluations are conducted in Taiwan. Despite the commencement of studies in the USA, the majority of studies are published in Asian countries, especially in Taiwan.
Using the DEA technique in performance evaluation of the institutions has significantly increased wherein more than 1,200 articles have been published annually using the DEA technique (Emrouznejad and Yang, 2017). The number of published articles about library performance evaluation using DEA, however, has been steady between 1997 and 2018. Ironically, only three authors i.e. Noh, Kantor and Shim of the reviewed articles had a background in library and information science.
Our study demonstrates that the community of library and information sciences are using a range of DEA’s basic models to estimate the efficiency of DMUs. The analysis of the published papers shows that more than 40% of the studies have employed constant return to scale (CRS), basic frontier model (BCC) or a combination of CCR and BCC models. Further, other DEA models such as Assurance Region and Fuzzy DEA have been used in recent evaluation studies. In addition to the basic models of DEA techniques, new models have been developed and applied depending on the subject and application in different subject areas (Gattoufi, Oral, and Reisman, 2004). Probably one of the reasons for using more basic models, is limited access to the types of libraries operational data and the lack of researchers’ dominance on the new models.
In some studies, further, other tools such as Free Disposal Hull Approach (Stroobants and Bouckaert, 2014), Stochastic Frontier Regression (Saunders, 2003), and Malmquist Index approach along with DEA have utilized (Vrabková, 2018).
The selection of the correct and adequate number of input and output variables is very important in this type of study. There are, however, no standard variables to be applied in all studies; nevertheless, several variables have been repeated in a large number of studies (Tavares et al., 2018).
Different variables have been used according to the type of libraries under study, time of studies, authors of articles, and type of information resources in libraries (electronic or paper). For instance, variables such as the number of library events, entertaining and youth-specific information resources have been used to evaluate the performance of public libraries (Simón-Martín, Simón-Blas and Arias-Coello, 2016; De Witte and Geys, 2011). None-theless, variables like the number of students and full-time faculty members have been applied to assess the efficiency of academic libraries (Shim and Kantor, 1999; 1998).
By addressing the widespread availability of electronic resources, new variables including type and number of the electronic resources, subscribed or purchased databases as well as eBooks and electronic publications have been considered in evaluating the performance of libraries (Noh, 2011; Hwang, Shieh, and Hsieh, 2012). The explored variables can be broadly classified based on their controllability into Discretionary and Non-Discretionary. Discretionary variables address the variables that library managers can directly control including the number of books, the number of the staff as well as the service hours. On the other hand, there is a series of Non-Discretionary variables that are beyond the authority of the library managers such as the number of faculty members, number and quality of registered students in the university where the library is located (Guajardo, 2018; Worthington, 1999; Shim, 2003). Moreover, the findings of the study show that environmental factors are often beyond the control of library mangers’ authorities. However, these variables inform the performance of units or organizations under review (Reichmann, 2004).
Some variables including the number of employees, available resources, opening hours, the number of students and faculty members were seen as input variables in some studies and as output variables in others. For instance, the library’s staff is used as an input variable in most of the studies, however, it has been considered as an output variable in the Kao and Lin’s (2004) as well as Lili (2008) works.
In fact, sometimes it is not clear whether a particular variable is an input or an output. For example, the number of volumes added can be regarded as an input, because having more books can increase circulation or interlibrary transactions. But if we regard the number of volumes added as a result of the work done by collection development and cataloging librarians, it might be classified as an output. Similarly, the availability of the library resources (collection), personal and expenditures, can be considered either as an input (because if there are more personal and expenditure, output measures such as circulation and library opening hours will go up) or as a output (the consumption of the mentioned resources by libraries reflects a quality service to the user,) as opposed to the concept of efficiency (Kao and Liu, 2003; 2000; Shahwan and Kaba, 2013).
Variables such as educational and cultural programs, social justice and capital, information literacy and social solidarity have been used just in performance evaluation of public libraries (Vrabková, 2018; Guajardo, 2018). About 16% of studies (Table 4) do not follow the rule of thumb. This signifies that the number of libraries under study is less than three times the sum of input and output indices and in these studies, unrealistically, more decision-making units are shown to be efficient. Expenditure, circulation, and total holding of books, respectively, represent the largest contributors to the inefficiency of studies (i.e. as slack).
The findings of the study suggest that most of the published studies are conducted by researchers outside the field of library and information sciences, mostly by researchers who have had a background in management and economics. Furthermore, nearly 90% of the total citations of articles belong to the contribution of researchers from outside the library and information science. Most of the studies about evaluating the library’s performances using DEA has been published in non-library and information science journals. This may signifies that most of the librarians do not have enough statistical and mathematical knowledge to conduct and understand such studies. Thus, the researcher in the library and information sciences may need to expand their competences. The results also show that the articles published in journals focused on Management, and Economics received more attention and citation than those studies published in Library and information science publications. For example, Kao and Lin’s article published in 1999 in the Libri magazine has received only 13 citations, while Kao’s two later articles published in operations research and economics research journals earned more than 160 citations. By highlighting the advantages of using DEA over other performance measurement tools, this article encourages the researchers to use this technique in evaluating the performance of libraries.
Conclusion
Using the DEA technique to evaluating the performance of libraries can provide useful inputs to continues improvement of the libraries. A verity of studies has been conducted using the DEA technique to evaluate the performance of the organizations. The findings of this study identify gaps in terms of used techniques, methods, and processes about evaluating the performance of libraries. Identifying these gaps may help researcher in library and information sciences to pay further attention to research about performance evaluating of the libraries. This study, further, can serve as an initial source for future studies.
The study also identifies the key input and output variables in evaluating the library’s performance evaluation. Employees, space, information resources, and acquisition among input variables as well as library book circulation rates, number of clients, reference questions, and interlibrary loan rates were the most frequently used output variables in the published studies. These variables can help the gatekeepers of the libraries and information centers to evaluate the optimal use of library facilities. The finding of the study, further, show that more than 90% of citations are made to articles written by authors outside the library science field, including operational research and economics. Among the authors, Kao from Taiwan has received 169 citations for his two articles. High cited articles are often published in other subject areas journals including the Operational Research, Economics and Computer Science. To our surprise, just two articles have been published by the authors of the library and information science in LIS journals. As reflected in the discussion, it seems that the researchers in library and information sciences do not have enough skills to use statistically-based models such as DEA in their studies. Thus, it can be argued that providing workshops and courses such as “library performance evaluation models” emphasizing quantitative models like DEA can promote librarians’ and faculty members’ understandings and skills to conduct such studies.

