


Serviços Personalizados
Journal
Artigo
 Inglês (pdf)
 Artigo em XML
 Referências do artigo
 Enviar este artigo por email
Indicadores
-
 Citado por SciELO
 -
 Acessos
Links relacionados
-
 Similares em
SciELO
Similares em
SciELO
Compartilhar

 Permalink
Investigación bibliotecológica
versão On-line ISSN 2448-8321versão impressa ISSN 0187-358X
Investig. bibl vol.23 no.48 Ciudad de México Mai./Ago. 2009
Artículos
Analysis of the Social Network in Serial Publications: representation in the Journal of Documentation
Análisis de las redes sociales en las publicaciones seriadas: su representación en el Journal of Documentation
Adilson Luiz Pinto*, Beatriz Ainhize Rodríguez Barquín**, José Antonio Moreiro González,** André Kauric**
* Universidad Federal de Mato Grosso, Brasil. adilsonluiz@ufmt.br
** Los tres últimos autores pertenecen a la Universidad Carlos III de Madrid, España.(beatriz.rodriguez@uc3m.es); (jamore@bib.uc3m.is); (andrekauric@ibest.com.br).
Artículo recibido:18 de febrero de 2009.
Artículo aceptado: 25 de mayo de 2009.
ABSTRACT
The construction of maps of social networks is shown based in the Journal of Documentation during the period 1988–2005. The analysis is made by: (i) authors that produce the most within the publication, (ii) authors with the greatest centrality and frequency in quotes received, (iii) the documents with the highest number of citations during the period, and (iv) the journals most used in the consumption of information. 681 entries were retrieved, which were divided into 288 book reviews, 172 journal articles, 14 editorial materials, 12 article reviews, 9 reprints and 2 bibliographic items. The bibliographic information of the Institute for Scientific Information (ISI) was the original source for the treatment of the data and the program used was CiteSpace, which automatically generates the maps of relationships.
Keywords: Social Networks; Analysis of Journals; Information Consumption; Journal of Documentation.
RESUMEN
Se estudia la construcción de mapas de redes sociales utilizando como estudio de caso la revista Journal of Documentation en el periodo que va de 1988 al 2005. Se analizan (i) los autores que tienen mayor producción científica dentro de la publicación, (ii) los autores que alcanzan mejor centralidad y la mayor de frecuencia de co–citaciones recibidas, (iii) los documentos que tienen mayor número de citaciones en el periodo, y (iv) las revistas más utilizadas en el consumo de información. Fueron recuperados 681 documentos, divididos en 288 reseñas de libro, 172 artículos de revista, 14 materiales editoriales, 12 revisiones de artículos, 9 reimpresiones y 2 artículos bibliográficos. Mientras que la información bibliográfica del paquete del Institute for Scientific Information (ISI) sirvió como fuente original, para el tratamiento de los datos se utilizó el programa CiteSpace, que genera los mapas de relaciones automáticamente.
Palabras clave: Redes sociales; Análisis de revistas; Consumo de información; Journal of Documentation.
Introduction
The research was aimed to the search and recuperation of articles that deal with social networks in journals as scientific publications, since these are an important indicator for observing the relationships between scientists or institutions. As case study, we carried out an analysis of the Journal of Documentation (JDoc) during the period between 1998 and 2005.
It was fundamental to observe two separate aspects, the social network and the possible scientific indicators that can be generated with an analysis of this breadth.
The denomination of the social network in the areas of Social Sciences and Documentation was disseminated primarily through two studies; the first dealt with the social network in Social Sciences and History, providing a study of the social behavior of men and women on fertility and genetic changes, applied also to relatives, friends and neighbors in the form of informal conversations in order to discover all the behavioral possibilities of the people studied (Watkins, 1995); the second study dealt with the importance of the use of information that public libraries generate; these are useful contents for elderly Afro–American women with low financial income. In that paper, these women receive information from their doctors and then carry out inquiries at public libraries to resolve all remaining doubts (Gollop, 1997).
In terms of the area of Social Sciences and Documentation an application viable through structured actions and micro and macro pairs is described, exploiting fundamentally the quantitative generation of data. However, it may be that it is only a sociological view that concerns itself with the area in question, though really exists the possibility of exploiting the qualitative relationship, especially if there exists a controlled analysis in the peripheries of the networks (Molina, 2004).
The Social Network is a way of representing affective or professional relationships of human beings among themselves or among groups with mutual interests.
Despite the fact that the notion of social networks is not adequately known, these are present in our daily life from the day we are born. The interpersonal relationship both in our friendships and in our professional activities is based on models of networks, always used in actions in which there does not exist domination by any of the parts, that is, the network relationship is equal for all participants. For example, if we say that two expert professors take part in many dissertation panels and in some cases mutually, we can state that there exists a social network between both. However, it is not particularly important to know which of the two professors has the greatest presence in dissertation defense groups, but the participation of both together is important.
In contrast, for the generation of scientific indicators, there is always certain domination on the part of the researchers in the construction of statistical quantifications, primarily influenced by the fact that the data are handled at all stages, often "distorting" the aim of this type of research due to manual or semi–manual techniques.
In the next sections we discuss about the Journal of Documentation and its importance to analyze social networks in library science. Later, we define a method to study this networks. Finally, we discuss some conclusions extracted from our analysis.
The Journal of Documentation
The main journals about Librarianship, documentation and Information science are the Journal of the American Society for Information Science and Technology, the Canadian Journal of Information and Library Science, and the Bulletin of the American Society for Information Science. Traditionally, one of them, the journal of documentation, had a very important role in the development of the discipline, in this study we are going to focus in this review to analyze the social networks in the area. JDoc, published since 1945, is at present one of the most important journals in the area of Librarianship, Documentation and Information Science. Its distribution until 2001 was the exclusive responsibility of the Association for Information Management (Aslib), but since 2002 its format was taken over by Emerald.
The indexing of the JDoc is found in the world's main data bases, such as the Social Science Citation Index (the package of the Institute for Scientific Information, ISI), Francis (the social area database of the Institut de l'Information Scientifique et Technique, INIST) and the Library and Information Science Abstract (LISA).
At present, around 25 articles in 6 annual issues are published, while until 1994 four or five issues were published yearly, so the number of articles published per year was also lower than today's total.
Due to the great importance of this journal we highlight three studies that illustrate its visibility and scientific breadth throughout the years.
While not forgetting the contribution of Aslib to the development of studies on special libraries and information systems, to celebrate its 50th anniversary, the journal published a special edition in which a retrospective view of the scientific contributions therein was made. Here, the manner in which the academic and theoretical bases progressed during the war years, through work carried out at the British Society for International Bibliography (BSIB), is shown. The BSIB joined Aslib at the time the journal was born. Bryan Vickery was among the movers of this initiative. The author describes how he started out with this task, which begun after two historical events: the Conferences of the Royal Society, and classification into a range of topics in seven areas. Authors such as Peter Lewis, Alan Gilchrist, Stephen Robertson, Jean Tague–Sutcliffe, Tom Wilson and Maurice Line evaluated the scientific contributions made to the journal throughout its history. As he regards the areas of "quantitative methods in documentation", Jean Tague–Sutcliffe believes that, concerning studies on citation, the articles in JDoc have a very considerable value for the authors. Maurice Line discovered an information gap regarding the topic of "Libraries and their Management" (Vickery, 1994).
Another study in the JDoc celebrated its 60th anniversary (Nebelong–Bonnevie; Frandsen, 2006). Since the journal is regarded as having a high impact as well as great visibility in the scientific community, this study of a bibliometric nature was published. Its aim was to propose a group of scientific evaluation indicators through the use of methods and theories derived from the studies of Ellen Nebelong–Bonnevie and Tove Faber Frandsen. The indicators on which the study was based were of two types: indicators obtained from the analysis of the references in the journal articles, and indicators derived from the study of co–citation in the journal. Before this contribution, some authors such as Cronin and McKenzie, 1992; Cronin and Shaw, 1999 and 2001; and White, 2001, carried out innovative analyses in this field and dealt with some key concepts on the identity, as well as the image, of the citation. These were the bases on which this second study, with its analysis on the journal itself, driven by its 60th anniversary, was founded.
Due to the great standing and repercussion of the JDoc, a comparative study of the geographical distribution of foreign authors in the journal was described in 2002, with the Journal of the American Society for Information Science and Technology, JASIST (HE; Spink, 2002). This consisted of bibliographical data on foreign authors and their geographical positions over a publication period of 50 years (1950–1999), analyzed in 5–year periods, establishing their evolution. The distribution of foreign authors by their geographical position was analyzed for the overall tendencies in both journals, the British and Canadian authors being identified as having the greatest presence in JASIST and, for the JDoc, the authors with more presence were North Americans and Canadians. The representativeness of the authors in JASIST was consolidated with Egghe (14 signed papers), Meadows (9), Wil–lett (9), Rousseau (8), Tague (8), Robertson (7), Carroll (7), Wong (7), Yao (7) and Van Raan (6); within JDoc we were able to highlight Cronin (with 11 contributions), Ingwersen (5), Kochon (4), Rousseau (4), Salton (4), Diodato (3), Egghe (3), Lancaster (3), MacKenzie (3) and Neil (3).
For all that the Journal of Documentation represents, it becomes necessary to analyze its representation and visibility in two aspects: the first one on its co–authorship from the Scientography (maps) and second for its citation index (tables), even because this visualization of citation networks of magazines uses statistical techniques and is excellent to complement the analysis of citations and co–citations for the identification of the environment of the scientific journals (Bornmann; Leydesdorff; Marx, 2007).
Initial concept to analyze JDoc: through the social networks
A social network represents the interactions between participants who connect horizontally, directly or through those around them. The group resulting from this relationship is a fabric of multiple threads that may spread out indefinitely on all sides, without anyone being considered principal or central, or representative of the rest. There is no "commander". What there lies is a collective will to carry out and achieve aims (Whitaker, 1998).
For decades, the concept of the social network and the analyses of these relationships have been developing as one of the most promising routes for measuring the social structure of scientific cooperation. Its basis, however, was first used in the middle of the 1930s (Moreno, 1934) in the consolidation of Sociometry, by introducing the mathematical theory of graphs, with a complementary adaptation to the Theory of Structural Equilibrium (Cartwright; Harary, 1956).
In parallel, a study of the analysis of equilibrium in relationships initiating in a cognitive experience was carried out, determining two possible types of cooperation: sympathetic or positive, when the relationships are obvious within a scientific universe; and the relationship by disapproval or negativity, that in general is made up of causalities, indeed an aid that possesses no centrality (Heider, 1946).
From these initial frameworks, the origins of Social Networks Theory were designed (Scott, 1991), developed a priori by the University of Manchester in the 1950s (Gluckman, 1954), where the major exponents of Social Networks Theory at that time were to be found (Barnes, 1954).
In terms of its anthropological bases, we can observe studies focusing on the clinical aspect of Medicine and its environment (network of patients and control guidelines), both with a focus on the standardization of treatment techniques in a group of people, and starting from cognitive presuppositions, focusing on the control of treatments in scales of networks of patients (Litwin, 1997).
Another habitually applied aspect is the structuring and application of networks in business activity, primarily for the control of groups and their production, in procedures and business clusters (Grannovetter, 1985).
These visions (anthropological) are derived from initial studies on invisible colleges and social capital which always operated through the prism of the relationship between individuals or institutions.
Faced with this assumption, it is essential to observe that social networks are not only evolutionary. We are dealing with a discipline that aggregates the principles of the invisible colleges and social capital, generating new knowledge with the aim of resolving oppositions (up to this time, difficult to overcome), in the area of Social Sciences, by working with structured actions and micro and macro pairs, basically exploring the quantitative generation of data.
In Spain, the possibility of generating a social network for studies of a metric nature was described using the structuration of co–authorship to form the relationships of scientific cooperation at the individual, group and network of authors levels (Molina; Muñoz; Domenech, 2002).
To strengthen this quantitative aspect of networks, it is essential to aggregate Metric Studies to be able to base other aspects within the relationships, such as graphs, densities, centralities, intermediations, proximities and vectors.
This reinforces the view that social networks are a foundation for Statistics, as they are a sum of cooperation between two or more points, or simply because they constitute a representation of scientific frequency designed in a map by similarity (of authors, topics or scientific institutions). For this reason, an exploration of the scientific publications in Bibliometry and Scientometrics, from the point of view of co–authorship and co–citations, was carried out.
Social networks determine different behaviours (insofar as facets of anthropology are concerned) and have different movements that establish their present model.
From the conception of the social networks we will explain the visualization of the information that is the logical relation between the theoretical studies and the applications in the metric scope.
The visualization of the information with objective of networks
The traditional forms to represent the quantitative information have been developed as the social and scientific phenomena, in which we are immersed, and here are explained.
Since the middle of the past century, alternatives have been searched to evidence and to spread out the relations between these collective (Bush, 1945; Garfield, Sher, Torpie, 1964) which, given its characteristics, are complex to represent. In this context appears a form to represent them graphically, by informatics, treating to explain those known phenomena as Maps of Sciences (Price; Beaver, 1966), Scientograms or Scientographs (Garfield, 2001).
These aspects are represented inside of the visualization of information for social networks and defined as techniques that are connected with the existence of softwares (Freeman, 2000). Through the years a lot of applications with this intention have been developed as Ucinet, Pajek, Netdraw, Citespace, among others programs to analyze sociograms (Brandes et al,. 1999).
These representations are tools to visualize all the micro and macro relations of the same reality, allowing to observe multidimensional phenomena from different perspectives (Tufte, 1994), with techniques and models of graph theory connected with the Scientograms, which we can define according to the following steps (Börner; Chen; Boyack, 2003):
(1) The attainment of the data (as a way of example, Web of Science, Medline and SciELO)
(2) Definition of the unit or study object, which can be through:
(a) the authors (White; McCain, 2002);
(b) the heading of the publications (McKechnie at al, 2005);
(c) the terms and keywords (Liu; Maes, 2005);
(d) institutions and countries of affiliation of the authors (Reid; Chen, 2007), and;
(e) Thematic scopes (Moya Anegón et al., 2006).
(3) Selection of the measures of the analysis
(4) Calculations of similarity between the units, through the scaled, the vector and the correlation of the data
(5) The re–ordination of each unit of analysis to firm new coordinate in the other space of analysis, with the object to construct representations through Analysis of Cluster and Multidimensional
(6) Graphical visualization for the analysis and interpretation.
There is a great variety of methods for the automatic construction of the Sciencegrams. Of all them, the most used is the "Spring embedders" (Kobourov; Vampler, 2004) and its main objective is that the resultant graph is more clear and comprehensible to the researcher. The great majority of the informatic programs apply this principle for the construction of the Scienciograms, making the spatial distribution of the elements the representation of the graphs, using Kamada–Kawai's algorithm (1989).
This type of representation generates ample and complex graphs, for what becomes necessary to use algorithms that reduce and simplify them.
The application of this is called pruning, being more employed the Pathfinder Networks, Pfnet (Schvaneveldt, 1990). These prunings are applied by the similarity, proximity, correlation and distances, depending on the type of information that is desired to represent.
OBJECTIVES
Our study focused on the analysis of the scientific production of the journal selected, through two aspects: (i) from the point of view of the social network and the relations of proximity of the embedded agents and (ii) by determining the frequencies of the points related in the analysis. Within this view, we fixed our specific objectives, and:
• we discovered the centralities and the frequencies in co–citations;
• we analyzed the documents cited with the greatest relevance in accordance with the point of view of information consumption on the part of the authors who published in the journal studied;
• we established the journals most co–cited and cited by the authors; and the most productive authors in the journal.
METHODOLOGY
Faced with these associations we resolved to carry out a social network applicable to the maps of relationships' environment, determining the scientific universe of the Journal of Documentation, and collecting all the documents in existence during the period from 1998 to 2005. The products of the Institute for Scientific Information, ISI (Science Citation Index, Social Science Citation Index and Arts and Humanities) were used.
The manageable part of the data was incorporated into a structural program of social networks analysis (CiteSpace) and for the non–associative part of the data a refinement was carried out so it could be used in the practical complementation of the networks, through Microsoft Windows' (Access and Excel) working programs.
As a result of this paper, we were able to retrieve a total of 681 published works in the ISI products, which are divided as follows: 288 book reviews; 172 articles; 14 editorial materials; 12 article reviews; 9 reprints; and 2 bibliographic items.
For the creation of the maps it was necessary to retrieve all the information from the entries, from the fields of authors (AU) and less important fields such as the authors' email correspondence (IN). This process was used because the CiteSpace system does not generate the maps in an individual manner, and it is necessary to have all the fields in their proper space, as a pattern required by the software, independently of whether this field is used in the analysis.
As regards the incorporation of frequency data, as a complementary part of our analysis, we ran a fields filter through Microsoft Windows Word and subsequently transferred it to a .TXT extension which allowed us to import it into Microsoft Windows Access and subsequently to Microsoft Windows Excel, to be able thus to generate the tables and the possible manual calculations of frequency.
RESULTS
We decided to separate the results in two ways: to begin, we worked with the productions within the journal studied, and subsequently we attempted an analysis of information consumption.
For the part on the agents that produced within the Journal of Documentation, we set up an observation of the authors who published the most in this medium, also with the concern of finding out the most represented institutions.
With our sample, we are able to point out that the only intense relationship is characterized by pairs. Within the authors that produced in the journal, we pointed out that Oppenheim and Halliday maintained a strong scientific relationship (figure 1), Oppenheim standing out since he also maintained a strong frequency.


For the frequency, we determined a ranking with the 10 most productive authors to be able to observe the topics of these authors and their respective institutions and make a complete analysis.
As regards the most productive institutions in the journals we found City University London, with 42 publications, followed by the University of Loughborough (28 contributions); the Royal School Library & Information Science (with 27 publications); Robert Gordon University (25 signed papers); Loughborough University of Technology (with 23 publications); the University of Sheffield (20 papers); Indiana University (13 publications in the Journal); Queen's University Belfast (11 contributions); Napier University (10 contributions); and Manchester Metropolitan University (with 9 publications).
In the analysis of the most productive institutions and of the authors with the greatest representativeness, we found that they relate to each other in frequency, with some differences, but in general it is the same institutions which are emphasized in both studies.
The most used topics were Information Retrieval and Information Systems which in reality could be merged into a single topic, but we followed the description of the contributions indexed in the bibliographies of the Journal of Documentation.
In order to understand the information consumption results we recommend that certain concepts be taken into account, such as frequency and centrality, which are applied in the CiteSpace program that we used to achieve our results (Chen, 2006).
(1) Frequency: This is an index that represents the number of times that the values of a particular author or a group of authors are repeated. This type of analysis can also be shown with the total value of appearances of institutions, topics, documents and journals cited, always based on the mathematical definition of the topic. Another factor that represents frequency is the density of relations which allows the incorporation of this aspect to centrality (Nieminen, 1974);
(2) Centrality: In the social network centrality has the function of representing the node of a graphic–theoretical property that quantifies the importance of the position of the personalities in the analysis. A centrality generally uses the metric extension of centrality betweenness (intermediation) to execute the percentage measurement of the number of trajectories related to the least distance (for the most intense relations) and to the greatest distance (for sporadic relations and those of little intensity). Yet in centrality there also exists the closeness index (centrality closeness) which shows the route of the nodes (Freeman, 1978).

Starting with these first explanations we ascertained which were the authors who had the greatest representation in scientific production in the topics exploited, determined in the form of a relationship and in the form of frequency (explained numerically).
Another analysis focused on information consumption by the authors who produced in the journal studied, and here we discovered which were the most cited authors, the most used documents and the most consulted journals.
In this universe of information consumption, we can state that the papers published by the scientific community in the Journal of Documentation are a direct result of the references consulted and, in this universe, it is important to choose reliable information sources, as can be observed in the following three Maps.
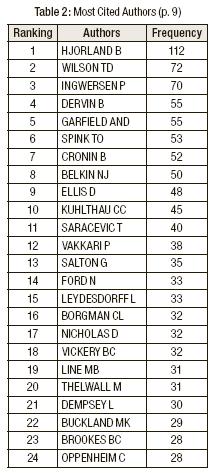
The first Table (table 2) of this sequence deals with the authors who had the greatest number of quotes and are represented in a frequency map (figure 2); the circles represent centralities.
In terms of centrality, we can point out that the authors with the greatest "prestige" were not always the most important in the journals or thematic areas. They were, however, cited as the icons of the thematic areas.
In the case of the authors shown on the Map (Ingwersen, Lynch, Lancaster, Fidel, Kuhlthau, Harman and Lawrence), we point out that their publications are of great prominence within the scientific community and their collaborations are to be found among the most relevant names in the area.
The relations vertex in the network was 216, adding a density of 0.0485142 and its factor of graph–represented centrality is 0.15290, its closeness was 0.30660 and the center intermediation of cooperation, 0.03332.
As regards the analysis of frequency, this shows that, within the tangled universe of the works published in the Journal of Documentation, some authors obtained the greatest prominence. From among them, the ranking with the 24 most cited is clear.
The most cited authors, without a shadow of a doubt, are the people that made the Journal of Documentation a constant in the universe of the analysis of scientific production, with the theories published in its volumes and their practical applications. However, in our analysis, it is fundamental to point out the agents of connection between the great authors and the more modest ones.
In the light of this type of analysis it is fundamental to observe that authors such as Ingwersen, Oppenheim, Hjorland, Wilson, Garfield, Spink, Cronin, Belkin and Line —agents with the greatest theoretical collaboration— also fulfilled a representative function for some authors of little prominence in the topics in question.
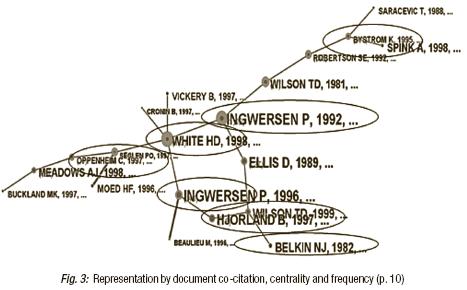
In the question of centrality it is important to mention the role of Ingwersen and White, whose documents make the connection between two groups. These documents also received a respectable quantity of frequency.
The second analysis, on this Map, shows the total centrality of Bystrom in one of the knots.
The analysis relating to Ingwersen's document in this study is considered the most important for two reasons: (i) it deals with a document not much cited (with 15 frequencies), however, when it is, it is related to the theoretical documents of the topics studied; (ii) it is a recent document, and perhaps the most important one from 1992, the date of its publication, by constituting a relevant foundation for the theories of Information Science.
Another identification of centrality was observed in the documents that maintain a strong citation, such as Wilson, Seglen and Hjorland, who are part of a very representative universe of scientific cooperation, as can be observed in the circles shown on the Map.
The degree of density was 0.0453726 for 111 vertices of relationships. In relation to the centrality graphs we affirmed that it was 0.17598, complemented by a moderate intermediation index (0.02814) and a null presence of the closeness index between the relationships.
Unlike with the analysis of centrality, where the concern was not to establish the most cited documents, the consideration made for frequency has this scientific fact, where we point out the 13 documents most used in the journal.
As regards quantity, Table 3 is self–explanatory, the document by Dervin (1999) is the most prominent, followed by the work of Ingwersen, Wilson, Hjorland, Belkin, Kuhlthau, Ellis, Ziw, Garfield, Lesk and White among others; however, it is fundamental to mention the constant production of Ingwersen and Hjorlande in the Journal (where they both appear with 2 documents among the most cited).

The present analysis was set out to study between 1988 and 2005, and the most used documents are from this same period, particularly Dervin and Wilson (1999), Ingwersen and Ziw (1996), Ingwersen (1992), and Hjorland (1997 and 1998). It is very important to mention that these documents are the structures of those which ground many of the studies in Information Retrieval and Information Systems, that practically ground the Journal of Documentation and, for this reason, we can state that existing theories are the result of these authors and are based on the documents identified in this study.
On completing this section, we observed the citation indices of the most consulted journals.
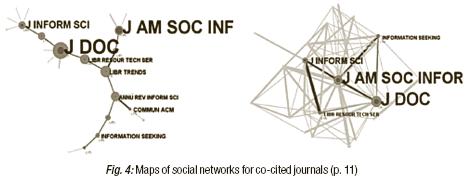
The analysis of the co–cited journals was done with an approach to all the journals at the start of the study (1998), with a high citation of the following: Journal of Documentation, Journal of the American Society for Information Science and the Journal of Information Science.
In relation to centrality, the Journal of Documentation is the focus of the intersection of the four existing clusters, being the central node. However, the journal with the greatest representation is Library Trends, the center of the relations, with a strong influence on the others.
The vertex is at 197 relations with a density of 0.0668704. Its centrality in graphs was 0.26490, closeness applications (0.45907), intermediation (0.02896) with a relatively positive index.
As regards frequency, it was found that the Journal of Documentation, Journal of the American Society for Information Science, and the Journal of Information Science are those which have prominence in the relationships. However, we have some journals like Information Seeking and Library Resource Tech that with a slightly more modest frequency stand out among the rest, by maintaining a good relationship with the Journal of the American Society for Information Science and the Journal of Science.
CONCLUSIONS
Throughout the analytical process of the social network in the Journal of Documentation some difficulties were experienced when concluding the results, due to the lack of pattern in the matrix data (the bibliographic references of the ISI databases) used to generate the maps.
To study this irregularity, the formats of each entry (681 entries) were observed with the aim of ascertaining if they presented the principal fields and thus allow us to generate a complete new reference.
Another problematic question was the duplication of documents, with some difference in the referential data. As a corrective measure, we opted to alter the data manually to make it reliable. The two most representative examples of this duplication were:
 DERVIN B, 1999, INFORM PROCESS MANAG, V35, P727 or DERVIN B, 1999, PROCESS INFORM MANAG, V35.
INGWERSEN P, 1996, J DOC, V52, P3 or INGWERSEN P, 1996, J DOC, V52.
A challenge that would be pertinent in the present analysis would be to evaluate the terms most used by the authors, as a way of checking if the papers were centered on a specific study or if there existed a series of different topics. However, within the objectives established at the outset we can conclude that all the points were checked and that a good symmetry was found between the centralities and frequencies of the co–citations, observing cooperation among key–personalities.
As regards information consumption, we can state that the analysis of the documents cited corresponds to the theoretical and practical formation of the area of Information Science with documents from 1979 (Garfield) up to the most contemporary ones, such as Dervin and Wilson (1999).
For the analysis of the most representative authors, we concluded that in centrality the most significant authors were Ingwersen, Lynch, Lancaster, Fidel, Kuhlthau, Harman and Lawrence, whereas in terms of frequency the representation came from Dervin, Ingwersen, Hjorland, Wilson, Garfield, Spink, Cronin, Belkin and Line among the most cited.
In terms of the journals which had great centrality, the Journal of Documentation, the Journal of the American Society for Information Science and the Journal of Information Science were the most prominent.
As regards frequency, we showed that the Journal of Documentation, Journal of the American Society for Information Science, and the Journal of Information Science are those which stand out in the relations. Nevertheless, we had some journals such as Information Seeking and Library Resource Tech which, with little frequency, stand out from the rest by maintaining a good relationship with the Journal of the American Society for Information Science and the Journal of Science.
REFERENCES
Barnes, J. "Class and committees in a Norwegian Island parish." Human Relations, v.7, n.1, p. 39–58, 1954. [ Links ]
Börner, K.; Chen, C.; Boyack, K. "Visualizing knowledge domains." Annual Review of Information Science & Technology, v.37, p. 179–255, 2003. [ Links ]
Bornmann, L.; Leydesdorff, L.; Marx, W. "Citation environment of Angewandte Chemie." Swiss Chemical Society, v.61, n.3, p. 104–109, 2007. [ Links ]
Brandes, U. et al. "Explorations into the visualization of policy networks." Journal of Theoretical Politics, v.11, n.1, p. 75–106, 1999. [ Links ]
Bush, V. Science—the endless frontier: A report to the President on a Program for Postwar Scientific Research. Washington: United States Government Printing Office, 1945. [ Links ]
Cartwright, D.; Harary, F. "Structural Balance: A Generalization of Heider's Theory." Psychological Review, v.63, n.5, p. 277–293, 1956. [ Links ]
Chen, C. "CiteSpace II: Detecting and Visualizing Emerging Trends and Transient Patterns in Scientific Literature." Journal of the American Society for Information Science and Technology, v.57, n.3, p. 359–377, 2006. [ Links ]
Freeman, L.C. "Centrality in Social Networks: Conceptual Clarification." Social Networks, v.1, n.1, p. 215–239, 1978. [ Links ]
Freeman, L.C. "Visualizing Social Networks." Journal of Social Structure, JOSS, v.1, n.1, 2000. [ Links ]
Garfield, E. Scientography: Mapping the Tracks of Science. Institute for Scientific Information, 2001. [ Links ]
Garfield, E.; Sher, I.H.; Torpie, RJ. The Use of Citation Data in Writing the History of Science. Report of research for the Air Force Office of Scientific Research under contract AF49 (638)4256, Philadelphia: The Institute for Scientific Information, 1964. [ Links ]
Gluckman, M.H. Rituals of Rebellion in South–East Africa. Manchester: Manchester University, 1954. [ Links ]
Gollop, C J. "Health Information Seeking Behaviour and Older African American Women." Bulletin of the Medical Library Association, v.85, n.2, p. 141–146, 1997. [ Links ]
Grannovetter, M.S. "Economic Action and Social Structure: The Problem of Embeddedness." American Journal of Sociology, v.91, n.3, p. 481–510, 1985. [ Links ]
He, S.; Spink, A. "A Comparison of Foreign Authorship Distribution in JASIST and the Journal of Documentation." Journal of the American Society for Information Science and Technology, v. 53, n. 11, p. 953–959, 2002. [ Links ]
Heider, F. "Attitudes and Cognitive Organization." Journal of Psychology, v.21, n.2, p. 107–112, 1946. [ Links ]
Kamada, T.; Kawai, S. "An algorithm for drawing general undirected graphs." Information Processing Letters. v.31, n.1, p. 7–15, 1989. [ Links ]
Kobourov, S.G.; Wampler, K. "Non–Euclidean Spring Embedders." Information Visualization, INFOVIS 2004. IEEE Symposium, 10–12 Oct. 2004, p. 207–214. [ Links ]
Litwin, H. "Support Network Type and Health Service Utilization." Research On Aging, v. 19, n. 3, p. 274–299, 1997. [ Links ]
Liu, H.; Maes, P. "InterestMap: Harvesting Social Network Profiles for Recommendations." IUI 2005, Workshop: Beyond Personalization, San Diego, 2005. [ Links ]
McKechnie, L. et al. "How human information behaviour researchers use each other's work: a basic citation analysis study." Information Research—An International Electronic Journal, v.10, n.2, p. 220–232, 2005. [ Links ]
Molina, J.L. "La ciencia de las redes." Apuntes de Ciencia y Tecnología, n.11, p. 36–42, 2004. [ Links ]
Molina, J.L.; Muñoz, J.M.; Domenech, M. "Redes de publicaciones científicas: un análisis de la estructura de coautorías." Redes—Revista Hispánica para el análisis de Redes Sociales, n.1, 2002. [ Links ]
Moreno, J.L. Who Shall Survive? New York: Beacon, 1934. [ Links ]
Moya–Anegón, F. et al. "Visualizing and analyzing the Spanish science structure: ISI Web of science 1990–2005." El Profesional de la Información, v.15, n.4, p.258–269, 2006. [ Links ]
Nebelong–Bonnevie, E.; Frandsen, T.F. "Journal Citation Identity and Journal Citation Image: a Portrait of the Journal of Documentation." Journal of Documentation, v.62, n.1, p. 30–57, 2006. [ Links ]
Nieminen, J. "On Centrality in a Graph." Scandinavian Journal of Psychology, v.15, n.4, p. 332–336, 1974. [ Links ]
Price, D.J.S.; Beaver, D.B. "Collaboration in an Invisible College." American Psychologist, v.21, n.11, p. 1011–1018, 1966. [ Links ]
Reid, E.F.; Chen, H. "Mapping the contemporary terrorism research domain." International Journal of Human–Computer Studies, v.65, n.1, p.42–65, 2007. [ Links ]
Schvaneveldt, R.W. Pathfinder associative networks: studies in knowledge organization, Norwood, NJ: Ablex, 1990. [ Links ]
Scott, J. Social Network Analysis. London: Sage, 1991. [ Links ]
Tufte, E.R. Envisioning information. Cheshire, Connecticut: Graphic Press, 1994. [ Links ]
Vickey, B. Fifty Years of Information Progress: a Journal of Documentation Review. London: Aslib, 1994. [ Links ]
Watkins, S.C. "Social Networks and Social Science History." Social Science History, v.19, n.3, p. 295–311, 1995. [ Links ]
Whitaker, F. Redes: uma estrutura alternativa de organização. Rio de Janeiro: Rits, 1998. [ Links ]
White, H.D.; McCain, K.W. "In memory of Belver C. Griffith." Journal of the American Society for Information Science. v.51, n.10, p. 959–962, 2002. [ Links ]

