


 nueva página del texto (beta)
 Inglés (pdf)
 Artículo en XML
 Referencias del artículo
 Enviar artículo por email
 Citado por SciELO
  Similares en
SciELO
Similares en
SciELO 
 Permalink
1. Introduction
The analysis of how technological advancement affects different labor markets has been present in the economics literature for several decades. Mexican researchers have been immersed in this trend, and many scholars have discussed how the changes in wages, employment or returns to education have been affected by the corporate investment in machines and automated processes that both destroy some jobs and create many others.1 It has been argued that the most recent technological change differs from the one generated by the surge of computers, in the sense that it not only increases the demand for highly educated workers, but it also boosts both the employment and wages of workers in the lower part of the skills and wage distributions. This phenomenon has been called labor polarization" and is characterized by an increase in the relative employment and wages of workers who are at the extremes of wage and skill distributions and who perform non-routine, cognitive and manual tasks. It is also characterized by a reduction in the employment rates and the wages of workers who are in the middle of wage and skill distributions and who perform routine tasks.
Hence, the main source of the polarization observed in the labor market of both developed and developing countries appears to be task-biased technological change (TBTC), which is clearly distinguished from the technological change that took place before the 1990s and was considered skilled biased. It has then been said that the automation of production processes has led directly to an increase in the relative demand for workers performing non-routine tasks, which are at the opposite ends of wage and skill distributions (Acemoglu and Autor, 2011).
In addition to automation, other factors are also considered to be behind the phenomenon. The fact that routine tasks can be carried out in other countries through offshoring processes or by means of digital platforms has meant that the employment of workers specialized in routine tasks has been significantly reduced, at least since the late 1990s, in the United States. Blinder (2006) argues that any work that can be done without being face-to-face is likely to be completed in another country, where wages are lower. These are precisely routine jobs, some in the service sector (e.g. call centers).
In developing countries, where low wages allow the postponement of the adoption of cutting-edge technologies, and where workers are able to perform remote tasks requested by companies in developed countries, it is not clear whether the process of labor polarization observed in developed countries and linked to technology is also taking place. In Mexico, specifically, it is possible that, unlike in the United States and Europe, middle-skilled workers are precisely those who are experiencing an increase in their relative demand, which would lead to diametrically opposed changes in the labor market with respect to what is observed in these other countries.
Therefore, the objective of this paper is, first, to describe what is happening in the Mexican labor market with regard to the relative demand and supply of workers defined by their occupation, when occupations are classified into non-routine and routine and, within these, into cognitive and manual, based on a thorough analysis of tasks. Second, this paper tries to understand how wages and formality are related to TBTC in Mexico.
The central hypothesis is that, in the Mexico’s labor market, TBTC may have been postponed due to low wages. Furthermore, trade may be favoring an increase in the demand for workers that perform tasks of a routine nature. Moreover, the large and persistent distortions in the Mexican economy that have been reported by Levy (2018) and Levy and López-Calva (2016), and that allocate resources towards less productive firms, may be causing changes in the labor market that do not resemble the current scenario of the developed economies. The analysis differentiates the male and female labor markets.
The work is organized as follows: the second section includes a review of the literature dealing with the effects of technological change and other forces in labor markets in general, and in Mexico in particular. The third segment describes the data used in this work and justifies why the National Survey of Household Income and Expenditure (Encuesta Nacional de Ingresos y Gastos de los Hogares, ENIGH) is considered the best data set to analyze the effect of TBTC in the Mexican labor market. The fourth part includes a descriptive analysis of changes in relative employment and relative wages by occupation category, and describes some of the characteristics of the Mexican labor market. The fifth section analyzes wage inequality at an aggregate level, and returns to education aggregated and by occupation category. The sixth section includes two econometric exercises to understand how wages and formal employment have changed through time within the occupation categories that take into account the type of tasks that workers perform. Finally, the seventh section contains concluding remarks.
2. Literature review
Since the beginning of the 1980s and in the early years of this century, labor economists have argued heatedly over whether trade or technology was the most relevant factor behind the increase in employment levels for the most skilled workers and the increase in the higher education premium in the industrial sector of developed countries. According to Acemoglu and Autor (2011), the phenomenon that triggered the emergence of this literature was the increase in the relative wage of workers with higher education (in regard to workers with other educational levels) observed in the United States since the early 1980s. This increase in wages has been matched over time with an increase of the relative supply of these workers. Therefore, it suggests a significant growth in their relative demand. To explain this phenomenon, analysts resorted to Tinbergen’s studies (1974, 1975) describing how relative demand for highly skilled workers is related to technological advancement, and, in particular, to skilled biased technological change. This approach theorizes that the qualification premium (that is, the increase in the relative wage of the most skilled workers) is determined by technological advancement.
Tinbergen’s ideas (1974, 1975) were organized through a model that Acemoglu and Autor (2011) called the Canonical Model", which includes two different types of workers: the highly skilled and the unskilled. The success of this model in explaining the changes in the U.S. labor market generated a series of similar analyses in other countries from the 1990s and continuing well into the new millennium. Contributions such as Fitzenbergen and Kohn (2006), and Atkinson (2008), among others, showed that the Canonical Model also explained the labor changes observed in other countries. In the case of Mexico, studies such as Cragg and Epelbaum (1994), Airola and Juhn (2005), Meza (1999, 2005), and Esquivel and Rodríguez-López (2003), among others, also showed that the education premium increased at least until 1994; and the most plausible explanation for this phenomenon was the technological change biased by qualification.2
Despite the success of the Canonical Model upon explaining the labor changes observed in several countries, in recent years transformations began to be observed in the U.S. labor market that the Canonical Model could no longer explain. The most relevant change was the increase in employment and wages of workers on the far left of the wage distribution; that is, of those with low wage levels. Another phenomenon that began to be observed was the downturn in employment ratios of medium-skilled workers and the decrease in their relative wages. The simultaneous increase in the relative employment and worker’s wages at the extremes of the distribution and the deterioration in the working conditions in the middle of the distribution was called Labor Polarization". Another series of studies were conducted to understand what was behind these new changes.
In response, the validity of the Canonical Model was called into question. First, a disadvantage of this model was that it did not incorporate the tasks" concept -the Canonical Model assumes that workers with a certain type of qualification perform only one type of task, which is not realistic. In reality, technological advances have allowed robots and digital platforms to perform tasks that were previously carried out by workers, which means that the technological change can be biased by tasks, rather than by qualification. Second, the fact that this model considered technological change as exogenous and speculated that, by nature, it is skilled-biased, was also called into question. What actually happens is that the technological advance has been different among countries and industries, suggesting that it is endogenous and it has shown to be biased by tasks, as the automation has suggested. Authors such as Autor et al. (2003), Autor et al. (2006) and Goos and Manning (2007) analyzed the relationship between polarization and the occupational structure of the economy, especially the task content of different occupations. Studies like Goos et al. (2009) and Goos et al. (2014) analyzed polarization in Europe and found evidence that the labor markets were being affected by routine-biased technological change. It can be argued that Acemoglu (1999) was the first author to theorize that the less skilled workers in the middle of wage distributions were moving toward non-routine manual jobs, while the more-skilled workers in the middle of distributions were moving toward non-routine cognitive jobs.
However, researchers have not always agreed that technological change is the main force behind the changes in the labor market in more-developed countries whose economies respond to market forces. In the 1990s, authors began to question the role of technological change in labor markets and claimed that international trade was the real reason behind changes in labor markets. Research that supports the hypothesis that trade, rather than technology, was modifying wages and employment in countries such as the United States and the United Kingdom include Borjas (1995), Borjas and Ramey (1994), and Burtless (1995). When increases in the higher education premium began to be observed in developing countries such as Mexico, Brazil and China, and when levels of manufacturing production were maintained or increased in advanced countries, even though skilled employment declined, scholars began to talk about technology as the most relevant factor behind the world’s new labor dynamics.
However, the magnitude of the phenomenon of labor polarization in advanced countries has raised questions about whether trade is not also changing as a result of technological change. Analysts such as Blinder (2009), Grossman and Rossi-Hansberg (2008), and Baldwin and Robert-Nicoud (2013), among others, affirm that the nature of international trade is changing strongly, since instead of focusing on the exchange of final goods, trade integration is increasingly marked by the exchange of intermediate goods and services, known as Fragmentation", Offshoring", or Task-trade". These scholars argue that the relocation of tasks to developing countries, such as China, India and Mexico, is not restricted to the production of tradable goods, but also may involve services due to technological advances; for example, the interpretation of medical laboratory results. This latter suggests that the effects of trade and technological progress cannot be separated as easily as was thought in the 1990s.
The effect of technological change on labor markets in Mexico has been investigated in several studies.3 Other research on the factors behind labor market changes also consider factors such as trade or labor institutions. Medina and Posso (2010), for example, conducted an analysis of occupational polarization in Latin America, and more specifically in Colombia, Brazil and Mexico. These authors find that in the case of Colombia and Mexico there were signs of labor polarization similar to that of developed countries, but they found no evidence of labor polarization in Brazil. It is important to point out that these authors find polarization in Mexico until 2010, and that they do not separate the male and the female labor markets, as this work does.
In a previous work, in which the labor markets of various countries -including several in Latin America- are analyzed, Acemoglu (2003) develops a theoretical model to discuss how the returns to skills differ over time between countries, as well as to inquire about the impact of international trade on wage inequality. This author argues that skill returns are determined by technology, the relative supply of skilled labor and trade. The work of Acemoglu (2003) reveals that international trade induces skilled biased technological change and increases inequality between workers in the United States and in less developed countries such as Mexico. It also argues that the increase in inequality is closely related to the increase in the relative prices of products that require more skilled labor. Clearly, this paper does not address the drop in wage inequality observed in Mexico after 1994.
There are other papers that specifically analyze the Mexican labor market, its relationship with technology, and the results observed in terms of inequality. The work of Andalón and López Calva (2002) deserves a special mention, since it analyzes the evolution of income inequality and the polarization between the southern region and the rest of Mexico. This work uses aggregate data from ENIGH and the microdata of the National Urban Employment Survey (Encuesta Nacional de Empleo Urbano, ENEU) from 1989 to 2000 to estimate Gini coefficients and Theil indexes. The results indicate that income inequality decreased in Mexico during the 1990s, being even lower in the southern region. This finding corresponds to others that discuss the reduction in inequality in Mexico since the signing of the North American Free Trade Agreement (NAFTA). However, the fact that inequality decreased more dramatically in the South, a region less connected to the world economy through trade, suggests that other forces caused the drop in inequality in Mexico after NAFTA.
Among the works analyzing the downturn of inequality in Mexico, a study conducted by Campos-Vázquez (2013) also stands out. This paper investigates the forces behind the fall of inequality in the post- NAFTA period. To analyze inequality, he uses the methodology of Machado and Mata (2005),4 and applies the decomposition developed by Bound and Johnson (1992) for the period 1996-2006. The results show a decrease in wage inequality, caused by a downturn in returns to education, which is at the same time caused by a higher relative supply of workers with university education.
Another work that addresses the issue of wage inequality is that of Levy and Lopez Calva (2016), who use data from different sources to analyze the impact of misallocation of resources on labor income and the returns to education in Mexico. The authors argue that an increase in the supply of workers with higher educational levels, as well as a poor allocation of human resources in less productive companies, has generated imbalances between supply and demand for skilled workers in Mexico. They develop a decomposition analysis of workers’ earnings taking into account the observable and unobservable characteristics of the company where the workers are employed and of the workers themselves, and use this analysis to simulate a counterfactual income distribution in which there is no misallocation of human capital. In this hypothetical context, income differentials between several levels of schooling are higher, as are returns to education, since workers are located in more productive enterprises and according to their level of qualification. This work shows then that the drop in wage inequality and the downturn in the returns to education are positively correlated with a bad allocation of the productive resources of the country.
In a work more focused on the role that technology plays in the country’s labor outcomes, Iacovone and Pereira (2018) analyze the effects of the adoption of Information and Communication Technologies ( ICT) on the demand for skilled and unskilled workers for the period 2008 -2013. This work uses data from the Mexican Economic Census (EC) at the company level in manufacturing, services and commerce; and the employment database of the Mexican Institute of Social Security (Instituto Mexicano del Seguro Social, IMSS). Their paper indicates that, on average, only 28% of workers in the manufacturing sector use computers and 26% use an internet connection, while the equivalent figures for services are 34% and 33%, and in the commerce sector, 45% and 42%, respectively. The results show that, for the commerce sector, a growing use of ICT is associated with a greater wage gap between skilled and unskilled workers. However, authors find that for the manufacturing and services sectors, the use of ICT corresponds to a decrease in the wage gap between skilled and unskilled workers.
In summary, the reviewed papers find that wage inequality decreased in Mexico after the 1994 crisis, due either to an increase in the supply of skilled workers or to a misallocation of resources toward less productive firms. This has caused a drop in the returns to education. It has also been shown that Mexico’s labor market became increasingly polarized, similar to what has happened in developed countries, at least until 2010. At the regional level, inequality decreased in the southern region, compared to the rest of the country, suggesting that forces other than trade are behind the decrease in wage inequality. And finally, when analyzing the effect of technological change within companies by sector, research shows that manufacturing is the sector with the lowest use of technology, and that when it is used, it increases productivity. However, it should also be noted that, in this sector, along in the service sector, use of ICT decreases the gap between skilled and unskilled workers.
3. Data
Previous analyses of the effect of technology on the Mexican labor market have not classified workers by the tasks they perform, so this paper attempts to fill this gap in the literature. Skills have always been related to educational levels, but it has been argued that the most recent technological advancements are biased by task and not by skill. Therefore, in order to analyze the effect of technology in the Mexican labor market, or more specifically, in order to see whether the Mexican labor market is polarizing in the same way labor markets in more developed nations are, this section of the article presents the data used.
The information used in this work is taken from ENIGH, from 2000 to 2014. The selection of years in certain estimations was made to describe the effect of technological change on the labor markets before and after the crisis in 2008.5 Workers from the agricultural and/or the rural sector were dropped from the samples.
For this analysis we could have used either data from the National Survey of Occupation and Employment (Encuesta Nacional de Ocupación y Empleo, ENOE) or from the Censuses of 2000 and 2010 and the Intercensal Survey of 2015. However, the ENOE suffers from a large non-response problem regarding income that could have biased our results. Also, the Intercensal Survey did not inquire about hours worked, and this would have forced us to analyze monthly earnings that can be affected by the worker’s effort. Using only Census data would give us only two points in time. Therefore, we decided to use ENIGH. We acknowledge that the best survey to analyze employment in Mexico is ENOE, but we decided to keep the same source of data, i.e. the ENIGH, for the employment and for the income estimations. It is worth mentioning that similar estimations were performed with ENOE data, and that general results held.6
The ENIGH is a household survey conducted every two years by the National Institute of Statistics and Geography (Instituto Nacional de Estadística y Geografía, INEGI) and is representative of the population at a national level. Each year’s samples were restricted to workers between 18 and 64 years old and with a high labor commitment -that is, those who worked more than 25 hours per week prior to the survey. We do not restrict the sample to wage earners, so instead of wages we analyze labor income. However, both terms are used indistinctively.
The ENIGH, as other survey systems in the world that inquire about family income, has a problem that has been analyzed in the past and that is the under-reporting of income (see Rodríguez and Lopez, 2015). To address this situation, the labor income of the earners in the families were imputed in cases where interviewees refused to provide this information. The imputation followed was the hot deck procedure, which is characterized by assigning a known or estimated value to those observations of missing data, conditioned to a vector of socio-demographic characteristics. The imputation process was as follows. First, a pool of observations was created based on those who were employed, considering their position in employment -subordinate and remunerated workers, employers and self-employed workers- for the four quarters of the year in question. Each was then assigned a random number between 0 and 1. From the pool, two sets of data -donor data (those who reported an amount of earned income) and recipient data (those who either did not report income or declared a range of income)- were created. Recipients who declared less than one minimum wage were imputed the minimum wage multiplied by the random number already assigned. For those who declared a minimum wage, this is the wage that was assigned. For each individual contained in the recipient dataset who had not yet been imputed an income level, a donor was sought in the corresponding dataset. This search may have yielded more than one donor, so the one with the highest random number (which was assigned to it when forming the pool) was selected. The tie variables for the search for possible donors were the following: sex, occupational status, sector of economic activity (agriculture, manufacturing, commerce, services and others), stratum, type of economic unit (firms and institutions private and public), and position in the occupation. Given that it was almost impossible for all recipients to find a donor including all the tie variables (although more than 95% did find one), it was necessary to repeat the process three more times, eliminating variables each time: first sector, then sector and stratum, and finally sector, stratum, and a type of economic unit other than Subsistence agriculture".
Expansion factors were used in all estimates. Nominal wages were deflated by the National Consumer Price Index so they are expressed at constant prices of 2010.
In order to classify all occupations defined at a 4-digit level, we used the following categories: non-routine cognitive, routine cognitive, routine manual and non-routine manual.7 The main tasks of each one of the occupations in each unit group were considered. In order to make the classification, the reference that was taken is the one identified in the article of Acemoglu and Autor (2011), where groups have been built based on the following criteria (see table 1).
Table 1 Occupational groups
| Groups | Definition | Example |
| 1.- Non-routine cognitive | Performing non-routine cognitive tasks requires management skills, analytical reasoning and quantitative skills such as arithmetic and advanced mathematics, with which computers complement human work without replacing it. Includes tasks that require problem-solving, skills, intuition, creativity and persuasion. | Occupations that involve leadership, control and planning of activities with a high level of management and interpersonal skills (e.g. medical diagnosis, selling, legal deed). Professional, technical and managerial occupations. |
| 2.- Routine cognitive | These occupations require limits, tolerances or standards to be established, as an indicator, given that they follow precise and well-understood procedures. | Operating a billing machine to transcribe data from office records (bookkeeping, filling and retrieving textual data, processing interactions and procedural transactions (e.g. bank teller). Clerical and technical occupations. |
| 3.- Routine manual | Easy to manipulate and organize in a systematized way. | Selecting and classifying engineering objects on an assembly line, reconfiguring production lines to allow shorter runs (e.g. artisan workers). |
| 4.- Non-routine manual | These tasks are not very susceptible to computerization, which means that they could not be easily replaced by a machine. They require situational and visual capabilities and abilities like languages recognition, adaptability and in-person interactions. Poses daunting challenges to automation. | Services that do not require special education or training (e.g. cleaning services, truck drivers, cooks, caregivers). |
Source: Own elaboration.
4. Descriptive statistics
There are many factors that can alter the performance of a labor market, especially in developing countries or in countries where the markets are not free. These are usually classified in three categories: labor institutions, trade and technology. Among the factors that can affect both employment and labor income we have the minimum wage, the changes in unionization shares, labor laws or social policies aimed to increase labor force participation and employability. In 2012, the Mexican government implemented reforms that made the labor market more flexible. This reform eased the hiring and firing of workers and allowed women and youngsters working less than 40 hours a week to participate in formal markets. A fourth factor, which has been considered in previous literature, is a misallocation of resources that favors certain kind of firms. In this list we could also consider the capital destruction processes that economic crises bring about.8
In Mexico, the real minimum wage was increasing until 2008, when it started to decrease. In addition, the share of unionized employees has fallen steadily (see Campos-Vazquez, 2013). Another force behind the changes in the labor market is related to international trade. In Mexico, since 1994, both the value and the volume of exports and imports have increased (see Campos-Vazquez, 2013). According to data from the Mexican Secretary of Economy, between 2000 and 2015 the value of total exports in Mexico increased 129%, while the value of total imports increased 128%.9 Finally, technological change can also alter the functioning of labor markets. This can be generated in the country or can be imported from other nations. In Mexico, the degree of innovation in products and processes is quite low. In the 2019 Bloomberg Innovation Index, Mexico is ranked 59 th , out of 60 countries, only above Vietnam and below South Africa and Argentina.10 This suggests that technological innovation comes mainly either from imports or from foreign direct investment.11 In sum, many forces can be behind the changes we observe in the Mexican labor market. The classification of occupations based on the tasks workers perform can ease our understanding of the effects of technological change on wages and employment.
4.1 Changes in relative employment and wages
We now proceed to describe how relative employment and relative earnings have changed by occupation and sex, between periods 2000-2008, 2008-2014 and 2000-2014.12 Table 2 shows the percentages of full-time employment, classified by occupational group and by sex.
Table 2 Percentages of full-time employment, by sex and type of occupation
| Type of occupation | 2000 | 2008 | 2014 | Change 00-08 | Change 08-14 | Change 00-14 |
| Males | ||||||
| Non-routine | 26.70 | 23.37 | 23.98 | -3.33 | 0.61 | -2.72 |
| cognitive | ||||||
| Routine | 7.16 | 7.79 | 9.88 | 0.63 | 2.09 | 2.72 |
| cognitive | ||||||
| Routine | 16.59 | 15.56 | 15.97 | -1.03 | 0.41 | -0.62 |
| manual | ||||||
| Non-routine | 49.55 | 53.29 | 50.18 | 3.74 | -3.11 | 0.63 |
| manual | ||||||
| Females | ||||||
| Non-routine | 23.47 | 23.59 | 23.24 | 0.12 | -0.35 | -0.23 |
| cognitive | ||||||
| Routine | 18.37 | 13.88 | 17.00 | -4.49 | 3.12 | -1.37 |
| cognitive | ||||||
| Females | ||||||
| Routine | 15.98 | 14.01 | 12.92 | -1.97 | -1.09 | -3.06 |
| manual | ||||||
| Non-routine | 42.18 | 48.52 | 46.84 | 6.34 | -1.68 | 4.66 |
| manual |
Source: ENIGH 2000, 2008, 2014.
Table 2 shows that a polarization in employment was taking place in the Mexican female labor market before the 2008 crisis, as Medina and Posso (2010) argue. However, in the case of men, the relative employment of workers performing non-routine cognitive tasks was decreasing. After the crisis, employment of cognitive nature increased in the case of men, while the employment of male workers performing tasks of non-routine manual nature decreased. For the whole 2000-2014 period, we observe an increase in the employment of male workers performing routinary cognitive tasks, and a drop in the employment of male and female workers performing non-routine cognitive tasks. This means that we do not observe, for the whole period of analysis, polarization of employment; not even in the case of women.
We now proceed to analyze relative earnings or payroll shares. Table 3 shows the payroll ratios directed to the different types of workers defined by their occupation and sex.
Table 3 Percentages of payroll, by sex and type of occupation
| Type of occupation | 2000 | 2008 | 2014 | Change 00-08 | Change 08-14 | Change 00-14 |
| Males | ||||||
| Non-routine | 44.18 | 41.67 | 39.43 | -2.51 | -2.24 | -4.75 |
| cognitive | ||||||
| Males | ||||||
| Routine | 7.46 | 8.63 | 11.74 | 1.17 | 3.11 | 4.28 |
| cognitive | ||||||
| Routine | 10.76 | 10.77 | 10.78 | 0.01 | 0.01 | 0.02 |
| manual | ||||||
| Non-routine | 37.59 | 38.92 | 38.04 | 1.33 | -0.88 | 0.45 |
| manual | - | |||||
| Females | ||||||
| Non-routine | 43.18 | 43.20 | 45.01 | 0.02 | 1.81 | 1.83 |
| cognitive | ||||||
| Routine | 18.33 | 14.96 | 17.51 | -3.37 | 2.55 | -0.82 |
| cognitive | ||||||
| Routine | 9.44 | 8.31 | 6.90 | -1.13 | -1.41 | -2.54 |
| manual | ||||||
| Non-routine | 29.03 | 33.51 | 30.56 | 4.48 | -2.95 | 1.53 |
| manual |
Source: ENIGH 2000, 2008, 2014.
We can observe that, before the 2008 economic crisis, the female labor market was also polarizing in terms of relative earnings. We can then conclude that the female labor market was indeed polarizing both in terms of employment and of wages before the 2008 economic crisis. This polarization of wages prevails in the female labor market for the whole period of analysis. However, since employment does not show the same pattern, we cannot conclude that, in the 2000-2014 period, the female labor market in Mexico was experiencing polarization. It is important to point out, however, that this polarization in terms of earnings in the female labor market is consistent with what Rodriguez and Meza (2021) find.
Combining results regarding changes in relative employment and relative earnings we can delineate what has happened with the relative demand and the relative supply of workers defined by the type of tasks they perform. These results are summarized in table 4.
Table 4 Implied overall changes in relative demand and relative supply, 2000-2014
| Task classification | Employment share changes | Payroll share changes | Implied overall changes in relative demand or relative supply |
|
Men
Non-routine |
Negative | Negative | Absolute decrease in relative demand |
| cognitive | |||
| Routine cognitive |
Positive | Positive | Absolute decrease in relative demand |
|
Men
Routine manual |
Negative | Positive | Absolute decrease in relative supply |
| Non-routine manual |
Positive | Positive | Absolute increase in relative demand |
|
Women
Non-routine |
Negative | Positive | Absolute decrease in relative supply |
| Cognitive | |||
| Routine cognitive |
Negative | Negative | Absolute decrease in relative demand |
| Routine manual |
Negative | Negative | Absolute decrease in relative demand |
| Non-routine manual |
Positive | Positive | Absolute increase in relative demand |
Source: Own elaboration.
Table 4 indicates that the relative demand for workers performing non-routine manual tasks increased both in the case of males and in the case of females. However, as this is not accompanied by an increase in the relative demand for workers performing non-routine cognitive tasks, we could argue that this looks more like a precarization of the labor market than a result of the advancement of technology. It could be the case that resources have been directed toward less productive firms, leading to an increase in the demand for workers performing non-routine manual tasks. In the case of women, table 4 shows that the relative demand for workers performing routine tasks decreased in the period of analysis, which might be the result of the advancement of technology. This is not the case in the male labor market. In fact, since the relative supply of male workers performing routinary manual tasks seems to be decreasing, it could be the case that they are moving to non-routinary manual jobs, where demand is rising. It could be speculated that women are segregated in occupations more susceptible to routinization, while men are employed in higher proportions in sectors where the advancement of technology has been postponed due to the low cost of labor. In the following section we present evidence to better understand what is behind our results.
4.2 Evidence regarding the Mexican labor market
Table 4 above indicates that the relative demand for workers performing non-routine manual tasks increased in the 2000-2014 period. These workers are more easily inserted in the informal sector, where the investment in capital is minimum and where less-skilled workers can find better work opportunities. It is not clear, however, if male routine cognitive workers are getting inserted in the formal or in the informal sector. If their employment in the informal sector is growing, along with the employment of non-routine manual workers, this would suggest that, among other factors, the misallocation of resources and the preferable fiscal treatment received by less-productive firms in the informal sector are behind the dynamics we observe in table 4.
Table 5 shows how employment and earnings have changed in the informal Mexican sector. An informal worker here is one that does not have access to public medical services or to social security through his/her job. First, it is important to point out that the relative demand for non-routine manual workers has increased strongly in this sector. Second, table 5 shows that the relative demand for non-routine cognitive workers has decreased in this sector. Third, table 5 shows that also the relative demand for routine cognitive workers has increased in this sector. This suggests that the resources directed towards this sector benefit non-cognitive manual and routine cognitive workers.
Table 5 Shares of employment and payroll, by type of occupation, in the informal sector
| Type of occupation | 2000 | 2008 | 2014 | Change 00-08 | Change 08-14 | Change 00-14 |
| Percentages of employment, by type of occupation | ||||||
| Males and females | ||||||
| Non-routine | 17.36 | 13.02 | 14.40 | -4.34 | 1.38 | -2.96 |
| cognitive | ||||||
| Routine | 4.38 | 5.16 | 6.70 | 0.78 | 1.54 | 2.32 |
| cognitive | ||||||
| Routine | 14.45 | 15.36 | 14.15 | 0.91 | -1.21 | -0.30 |
| manual | ||||||
| Non-routine | 63.81 | 66.46 | 64.75 | 2.65 | -1.71 | 0.94 |
| Manual | ||||||
| Type of occupation | 2000 | 2008 | 2014 | Change 00-08 | Change 08-14 | Change 00-14 |
| Percentages of payroll, by type of occupation | ||||||
| Males and females | ||||||
| Non-routine | 35.65 | 26.27 | 25.05 | -9.38 | -1.22 | -10.60 |
| cognitive | ||||||
| Routine cognitive | 4.29 | 5.89 | 8.53 | 1.60 | 2.64 | 4.24 |
| Routine manual | 9.38 | 11.86 | 10.35 | 2.48 | -1.51 | 0.97 |
| Non-routine manual | 50.67 | 55.97 | 56.04 | 5.30 | 0.07 | 5.37 |
Source: ENIGH 2000, 2008, 2014.
Table 4 also showed that the relative demand for female workers performing routinary tasks decreased in the 2000-2014 period. Table 6 shows the proportion of employment by occupation category and by sex for the year 2014.13 It is noteworthy that women are employed in higher proportions (relative to men) as auxiliary workers in administrative activities. They are also overrepresented as merchants, salesclerks, and sales agents. These are easily automatable activities and this segregation could be behind the drop in the demand for female workers performing routinary tasks. This also suggests that the female labor market has been more affected by the task biased technological advancement than the male labor market. In the case of men, table 6 shows that they are overrepresented as artisan workers and as industrial machinery operators, assemblers, and transport drivers. These activities can be automated or can be performed by humans, and the evidence is that firms behind these activities have not invested in cutting-edge technology.
Table 6 Occupational seggregation by sex, 2014 (percentages)
| Occupation | Males | Females |
| Officers, directors and heads of office | 5.65 | 4.46 |
| Professionals and technicians | 17.85 | 18.34 |
| Auxiliary workers in administrative activities | 4.69 | 12.46 |
| Merchants, sales clerks and sales agents | 12.40 | 21.49 |
| Workers in personal services and surveillance | 7.85 | 10.36 |
| Artisan workers | 14.37 | 5.36 |
| Industrial machinery operators, assemblers and transport drivers | 17.29 | 6.79 |
| Workers in elementary and support activities | 19.90 | 20.74 |
| TOTAL | 100.00 | 100.00 |
Source: ENIGH 2014 and own estimations.
Regarding industries, table 7 shows the proportions of employment by sex and economic sector in the year 2014.14
Table 7 Sectoral seggregation by sex, 2014 (percentages)
| Occupation | Males | Females |
| Mining | 1.10 | 0.14 |
| Manufacturing industry | 21.23 | 16.98 |
| Electricity and water | 0.65 | 0.29 |
| Construction | 14.85 | 0.96 |
| Commerce | 18.98 | 25.50 |
| Transportation and communications | 9.48 | 2.28 |
| Professional, financial, administrative and real estate services | 2.08 | 2.27 |
| Community and social services | 31.63 | 51.58 |
| TOTAL | 100.00 | 100.00 |
Source: ENIGH 2014 and own estimations.
Data in table 7 reveals again that women are overrepresented in commerce and in community and social services, while men are employed in higher proportions in the manufacturing industry, in construction and in transportation and communications. The results so far indicate that technology has not advanced as expected in these last sectors, given that the relative demand for male workers performing routinary cognitive tasks has increased. Moreover, from table 5 we can infer that these sectors are becoming more informal.
The next section deepens the analysis of earnings and tries to shed light on what has happened in the Mexican labor market regarding the advancement of task biased technology.
5. Labor income analysis
This section of the paper analyzes wages, or more precisely, labor incomes, in detail. In this case, the analysis is performed with absolute and not relative values. Labor incomes are expressed by hour and in logarithms.15 The first part estimates wage differentials through time and wage inequality measures at an aggregate level, and the second part describes what has happened with the returns to education by occupation category.
5.1 Income differences and wage inequality
Based on data taken from ENIGH in 2014, we can observe that the highest labor incomes in Mexico are earned in the non-routine cognitive occupations, followed by the routine cognitive occupations. Cognitive work involves decision-making and complex mental processes that the labor market rewards over other kind of work. On the other hand, workers performing non-routine manual tasks earn higher wages when compared to those performing routine manual tasks, as table 8 shows. This means that if task-biased technology is advancing in the country, we would not observe polarization of wages but a drop in the lower part in the wage distributions.
Table 8 Distribution of log hourly wages by occupation, 2014
| Occupation category | P10 | P25 | P50 | P75 | P90 | Mean |
| Males
Non-routinary cognitive |
11.27 | 11.85 | 12.35 | 12.90 | 13.46 | 12.33 |
| Routinary cognitive |
11.23 | 11.68 | 12.14 | 12.59 | 13.01 | 12.11 |
| Routinary | 10.46 | 11.22 | 11.67 | 12.06 | 12.45 | 11.56 |
| manual | ||||||
| Non-routinary | 10.52 | 11.27 | 11.79 | 12.19 | 12.61 | 11.66 |
| manual | ||||||
| Females | ||||||
| Non-routinary | 11.01 | 11.65 | 12.13 | 12.58 | 13.10 | 12.06 |
| cognitive | ||||||
| Routinary | 10.78 | 11.36 | 11.77 | 12.13 | 12.55 | 11.68 |
| cognitive | ||||||
| Routinary manual |
9.29 | 10.43 | 11.30 | 11.64 | 11.90 | 10.91 |
| Females | ||||||
| Non-routinary | 9.56 | 10.54 | 11.24 | 11.72 | 12.13 | 11.02 |
| manual |
Source: Own calculations based on ENIGH 2014.
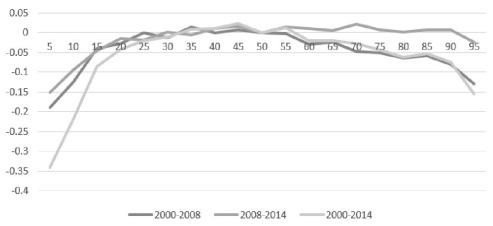
To analyze whether income in the Mexican labor market is polarizing or not, figures 1 and 2 show the differences in log hourly wages, relative to the median, by percentile, in three different periods: 2000-2008; 2008-2014 and 2000-2014. Figure 1 includes only men and figure 2 only women.
Source: Own elaboration based on ENIGH 2000, 2008, 2014.
Figure 1 Differences in log hourly wages relative to the median, by percentile, men, 2000-2008, 2008-2014 and 2000-2014
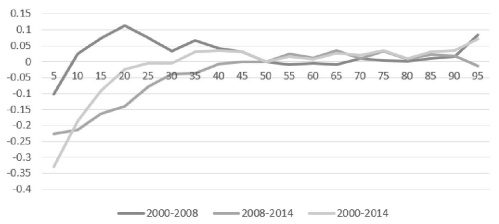
Source: Own elaboration based on ENIGH 2000, 2008, 2014.
Figure 2 Differences in the log hourly wages relative to the median, women, 2000-2008, 2008-2014 and 2000-2014
In the case of men (figure 1), and for the 2000-2014 period, real hourly wages drop in the top part of the distribution (where non-routine cognitive work is performed) and also in the bottom part (where routine manual work is performed). Clearly, wages increase in the middle part of the distribution, where routine cognitive and non-routine manual work is performed. This is consistent with what we found in section 3 of this paper. Moreover, the results so far emphasize the importance of the informal sector in the Mexican labor market. Note that for the 2008-2014 period, wages at the bottom part of the distribution fall, while wages in the rest of the distribution remain constant. It is very likely that the effects of the crisis were still affecting the Mexican labor market in this period. Finally, in the 2000-2008 period, we see something similar to what happens for the whole period of analysis. In the case of women, (figure 2), and for the whole 2000-2014 period, there is evidence of polarization, considering that wages in the lower part of the distribution correspond to workers performing routinary manual tasks. Above the 4th decile, wages increase a little along the whole distribution, but increase slightly more in the extreme parts. Notice how in the post-crisis period, wages remain unchanged in the upper part of the distribution, but fall in the lower part, suggesting that the crisis hit less-skilled workers harder.
Figures 1 and 2 show very different patterns worth mentioning. While wages for male routine cognitive and non-routine manual workers increased, something similar to a polarization process takes place in the case of women, especially in the pre-crisis period and above the 20th percentile. The different changes in wage distributions imply different behaviors of the inequality measures. Table 9 shows the 90-10, 90-50 and 50-10 wage differentials, both for male and female workers. In the case of male workers, the downturn in the 90-50 log hourly wage differential for the period 2000-2014 is the result of the increase in the labor income of workers in the middle part of the distribution and of the downturn in the labor income of workers in the higher part of the wage distribution. The increase in the 90-10 log hourly wage differential for the whole period of analysis shows that wages at the highest part of the distribution dropped less than the wages at the lowest part of the distribution. The increase in the 50-10 wage differential is the logical result of the increase of the labor income of workers in the middle part of the distribution and the downturn of labor income for the workers in the lower part of the wage distribution.
Table 9 Log hourly wage inequality measures
| Inequality measures | 2000 | 2008 | 2014 | Change 00-08 | Change 08-14 | Change 00-14 |
| Men | ||||||
| D90-10 | 2.0816 | 2.1257 | 2.2265 | 0.0441 | 0.1008 | 0.1449 |
| D90-50 | 1.1087 | 1.0272 | 1.0332 - | 0.0815 | 0.006 - | 0.0755 |
| D50-10 | 0.9729 | 1.0985 | 1.1933 | 0.1256 | 0.0948 | 0.2204 |
| Women | ||||||
| D90-10 | 2.4343 | 2.4238 | 2.6561 - | 0.0105 | 0.2323 | 0.2218 |
| D90-50 | 0.979 | 0.9942 | 1.0135 | 0.0152 | 0.0193 | 0.0345 |
| D50-10 | 1.4553 | 1.4296 | 1.6426 - | 0.0257 | 0.213 | 0.1873 |
Source: Own calculations based on ENIGH 2000, 2008, 2014.
In the case of female workers, the increase in all inequality measures included in table 9, for the whole period of analysis, implies that wages in the 90th percentile of the wage distribution increased more than the wages in the median and in the first decile of the distribution. It also implies that wages in the median increased more than wages in the first decile, where wages actually dropped. Note that before the crisis, wages in the highest and the middle parts of the distribution increased less than the wages at the lowest part of the distribution. This is consistent with the findings of Campos-Vazquez (2013) in terms of decreases in inequality measures. According to our results, inequality has been increasing again after the crisis, especially in the case of female workers. However, the increase is too small to be represented in a graph including the inequality measures through time. This again suggests that technology is advancing more in the female labor market than in the case of men.
In the next section we analyze the returns to education, given the important role they have played in inequality in the past. We analyze what has happened to the education premium at the aggregate level and within each one of the categories of occupation.
5.2 Education premiums
We define the education premium as the contribution of an additional year of formal schooling to the log hourly wage of a worker. It is calculated as the coefficient of the education variable in a wage or Mincerian equation as follows:
Where ln hwij represents the log hourly wage (labor income) of person i in occupation j. α o is a constant; Xi is a vector of socio-demographic characteristics of person i in occupation j; Si is the accumulated years of education of person i, and Zij is a vector of industry fixed effects. Finally, εij is an error term. Clearly, α1 represents the education premium. This equation is calculated for each one of the years of analysis, for the whole sample (divided by gender) and for each one of the occupation categories.
Figure 3 shows how the education premium for the whole sample decreased marginally from 2000 thru 2014. The downturn takes place before the crisis and, afterwards, we observe a slight recovery.
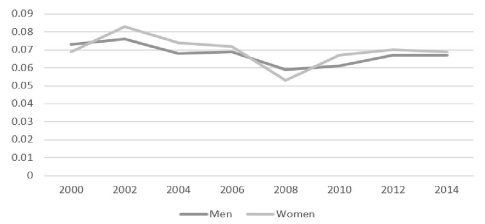
The downturn in the education premium before the crisis is more significant in the case of women, but the recovery is also more sizable. The downturn for both male and female workers is consistent with the findings of Campos-Vazquez (2013). Since we have shown that polarization was taking place in the female labor market before the crisis, it can be argued that women displaced from the routinary occupations were moving mainly towards manual jobs, where the education premium is smaller when compared to jobs of a cognitive nature. In the case of male workers, the increase in the education premium after the crisis can be explained by the move towards jobs of routine cognitive nature. In both cases, the precarization of the labor market before the economic downturn is more than evident.
The fact that the education premium at the aggregate level falls before the crisis seems to be related to a poor or null advancement in technology. In the case of male workers, this is clear, as shown in this article. In both cases, the evidence suggests a precarization of the labor market that is related to factors other than technology. If we assume that trade is also positively correlated with technology,16 we can argue that labor institutions or the misallocation of resources are the main reasons behind the changes in the Mexican labor market as shown in this article. After the crisis, the recovery in the education premium is mainly explained by what happens in the routine cognitive occupations, in the case of men, and by what happens to highly educated workers, in the case of women.
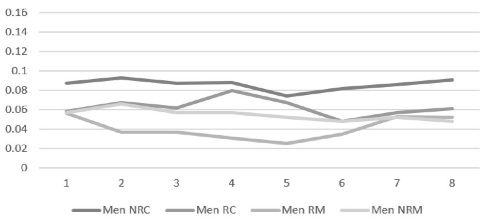
When we analyze the education premium within each one of the occupation categories, we observe that it decreases before the economic crisis and increases afterwards, except in the category where employment grew the most: the non-routinary manual jobs. In this case, the education premium drops steadily. Figure 4 shows what happens to the education premiums by occupation category in the case of men, while figure 5 shows what happens to the education premiums by occupation category in the case of women. Note that the market rewards the education of women in the routinary manual occupations more than that of men, and that the education premium grows more in the case of women than of men, whenever they are increasing (in the post-crisis period).
Source: Own estimation based on ENIGH, several years.
Figure 4 Returns to education by occupation, 2000-2014, men
6. Econometric exercises
So far, the descriptive analysis indicates that the Mexican female labor market was polarizing before the 2008 crisis, and that female jobs of routinary nature were experiencing a drop in demand after the crisis. This suggests that female workers are more susceptible to be replaced by robots and by digital applications. In the case of men, we have observed an increase in the relative demand for workers performing both routinary cognitive and non-routinary manual tasks. These are precisely the kind of tasks that have experienced an increase in demand in the Mexican informal sector. In this section, wage equations and probit models for formality are estimated using an integrated data base; i.e., using the 8 ENIGH data bases integrated into a single one, and incorporating the years as independent variables. The objective is to understand what has happened with labor income and with the quality of employment by occupation in the first 14 years of the 21st Century. This technique allows us to control for the changes in either observable or unobservable characteristics of the workers. It is important to point out that the data base does not follow the same workers through time, so not all unobservable characteristics are controlled for, but only those that describe cohorts.
6.1 Wage equations
To capture the changes in wages through time, once we control for the observable characteristics of workers and for the unobservable characteristics of cohorts, we estimated 8 Mincerian equations, one for each occupation category and for both sexes, as follows:
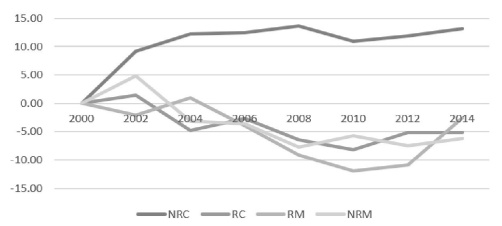
Where ln hwij represents the log hourly wage (labor income) of person i in occupation j. α o is a constant; Xi is a vector of socio-demographic characteristics of person i in occupation j; Πt is a dummy variable that indicates the data base from which each observation comes (fixed effects by year). Zij is a dummy variable for the sector where person i of occupation j is working at time t. Finally, εij is an error term. The coefficient θ is included in figures 6 and 7 to show how wages have changed through time for each occupation and sex.17 Figure 6 indicates that real wages were increasing for men in all occupations before the crisis, but for the workers performing non-routine manual tasks this increase was the lowest. The occupation where wages increase the most is the non-routine cognitive, followed by the routine cognitive. This increase ceases in 2006, when all wages start to decrease. This means that there is no evidence of polarization of real wages in the case of men before the 2008 crisis. After the crisis real wages fall for all the occupations, but the drop is more noticeable in the case of non-routinary manual workers. In 2010 wages grow again, but the highest increase is observed in the case of routinary cognitive workers. This means that we don’t observe polarization, either before the crisis or after the crisis, in the males’ labor market.
Source: Own estimation based on ENIGH, several years.
Figure 6 Annual wage regression coefficients, 2000-2014, men
Source: Own estimation based on ENIGH, several years.
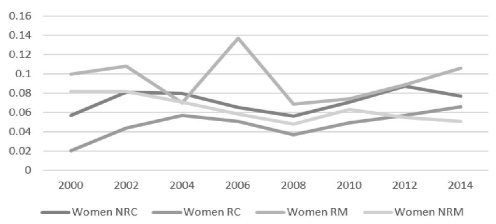
Figure 7 Annual wage regression coefficients, 2000-2014, women
In the case of women and before the 2008 crisis, we observe that wages of non-routinary cognitive and routinary cognitive workers were increasing, while the wages of workers performing manual tasks started to decrease in 2002. After the crisis, all wages drop, but the drop is more noticeable in the case of workers performing manual tasks. However, the figure shows that in 2010, the highest earnings were obtained precisely in the non-routinary occupations, either cognitive or manual. This suggests, again, that in the female’s labor market there has been polarization, at least regarding earnings, even after controlling for observable and unobservable characteristics of workers. What stands out from this analysis is the higher salaries of routine cognitive workers in the case of men, and the higher salaries of non-routine workers in the case of women. These results suggest, again, that task-biased technology has not affected much the males’ labor market, but that it might be affecting the female’s labor market. Rodriguez and Meza (2020) perform a more detailed analysis of the Mexican female labor market regarding task-biased technological change.
Table 1A in the appendix includes the wage equations estimated with the data bases integrated.
6.2 Formality equations
In Mexico the unemployment rate is very low, mainly because the access to unemployment insurance is very limited. Therefore, a more accurate way to analyze if employment is improving is to estimate the probability of entering the formal sector. To capture the changes in the probability of getting inserted in the formal sector through time, once we control for the observable characteristics of workers and for the unobservable characteristics of cohorts, we estimated formality probit equations as follows:
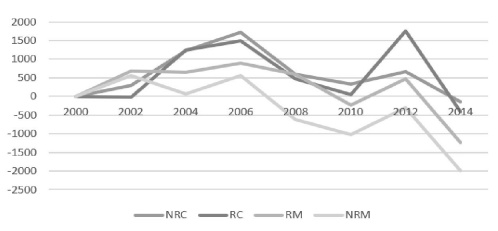
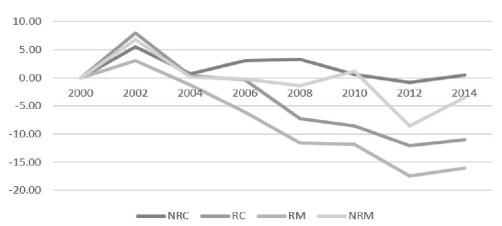
Where prob(yij) represents the probability of getting inserted in the formal sector of person i in occupation j. β o is a constant. Xij is a vector of socio-demographic characteristics of person i in occupation j. Πt is a dummy variable that indicates the data base from which each observation comes (fixed effects by year). Finally, εij is an error term. The coefficient θ is included in figures 8 and 9 to show how the probabilities of getting inserted in the formal sector have changed through time for each occupation and sex.18 Figure 8 indicates that the probability of becoming employed in the formal sector increases over time only for male workers performing non-routinary cognitive tasks, while it decreases for the rest of the occupations. The trend does not change in the period after the crisis, showing that the propensity to become informal started before the 2008 financial debacle. Note that the probability of becoming employed in the formal sector increases for routine cognitive workers after 2010, and for routine manual workers after 2012. This confirms that, for Mexico, something opposite to a polarization process, in terms of quality of employment, was showing in the males’ labor market.
Source: Own estimation based on ENIGH, several years.
Figure 8 Annual formality regression coefficients, 2000-2014, men
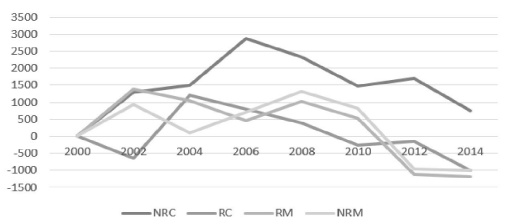
In the case of women, figure 9 shows that the probability of getting employed in the formal labor market drops for all the occupations over the period analyzed, but that the drop is less pronounced in the case of non-routinary cognitive and non-routinary manual workers, once again suggesting polarization, at least in terms of quality of employment. Note that in 2012, the probability of becoming employed in the formal sector grows only for the non-routinary occupations.
Source: Own estimation based on ENIGH, several years.
Figure 9 Annual formality regression coefficients, 2000-2014, women
Given that the female labor market shows an improvement both in earnings and in quality of employment for those workers performing non-routinary tasks, either cognitive or manual, we can conclude that task-biased technology change is affecting the Mexican female labor market. This is not observed in the case of men, where something opposite to a polarization process is showing. The segregation of workers either in terms of occupation or in terms of industries might be behind this consistent result. In the next section we present some concluding remarks.
Table 2A in the annex includes the formality probit equations estimated with the data bases integrated.
7. Concluding remarks
The evidence presented so far suggests that task biased technological change has not been a critical force behind the behavior of employment and earnings in Mexico in the first 14 years of the 21st century. This means that other factors, such as institutions, the 2008 crisis, or a misallocation of resources, are behind the main changes we observe in male and female Mexican labor markets. For example, the downturn in wages at the lower part of the wage distributions might be related to the decrease in the real minimum wage after the 2008 economic downturn. Or the drop in the probability of formalization may be related to the effects of the crisis. Moreover, the fact that the relative demand for workers that perform non-routinary manual tasks increase for both men and women in the analyzed period might be explained by the misallocation of resources that is causing a precarization of the labor markets.
However, in the case of women, both the descriptive and the econometric analysis suggest that polarization is somehow present, either in terms of labor income or regarding the quality and the volume of employment. The descriptive analysis showed a clear polarization process in the pre-crisis period, which is consistent with what Rodriguez and Meza (2020) find. On the other hand, the econometric exercises indicate a polarization of earnings and an increase in formalization in the occupations where non-routinary tasks are performed. Although this does not seem to be a very strong tendency, the results suggest that women are more susceptible to replacement by automated processes and by digital applications.
The analysis of occupational segregation might be considered an explanation of the different dynamics by sex that the labor markets present. Clearly, women are overrepresented in occupations where technology has advanced more, while men are segregated in occupations and industries where investment in cutting edge technologies may have been postponed or even reversed, probably due to the low price of labor and because, for example, of labor reforms that facilitated the adoption of labor-intensive technologies (due to the flexibilization this reform caused).
Regarding wage inequality, we find that there was an increase again after the crisis, especially in the case of female workers, which seems to be related to the displacement of skilled workers towards occupations where earnings are higher. The grow of the education premium after the 2008 crisis, which is more pronounced in the case of women than in the case of men, suggests again that technology might be advancing slowly in the country, especially in the case of women. However, the education premium drops precisely in the occupation where demand is growing (non-routine manual), which could be related to the precarization of the labor market we discussed above. Moreover, the fact that inequality has been practically constant in the case of men, and that the education premium has not increased much, imply again that men are not affected by technology as much as women.
Our results then, on one hand, support the thesis of Santiago Levy (2018) regarding the idea that in the Mexican economy, less productive firms and even those in the informal sector, receive a privileged treatment when compared to highly productive and formal firms. This process, called Destructive Creation" by Levy, seems to be explain some of the decreasing demand for workers performing non-routine cognitive tasks. On the other hand, our results indicate that technology is advancing more rapidly in occupations where women are employed in higher proportions.
We speculate that the combination of the crisis and existing structural economic problems may have promoted the destruction of capital, affecting labor markets and precarizing them, leading to less opportunities for the highly skilled labor force, especially in the case of men. Trade seems also to be promoting the use of medium skill workers and discouraging the investment in new machines, at least in the case of male workers and in routine-cognitive occupations. These effects are taking place along with a growing level of educational attainment of the labor force, explaining the over-education of workers discussed by Levy (2018).

