


 text new page (beta)
 English (pdf)
 Article in xml format
 Article references
 Send this article by e-mail
 Cited by SciELO
  Similars in
SciELO
Similars in
SciELO 
 Permalink
1. Introduction
Higher levels of penetration of mobile phone services allow society to take advantage of the direct network externalities derived from the interconnection of a greater number of subscribers. In other words, a greater number of subscribers interconnected to a network positively affects the well-being of new subscribers, as well as the well-being of those already subscribed to a network. This benefit can be generalized to subscribers of networks that can be connected. In addition, connecting networks of local service providers leads to greater competition for market share among the connected networks, and thus lower prices.
The rise in the welfare of mobile telecommunication users due to greater direct network externalities and competition between local service provider has led national telecommunications regulators to implement policies aimed at reducing mobile termination rates1 (hereinafter, MTR). However, there is no clear reason to believe that low MTR can optimize the number of mobile telecommunication users (hereinafter, MTU) within a country. On one hand, a high MTR works as an incentive to expand investment in a network's infrastructure in order to gain new subscribers. When an MTR is introduced, the additional charge paid by current users can be used to finance the expansion of the network so that the operator can reach customers located in more remote areas. A high MTR may add subscribers by encouraging network expansion but reduce subscribers by making telephone services more expensive. On the contrary, a low interconnection rate increases the number of users by reducing the variable cost, but it could also reduce the incentives to expand network coverage. Therefore, there could be an interconnection rate that maximizes the number of users, by balancing these two forces.
An increase in the MTR may lead to the increase in the number of mobile subscribers due to network expansion and to simultaneously increase their welfare if the direct network externalities are large enough. The extent to which it is possible to finance the expansion of a network while taking advantage of direct network externalities and competition between local operators through the determination of termination charges is a question that still awaits a more detailed analysis (Armstrong and Wright, 2009).
This tradeoff has also been highlighted by other research. For example, Hurkens and Jeon (2009) have pointed out that a reduction in the termination charge may at the same time tend to reduce the penetration of mobile services by reducing competition between operators, and tend to expand it by internalizing the direct network externalities. Similarly, Wright (2003) has suggested that a price limit on MTR may be required to decrease charges. However, it also warns that welfare would probably not be maximized if the price limit were equal to cost. On the other hand, Valletti and Cambini (2005) have suggested that the effect of the termination charges may vary depending on the size of the companies for given investment levels. For example, a large company would reduce its investment as a result of higher termination charges, while smaller companies could benefit from a termination charge that was above cost. Likewise, Hermalin and Katz (2001) have highlighted the tradeoff between the creation of dynamic efficiencies and allocative inefficiencies that result from MTRs. In particular, they argue that the MTRs should be adjusted in favor of the network that has reduced its marginal costs in order to internalize the investment incentives. However, this change would result in subscribers of other networks assuming inefficiently a higher proportion of the marginal costs.
Many of the results of previous research depend on the models or regimes of termination payments adopted by the economies studied. In this paper, we study two payment regimes, the “calling party pays” (CPP) model and the “bill and keep” model.2 In our sample, 32 countries use CPP (Australia, Austria, Belgium, Chile, Czech Republic, Denmark, Estonia, Finland, France, Germany, Greece, Hungary, Iceland, Ireland, Israel, Italy, Japan, Luxembourg, Mexico, the Netherlands, New Zealand, Norway, Poland, Portugal, Slovakia, Slovenia, South Korea, Spain, Sweden, Switzerland, Turkey and the United Kingdom) and only two using the “bill and keep” model (Canada and United States). According to Littlechild (2006), there is a drawback associated with each regime: in the case of “receiving party pays” (RPP) and “bill and keep”, there is no incentive for consumers to use their phones, which results in a lower penetration rate and lower usage. In contrast, under CPP the person making the call tends to reduce the number of calls made. The net effect depends on the prices charged and the price elasticities of the demand.
It is also important to take into account the potential “waterbed effect” that results from the reduction of termination charges through regulation. The “waterbed effect” describes a situation where, to compensate for the loss of revenue from termination, operators increase the prices they charge to subscribers. Under CPP, operators will increase their charges for making calls and, therefore, usage will decrease. Under RPP and “bill and keep” regimes, the amount that each network charges its own customers will depend on competition between operators. According to Genakos and Valletti (2011, 2012), the “waterbed effect” is stronger when competition in the market is greater and the proportion of MTU is high. Their econometric results show that a 10% reduction in MTRs causes a 5% increase in prices. However, they also found a wide margin of variation in the effect on prices, from a minimum of 2% to a maximum of 15%. They also highlight that, given the imperfect market structure, operators do not transfer the full effect on their subscribers.
Countries opt for the CPP or the RPP and “bill and keep” regimes depending on their needs and preferences, and on the conditions under which the growth of the sector occurred. CPP regimes boost market power in termination markets, which in turn justifies regulatory intervention. A proposed alternative to price regulation is the adoption of an RPP or “bill and keep” regime. Under RPP and “bill and keep”, the consumer has the option to compare prices before joining any network. Termination rates would tend to go down, at least in theory. It is important to mention that in spite of the apparent superiority of the RPP and “bill and keep” regimes, to date there have been no initiatives among CPP countries for a change to RPP or “bill and keep”.
The case of Mexico stands out because it switched from RPP to CPP (see Briceño, 1999). It is worth noting that, rather than the expected fall, this switch actually led to an increase in incoming mobile traffic, despite being accompanied by a 250% rise (from US 0.105 to US 0.403 per minute) in the cost of calls to fixed line telephones. Similarly, according to Littlechild (2006), the introduction of the CPP regime in South America, Central America, and the Caribbean had similar effects to those it had in Mexico: an increase in the average number of calls to mobile networks. One variable that might help us understand this counterintuitive phenomenon is the degree of competition in the sector. It is important to note that the penetration rate in OECD countries increased considerably during the studied period, as can be observed in figure 1. The latter shows the average behavior of OECD countries during the period 2000-2017.
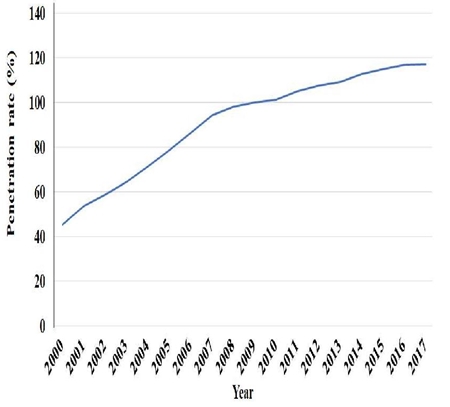
Source: Authors' own graph based on OECD (2019a) data.
Figure 1 Average penetration rate in OECD members
It is in light of this evidence that we test the hypothesis that there is a quadratic and concave relationship between MTR and MTU, and estimate that relationship in the mobile telephone market by using a panel data structure of 34 countries (the 34 member countries of the OECD in January 2016) that spans the period 2000-2018. Should this quadratic relationship hold, it would imply that decreasing MTR increases the penetration of mobile telephony only to a certain extent, while reducing them below a specific threshold would in fact decrease it. We control for the regime and for the prevailing degree of competition in each country.
We also found that the number of internet users, the degree of competence and the population size have a positive effect on the penetration rate, whilst the prevalence of pre-paid cards has a negative effect on it. The evidence concerning the effect of the regime (CPP or RPP) is inconclusive. When we allow the regulation to be exogenous, our results indicate that being under a CPP regime decreases the penetration rate; nonetheless, when we allow the regime to be endogenous, the effect of being under CPP is not statistically significant.
Our results are comparable with those of Dewenter and Kruse (2011) (hereafter DK), whose proposal we modify. The estimates are obtained via instrumental variables. The instruments used are akin to those employed by DK, who measure the quality of democracy and evaluate political stability.
This paper is divided into 4 sections: section 2 presents the estimates of the relationship between the termination rate and the number of users, while section 3 provides evidence concerning the endogeneity assumption of the regime (RPP/ CPP) and the degree of competition in the market. Section 4 concludes.
2. Estimating the MTU-MTR relationship
2.1. Empirical evidence using DK's corrected methodology
The adoption of communication technologies (mobile telephony included) has followed the functional form of a sigmoid process that grows at a diminishing rate. Such a process can be analyzed using a technology diffusion model with a logistic form. These models are based on the functional form proposed by Griliches (1957) to study the diffusion of hybrid corn:
where
As mentioned previously, DK estimate the impact of different regulatory systems on mobile telephone penetration with a panel data set. In order to model MTU, DK use a logistic function to determine the diffusion of mobile phones as a function of regulatory variables and time.
A functional form of the saturation level must be imposed to estimate the model. DK take saturation as a proportion of the population:
where
The latter expression proves misleading and the expression that should be used in this case (i.e., considering that the population growth rate is different than zero) is:
Nonetheless, this expression differs from the result presented in DK. To overcome the limitations of using the expression proposed by DK, we propose a different approach. We define
The equilibrium assumption can be understood as the convergence in growth rates, and eq. (5) is therefore valid. To prove the hypothesis of the quadratic relationship between MTR and MTU, we use the following specification:
which can be estimated by standard linear methods. With the quadratic relationship parameterized, computing the optimal MTR is straightforward:
with the second order condition
As stated earlier, the model is estimated using panel dataset of 34 countries (all OECD members) spanning the period 2000-2018. The data includes MTU, population (World Bank, 2019), and MTR in US dollars, as reported by the OECD (2019a).
We first obtain estimates of λ via equation (5) through a linear regression with no constant. A histogram of these estimates for each OECD country is shown in figure 2. We then compare three different regression estimates of eq. (6): OLS, Fixed Effects and Random Effects (robust Jackknife-estimated covariance matrices are always used). The results are shown in table 1.

Source: Authors' own graph based on OECD (2019a) data.
Figure 2 Histogram of estimated saturation rates for OECD countries
Table 1 Panel data estimation results using the corrected saturation parameter
| Equation 6 | OLS | Fixed effects | Random effects |
constant |
-0.854*** |
-0.77*** |
-0.762*** |
(0.112) |
(0.107) |
(0.12) |
|
mtr |
2.799*** |
2.043** |
2.056*** |
(0.772) |
(0.752) |
(0.726) |
|
mtr2 |
-9.476*** |
-6.282** |
-6.348*** |
(2.738) |
(2.401) |
(2.405) |
|
Year |
0.047*** |
0.042*** |
0.042*** |
(0.008) |
(0.007) |
(0.007) |
|
Log-likelihood |
-0.100277 |
299.6087 |
-1.244469 |
Schwarz criterion |
22.50435 |
-409.6351 |
24.79273 |
Joint significance |
17.665*** |
16.962*** |
50.993*** |
Notes: *, ** and *** account for p<0.1, p<0.05, p<0.01, *** p<0.001. (·) denotes the standard error.
Based on the third model, i.e., the random-effects model (see table 1, third column), we infer that OLS is not a consistent estimator.4 Moreover, the Hausman test provides evidence of a non-systematic difference in coefficients (p = 0.25). In sum, the random-effects model appears to be consistent and efficient. The estimates associated with MTR are statistically significant and yield the expected concave quadratic form. Based on the random-effects model estimates, we compute the optimal MTR, which is equal to US$ 0.16 in real (2012) prices.
These estimates, along with the population predictions for OECD countries, allow us to measure the potential benefits that each country would obtain if the optimal termination rate (US $0.16) prevailed rather than the actual one (i.e., the last one available in the sample). We present this counterfactual exercise by calculating the potential increase in MTU (as a proportion of the actual MTU). A word of caution is required: in figure 3, we show the gap between the optimal termination rate and the actual. It is clear that this gap has been decreasing over time in all countries.

Source: Authors' own graph based on OECD (2019a, 2019b) data.
Figure 3 Trend towards optimal termination rate
Hence, the benefits of using the optimal rate diminish over time too. That said, we next present a counterfactual exercise (using the population predictions for some OECD countries) that compares the difference (or gap) between the total number of users (MTU) yielded by the optimal MTR and that yielded by the observed MTR. The results for selected countries are shown in table 2.5
Table 2 Estimated gap between the total number of users yielded by the optimal rate rather than the actual termination rate
Year |
Country |
Gap (%) |
Country |
Gap (%) |
2017 |
Mexico |
5.73 |
Spain |
3.47 |
2018 |
5.60 |
3.39 |
||
2019 |
5.47 |
3.31 |
||
2020 |
5.35 |
3.23 |
||
2021 |
5.22 |
3.16 |
||
2022 |
5.09 |
3.08 |
||
2023 |
4.97 |
3.00 |
||
2024 |
4.84 |
2.93 |
||
2017 |
United States |
8.34 |
Italy |
6.44 |
2018 |
8.15 |
6.29 |
||
2019 |
7.96 |
6.15 |
||
2020 |
7.78 |
6.00 |
||
2021 |
7.59 |
5.86 |
||
2022 |
7.41 |
5.72 |
||
2023 |
7.23 |
5.58 |
||
2024 |
7.05 |
5.44 |
||
2017 |
France |
7.22 |
Japan |
3.07 |
2018 |
7.06 |
3.00 |
||
2019 |
6.90 |
2.93 |
||
2020 |
6.74 |
2.86 |
||
2021 |
6.58 |
2.79 |
||
2022 |
6.42 |
2.73 |
||
2023 |
6.26 |
2.66 |
||
2024 |
6.10 |
2.59 |
||
2017 |
Germany |
4.09 |
Australia |
4.83 |
2018 |
4.00 |
4.73 |
||
2019 |
3.91 |
4.62 |
||
2020 |
3.82 |
4.51 |
||
2021 |
3.73 |
4.40 |
||
2022 |
3.64 |
4.30 |
||
2023 |
3.55 |
4.19 |
||
2024 |
3.46 |
4.09 |
2.2. Penetration rate estimates under exogenous/endogenous regimes and degree of competition
We consider a range of variables that might influence penetration rates in OECD countries, including: (i) the telecommunications payment regime (CPP or RPP and “Bill and Keep”); (ii) the degree of competition in the telecommunications market; (iii) the existence of prepaid cards in the market; (iv) the number of fixed-telephone lines; (v) the number of inhabitants; (vi) the population density; (vii) the GDP per capita, and; (viii) the ratio of individuals using the internet. The variables are those used in DK's work, except the last one. We test the same group of variables in our empirical analysis for comparison purposes. That said, we must take into account that DK's data sample was constructed prior to the emergence of massive internet use. The proportion of Internet users in a given country allow us to study the relationship, if any, between Internet use and the mobile telephone sector.
As mentioned previously, there are 32 countries in our sample that use CPP and two that use RPP during the sample period (2000-2018).6 As stated, the mobile penetration rate in OECD countries exhibits an upward though gradually declining trend; this would suggest that a logistic curve might be appropriate for modeling the dynamics of the MTU.
Following DK, the prices and costs of the cellphone companies are not considered in our study; and the population density variable will only be used to find out if it has any statistical significance on the penetration rate. We expect it to have a positive effect on penetration rates, as DK suggest: the higher the concentration of inhabitants in an area, the lower the costs should be for companies to provide mobile telephony services; in other words, the same infrastructure would cover a larger number of inhabitants in a more densely-populated country than it would in a less densely populated one. It is worth noting that Korea, the Netherlands, and Japan have the highest population densities, whilst Australia, Iceland, and Canada have the lowest.
As for the remaining controls, we employ GDP per capita variable in real terms (2012 dollars) as a proxy for each country's income per capita. The number of subscribers to mobile telephony services per country will be useful in order to estimate the saturation rate in each one. Moreover, the relationship between the Internet use and the saturation rate is expected to be positive. It should be taken into account, however, that use of social media applications on cellphones was not as widespread at the beginning of the sample as it currently is.7
Diffusion process with exogenous regulation: We first assume that the adoption of the billing regime is settled independently (exogenous regulation), i.e., the authorities of each country make their decisions without considering the behavior of the telecommunications market.
Remember that the regression to be estimated is given by
Table 3 Estimated gap between the total number of users yielded by the optimal rate rather than the actual termination rate
Dependent variable: |
OECD |
CPP Countries |
RPP Countries |
RPP Countries |
Saturation rate |
Fixed effects |
Pooled OLS1 |
||
I |
II |
III |
IV |
|
Constant |
-.852*** |
-.821*** |
-1.315*** |
-1.242*** |
Trend |
.160*** |
.132*** |
— |
— |
Regime |
-.011*** |
— |
— |
— |
Competition |
-.007*** |
-.011*** |
— |
— |
Pre-paid |
-.025*** |
-.012** |
— |
— |
Fixed lines |
-.08*** |
-.099*** |
.153 *** |
— |
Population |
1.19E-07*** |
3.31E-07*** |
1.18E-05** |
— |
Density |
-2.10E-05** |
-3.99E-05*** |
-1.60E-07** |
— |
GDP pc |
-5.76E-07*** |
-3.54E-07*** |
— |
.048* |
Internet |
.077*** |
.067** |
— |
— |
R2 (SDV) |
.906 |
.906 |
.990 |
.969 |
R2 (Intra) |
.802 |
.801 |
.989 |
.957 |
AIC |
-516.532 |
-490.214 |
-80.116 |
-56.153 |
BIC |
-348.251 |
-336.126 |
-71.387 |
-48.516 |
HQ |
-449.689 |
-428.868 |
-78.060 |
-54.354 |
Log-likelihood |
301.266 |
285.107 |
48.058 |
35.077 |
Joint significance |
284.186*** |
221.522*** |
433.210** |
127.079* |
Welch test |
83.054*** |
59.927*** |
1.806 |
— |
Breusch-Pagan test |
788.137*** |
716.672*** |
.009 |
— |
Wald Heterosk. Test |
4526.870*** |
3024.160*** |
13.332*** |
2.90E-04 |
Wooldridge test |
135.605*** |
123.378*** |
93.313* |
27.161** |
Hausman test |
38.220*** |
43.445*** |
1.290 |
31.566** |
Sample size |
370 |
348 |
22 |
22 |
Notes: p<0.1, p<0.05, p<0.01 and p<0.001 are indicated by *, **, ***, and ***, respectively. Breusch-Pagan and Hausman tests are obtained from the Random-Effects output regression considering the same set of explanatory variables. 1/In pooled-OLS regression, the R 2 (intra) is the corrected R 2, and the Hausman test is an F test: when the p-value is low, it is interpreted as evidence favorable to the fixed effects model.
There are four different estimators: regression I includes all of the OECD-member countries during the period of study; regression II excludes countries that have adopted an RPP payment regime; regression III considers only those that use RPP (Canada and the United States). Finally, regression IV also considers only those countries that use RPP, but is estimated using a different methodology (pooled OLS; see below).
Regression I: the effect of being under a CPP regime on the MTUs is negative, that is … results in a decline of 1.1% in the rate of users. The effect of internet use is a 7.7% increase in the saturation rate. Pre-paid cards and fixed lines have a negative impact on the MTUs. Note that the trend effect is a slight increase (0.16%). Unexpectedly, the GDP per capita has a negative impact on the MTU. This counterintuitive result may be due to possible collinearities with population, as argued by DK.
Regression II: since most OECD countries are under a CPP regime, results obtained in regressions I and II are similar, as can be seen in the second column of table 3. Nonetheless, note that the effect of a population increase on the penetration rate in CPP countries is greater than with the full sample. The later result suggests that there is greater sensitivity to the growth rate of population in the market under CPP. Moreover, the positive effect of internet use prevails, but at a lower rate than in regression I.
Regression III and IV: when only RPP countries are included (i.e., Canada and the United States), the estimates are not statistically significant, and the null hypothesis of a common intercept is rejected. This result suggests that, given the similarities in the Canadian and US telecommunication markets, the fixed-effects method is an adequate approach. We also estimate the regression using pooled OLS to compare the latter approach with the principal alternatives (fixed effects and random effects models). When we calculate the Hausman test for regressions I and II, the null hypothesis is rejected at the 1% level, so we infer that the fixed-effects method is a more appropriate methodology. As for regression III, we reject the null hypothesis of the Welch test (as the groups have a common intercept). We then calculate a joint-significance test for the means of the different groups test. On the basis of that test, we reject the null hypothesis--that pooled OLS is the adequate model, in favor of the fixed effects model.
Diffusion process with endogenous regulation: In a second stage, we allow the payment regime to be endogenous. The regime adopted and the number of competitors in the market are endogenously defined. We therefore estimate the regression via instrumental variables. To do so, a number of variables related to political and institutional characteristics are considered as instruments (see table C in the appendix for a description of these).8 Since the variables are binary, a logistic regression is used to obtain estimates of the type of regime and existence of competition (first step). The results are shown in table 4.
Table 4 First step regression
First stage regression |
Regime |
Competition |
Constant |
7.599*** |
2.054** |
Democracy |
——– |
.307*** |
Autocracy |
16.223*** |
——– |
Duration |
-.046*** |
-.005** |
Pseudo |
.526952 |
.642729 |
Log-likelihood |
-67.81245 |
.015992 |
χ2 |
151.079*** |
11.6127*** |
Sample size |
627 |
557 |
Predicted cases |
95.90% |
61.60% |
Note: p<0.1, p<0.05, and p<0.01 are indicated by *, ** and ***, respectively.
Regarding the two regressions (i.e., regime and competition) presented in table 4, we can state the following:
Regime regression: the probability of being under a CPP regime is higher the greater the degree of autocracy (see appendix C.) in the country, and is lower the shorter the duration of the political regime. The fact that a country is democratic or not does not affect the probability of its being under a CPP regime.
Competition regression: The probability of a country having more than three competitors in the telecom market is greater the more democratic the country, and the less autocratic and longer lasting its political regime.
We now proceed to measure the impact, if any, on the penetration rates in the OECD countries. Table 5 summarizes the results of the regressions obtained by considering endogenous regulation. The selection of variables is also made following the G2 S modelling strategy, as in the exogenous regulation section. We present results of the same four regressions specified in the previous section.
Table 5 Endogenous regulation in OECD countries
Dependent variable: |
OECD |
CPP Countries |
RPP Countries |
RPP Countries |
Saturation rate |
Fixed effects |
Pooled OLS1 |
||
I |
II |
III |
IV |
|
Constant |
-.873*** |
-.844*** |
-1.315*** |
-1.383*** |
Trend |
.112*** |
.098*** |
-2.177*** |
-3.141*** |
Regime |
— |
— |
— |
5.130*** |
Competition |
.052*** |
.045*** |
3.535*** |
— |
Pre-paid |
-.024*** |
-.018** |
.087*** |
— |
Fixed lines |
-.078*** |
-.090*** |
— |
— |
Population |
1.31E-07*** |
2.71E-07*** |
2.10E-05** |
1.47E-05** |
Density |
-1.65E-05* |
-2.12E-05*** |
-.182*** |
-.119* |
GDP pc |
-5.35E-07*** |
-3.73E-07*** |
1.38E-06* |
1.53E** |
Internet |
.085*** |
.029*** |
— |
— |
R2 (SDV) |
.907 |
.906 |
.997 |
.994 |
R2 (Intra) |
.805 |
.801 |
.996 |
.991 |
AIC |
-496.172 |
-464.176 |
-102.601 |
-90.486 |
BIC |
-333.070 |
-315.193 |
-92.781 |
-81.758 |
HQ |
-431.314 |
-404.794 |
-100.288 |
-88.430 |
Log-likelihood |
290.086 |
271.088 |
60.300 |
53.243 |
Joint significance |
51.616*** |
116.110*** |
784.285*** |
1126.718** |
Welch test |
82.418*** |
63.228*** |
.628** |
— |
Breusch-Pagan test |
796.118*** |
1217.380*** |
.034 |
— |
Wald Heterosk. Test |
10648.800*** |
7283.130*** |
.102 |
.613 |
Wooldridge test |
130.213*** |
121.643*** |
21.125 |
5.520 |
Hausman test |
17.798*** |
15.275** |
.985 |
11.694*** |
Sample size |
359 |
337 |
22 |
22 |
Notes: p<0.1, p<0.05, and p<0.01 are indicated by *, ** and ***, respectively. Breusch-Pagan and Hausman tests are obtained from the Random-Effects output regression considering the same set of explanatory variables. 1 In pooled-OLS regression, the R 2 (intra) is the corrected R 2, and the Hausman test is an F test: when the p-value is low, it is interpreted as evidence favorable to the fixed effects model.
The output of regression I shows that there was no significant difference in the impact of the variables on the saturation rate growth in CPP countries compared to RPP countries. Nonetheless, once endogeneity was taken into account, the impact of competition on the saturation growth rate was positive (5.2%) under both regimes. This is consistent with economic theory; it provides an insight on the benefits of competition in the mobile telecommunication sector, at least for OECD countries. Furthermore, the relation between internet users and saturation rates remains positive, but the effect is greater in this case (8.5%). Note also that prepaid cards, fixed lines and population density have negative effects, whilst population effect is positive. GDP per capita has a counterintuitive negative effect, which we conjecture may be due to collinearities with population, as in DK. Note also that the overall effect on MTU is positive (0.17), and should be interpreted as a pervasive and persisting force (in all countries) that drives people to use mobile phones.
Regression II (CPP countries) shows estimated coefficients similar to those of regression I, although there are some interesting differences. This is particularly noticeable with the effect of internet use (2.9%): the effect is almost three times smaller than in the full sample case. Note however that fixed lines and population have a stronger negative effect. Unfortunately, the negative effect of GDP per capita remains.
As for RPP countries (regressions III and IV), the results show a very strong positive impact of competition, whilst the trend has a negative impact on the penetration rate (this may be due to the fact that the United States and Canada have already a rather high MTU and the secular force that drives it has been slowly dying out). It is also worth noting that in regression III, the Welch test is rejected only at the 5% level. The latter result may reflect similarities in the mobile sector between RPP countries in the OECD. We therefore estimate the regression using pooled OLS (regression IV). In this case, the regulatory regime is statistically significant. The joint significance test is high and the corresponding p-value rather small, which suggests that fixed effects should be preferred. That said, the sample size of RPP regressions is very small and inference could be misleading and should therefore be drawn with caution.
3. Concluding remarks
Using a sample of 34 OECD countries that spans the period 2000-2018, we provide statistical evidence that there is a quadratic and concave relationship between mobile termination rates and mobile phone penetration, one which implies that there is an optimal termination rate that maximizes the number of users. This rate is estimated to be US$0.16 (2012).
This paper also proposes an improved specification for estimating the aforementioned quadratic relationship between saturation and mobile termination rates. Our proposal relies on feasible general equilibrium assumptions and produces consistent results. Once the saturation parameter has been estimated, we employ a random-effects model to obtain the relationship between the mobile termination rate and the number of mobile telephone users. As noted above, we believe that the estimation of the optimal rate is an important contribution of this work. It is worth adding that the fact that this estimate yields a number other than zero is also relevant.
We also found that the number of internet users, the degree of competence and the population size have a positive effect on the penetration rate, whilst the prevalence of pre-paid cards has a negative effect on it. The evidence concerning the effect of the regime (CPP or RPP) is inconclusive. When we allow the regulation to be exogenous, our results indicate that being under a CPP regime decreases the penetration rate; nonetheless, when we allow the regime to be endogenous, the effect of being under CPP is not statistically significant.

