


 nueva página del texto (beta)
 Inglés (pdf)
 Artículo en XML
 Referencias del artículo
 Enviar artículo por email
 Citado por SciELO
  Similares en
SciELO
Similares en
SciELO 
 Permalink
Introduction
The Efficient Markets Hypothesis (EMH) postulates that securities’ prices in financial markets are highly sensitive to the arrival of new information which is rapidly reflected in prices through many buy and sell decisions. The speed and volume of the transactions triggered by new information arrival eliminate any distortions in prices, and prevents investors earn extraordinary returns (Fama, 1970). Thus, the EMH implies that the information contained in historical asset prices is not useful to predict future returns since such prices are independent of each other, and follow unpredictable paths, known as random walks.
However, there is increasing evidence of the existence of market anomalies (Gayaker, Yalcin, & Berument, 2020; Plastun, Sibande, Gupta, & Wohar, 2020; Rossi, 2015). Among these anomalies are the so-called calendar (or seasonal1) effects such as the Day-of-the-Week (DOW) Effect (Anwar, Okot, & Suhendra, 2021; Santillán Salgado, Fonseca Ramírez, & Nelson Romero, 2019; Tadepalli & Jain, 2018; Vogelaar, Pimenta, Lima, & Gaio, 2014; Yardımcı & Erdem, 2020; Zhang, Lai, & Lin, 2017) and the Holiday Effect (HE) (Caporale & Plastun, 2017; Dumitriu & Stefanescu, 2020; Eidinejad & Dahlem, 2021; Marques, 2014; Mazviona, Mah, & Choga, 2021). The DOW and HE anomalies studied in the context of the MSE are the subject of interest in this paper. As in the case of other reported market anomalies (Bohl, Ehrmann, & Wellenreuther, 2020; Niroomand, Metghalchi, & Hajilee, 2020), these seasonal effects are at odds with the EMH and require a careful documentation and analysis.
The DOW and the HE anomalies for the Mexican market have been the subject of several studies, but their findings are frequently contradictory (e.g., Duarte, Sierra, & Garcés, 2013; Rojas & Kristjanpoller, 2014; Winkelried & Iberico, 2018). The present research contributes to the literature on calendar anomalies of the Mexican Stock Exchange (MSE) by examining that market’s capitalization subindices besides the aggregate stock market index, the Índice de Precios y Cotizaciones (IPC), to contrast both seasonal effects in different subsamples. Another innovation consists on the estimation of GARCH-family models with dummy variables for the analysis.
The main findings were that the DOW Effect was consistently present in both the returns and the volatility of the MSE index and different subindices. Similarly, the Holiday Effect was present in the volatility of the four series examined. However, it was absent from the return’s series, except in the case of the Medium Capitalization subindex.
The second part of this paper briefly reviews the literature on stock market anomalies and highlights the contributions of DOW and HE studies that have focused on the Mexican market. The third part describes the estimation methodology; the fourth part reports some relevant descriptive statistics of the data, and the estimation results; the fifth part presents the main conclusions.
Brief literature review
The day-of-the-week effect
Starting with the studies carried out by French (1980) and Gibbons & Hess (1981), many papers have reported the Weekend Effect with positive Friday average returns and negative Monday average returns. The literature has also documented statistically different average stock returns throughout the different days of the week.
Some of the more recent studies that discuss the Day of the Week (DOW) effect include, Zhang et al. (2017) who applied a GARCH model along with a rolling-window sampling strategy to study the DOW effect in the stock indices in 28 stock markets from 25 developed and emerging countries. The study concluded that the anomaly was present in all markets examined. Tadepalli & Jain (2018) employed ARIMAX modeling to examine the presence of the DOW effect in several indices of the Indian equity market and found a widespread existence of the DOW anomaly. Bahcivan & Karahan (2022) used a recently developed statistical method called Generalized Autoregressive Score (GAS) in combination with State-Space Modeling to overcome the intraday correlation dynamics due to non-synchronous trading and market noise to estimate intraday correlations in the Turkish equity market. The study found an upward trend at the closing of Monday’s trading session, possibly associated with the opening of the US markets. A high correlation was reported across different market conditions and days of the week during periods of high volatility, including a “distinguishable path for the beginning of the week”. Gkillas, Vortelinos, Babalos, & Wohar (2021) studied the DOW effect with an international dataset, focusing on the bid-ask spread determinants, and find evidence of an international DOW impact of prices, volatility, and volume on bid-ask spreads.
The DOW effect has also been examined to some extent in the Mexican stock market. The study performed by Cabello & Ortiz (2003) in the MSE between 1986 and 2001 showed that average returns on Mondays were statistically the lowest of the week, while average returns on Thursdays were the highest. Winkelried & Iberico (2018) concluded that the MSE presented significantly negative Monday returns between 1995 and 2014. They also concluded that the positive Friday effect was not present in Mexico’s stock market during that period. Zhang et al. (2017) applied GARCH (1, 1) specifications and found a significantly positive Wednesday effect in the returns of the MSE between 1994 and 2016. By applying the stochastic dominance approach, Kristjanpoller & Muñoz (2012) identified Monday and Friday anomalies in the Mexican equity market. Seif, Docherty, & Shamsuddin (2017) concluded that the IPC’s average returns on Friday were significantly the highest of the week.
Conversely, Rojas & Kristjanpoller (2014) did not find any DOW anomaly in the IPC between 1997 and 2008 by applying Bonferroni’s test. The results of the GARCH in mean (GARCH-M) model used by Torres & Alonso (2010) also rejected the presence of the DOW effect in the Mexican market between 2001 and 2009. The GARCH specifications used by Kristjanpoller (2012a) found no evidence of the DOW effect in the returns of the MSE from 1993 to 2007, even though that study identified a significantly negative Friday effect in volatility in the IPC. Evidence on the presence of the DOW effect for the Mexican market seems inconclusive, and this topic remains a fertile field for exploration.
The holiday effect
Numerous studies have found that stock returns are higher on the day before a stock market holiday. This anomaly, known today as the pre-holiday effect, was initially reported by Fields (1934). Five decades later, Lakonishok & Smidt (1988) found a related post-holiday stock market anomaly.
Dumitriu & Stefanescu (2020) looked for the presence of the holiday effect in four important stock indices of the U.S. market between January 1990 and April 2020. Their results using GARCH models denoted the existence of what they called the “Extended Holiday Effect”. In an analysis of the HE anomaly in the Thai stock market, the GARCH and EGARCH models used by Chancharat, Maporn, Phuensane, & Chancharat (2018) identified significantly positive pre- and post-holiday effects from 1992 to 2016. Similarly, the OLS specifications used by Gama & Vieira (2013) found significant evidence of the holiday effect in the Portuguese equity market between 2003 and 2012.
The OLS regressions used by Marques (2014) on the MSE and five other Latin American stock markets2 showed that the HE was not significant between 2007 and 2012. Similarly, Seif et al. (2017) and Winkelried & Iberico (2018) did not find evidence of the holiday effect in the IPC. Duarte, Sierra, & Garcés (2013) found no evidence of the post-holiday effect on the Mexican equity market between 2002 and 2013. By contrast, (Kristjanpoller, 2012b) concluded a significant presence of the post-holiday anomaly in the MSE, although the pre-holiday effect was not significant.
In brief, the literature has reported conflicting results on the presence of the DOW and HE in the stock market in different periods and for different geographies. Thus, the objective of this research is to determine the existence of these calendar anomalies in the Mexican Stock Exchange. The work hypothesis of this paper is that the DOW and HE effects exist on the returns and volatility of the four indices of the MSE, but that they have recently vanished. The confirmation of our hypothesis would mean that MSE market efficiency has increased.
Methodological aspects
This work studies the presence of the DOW and the HE on the MSE’s IPC (S&P/BMV IPC), as well as on the large-capitalization (S&P/BMV IPC LargeCap), medium-capitalization (S&P/BMV IPC MidCap) and small-capitalization (S&P/BMV IPC SmallCap) stock indices. The modeling approach is based on an Autoregressive Moving Average with GARCH effects (ARMA-GARCH) model with dummy variables, represented as equation (1), below:
where rt corresponds to the daily return of the IPC (or one of the subindices) on period t, α0 is the intercept that captures the average Monday return, that is, the reference date (c’) for this model is Monday. Coefficients α1, α2, α3 and α4 are the differences between the average return on Monday and the average returns on Tuesday, Wednesday, Thursday, and Friday, respectively, Di,t is the dummy variable corresponding to the i-th day of the week from Tuesday (i = 1) to Friday (i = 4), and
Two additional dummy variables were added to equation (1) to examine the pre-holiday and post-holiday effects in the Mexican stock market, as in equation (2), below:
DPRH,t is equal to one for the days before a holiday (i.e., pre-holidays) and zero otherwise, while DPOH,t is equal to one for the days after a holiday (i.e., post-holiday) and zero otherwise.
Considering the multiple market turbulence episodes that occurred during the sample period, an ARMA-GARCH model, capable to estimate the parameters of changing volatility, was selected. Anytime ARCH-LM tests did not reject the null hypothesis of constant variance of
Following Caporale & Zakirova (2017), Kristjanpoller & Arenas (2015), and Kristjanpoller (2012a), an ARMA-GARCH (i.e., AR(m)-GARCH (p, q)) specification was used:
In expression (4), which represents the mean equation of the GARCH (1, 1) model, rt-j denotes the jth lag of the returns. The number of lags to be used was determined based on the results of the AR(p) model described by equation (3), and only those lags that turned out to be significant and contributed to minimizing the Akaike information criterion (AIC) were included in the final version of the model.
In equation (5) α1 and β1 represent the variance equation’s coefficients for the lags of the error term and the variance, respectively. Connolly (1989) asserts that it is feasible to expand the GARCH model to include other effects in the conditional variance. Hence, the
Besides using the conventional GARCH (1,1) model with dummy variables, this research also estimated the Exponential GARCH (EGARCH) model proposed by Nelson, (1991) and the Threshold GARCH (TGARCH) specification developed independently by Glosten, Jagannathan, & Runkle (1993) and Zakoïan (1994), revised to include exogenous variables (dummy variables in this case), following an approach similar to the procedure described for GARCH parameterizations (Begiazi & Asteriou, 2015). Equations (6) and (7) represent the TGARCH (1, 1) and EGARCH (1, 1) models used to examine asymmetrically clustered volatility, respectively3:
Coefficient
The
GARCH family models fail to capture the non-normality of the data, so we use a non-parametric Kruskal-Wallis (K-W) test to examine the differences between the returns on a specific day of the week and other days. Equation (8) represents the K-W model:
where N is the total number of observations,
Data and results
Daily observations on the closing level of the IPC and the three subindices were retrieved from Economática. The complete sample period for the IPC comprised from January 3, 2000 to September 28, 2018. However, due to data availability limitations the series for the LargeCap, MidCap, and SmallCap indices only include observations from October 26, 2006, to September 28, 20185.
Ortiz Bolaños, Hernández Henao, & Quintanilla Dieck (2015), Russo & Katzel (2012), and Santillán-Salgado (2015), among others, have stressed the extensive influence of the Subprime Mortgages Crisis and its consequence, the Great Recession (2007-2009), on the social, economic, and financial arenas around the globe. The European Sovereign Debt Crisis started during the autumn of 2009 also had important economic and financial consequences, in several regions of the world (Cabello, Moncarz, & Ortiz, 2015). Given the extraordinary nature of the period, we considered it appropriate to determine the performance of the calendar anomalies in the MSE before, during, and after the two financial crises episodes, an issue rarely examined in the literature.
The complete period was divided in four subperiods: a) before the Great Recession, from January 2000 to March 2007; b) during the Great Recession, from April 2007 to September 2009; c) during the Eurozone Sovereign Debt Crisis, from October 2009 to December 2012; and, d) after the Eurozone crisis, from January 2013 to September 2018 (see Figure 1).
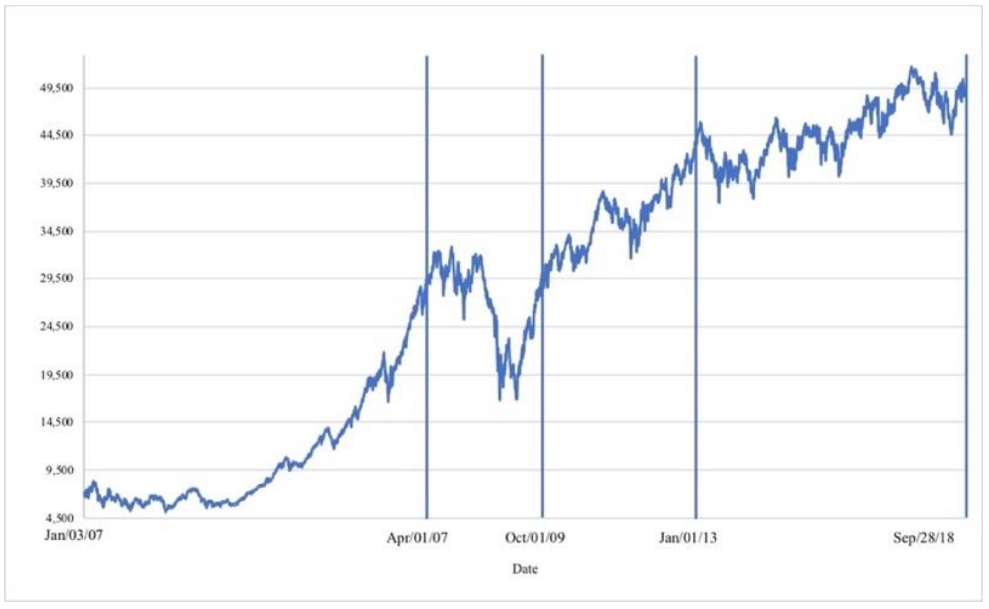
Source: Authors’ own elaboration with data retrieved from Economática.
Figure 1 Evolution of the IPC 2007-2018.
The subperiods for the IPC were determined based on previous studies (Cabello et al., 2015; Do, Powell, Singh, & Yong, 2018; Russo & Katzel, 2012; Santillán-Salgado, 2015). In the case of the subindices, the full period was divided into two subperiods: a) from October 2006 to September 2009 and b) from October 2009 to September 2018, due to data availability limitations (see Figure 2).
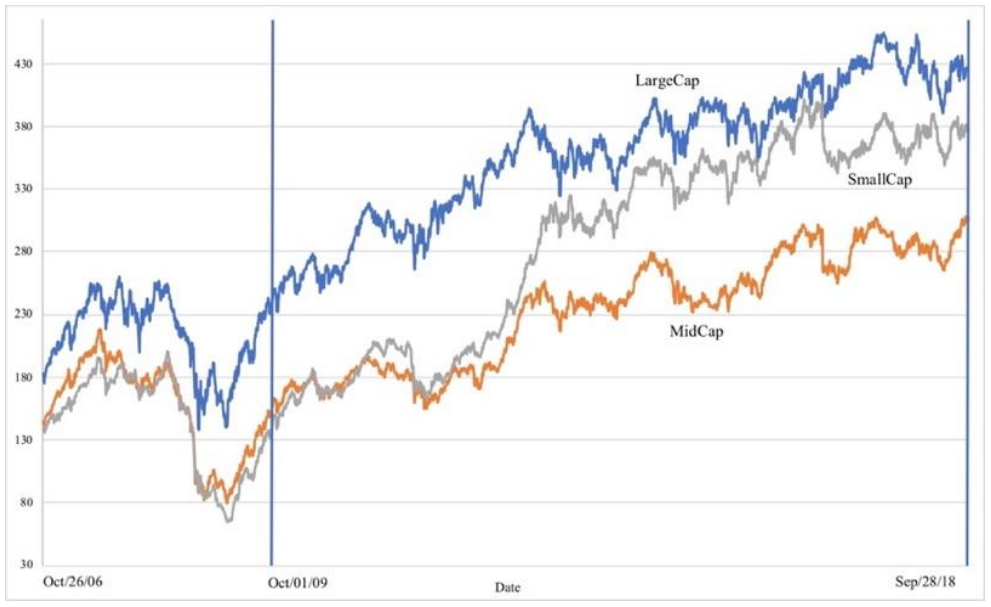
Source: Authors’ own elaboration with data retrieved from Economática.
Figure 2 Evolution of the Capitalization Size Subindices 2006-2018.
To analyze the returns of the Mexican stock market indices, daily data were used to compute the logarithmic returns of the four indices in the sample:
In equation (9) rt is the close-to-close continuous return corresponding to day t, Pt is the index adjusted closing price on day t, Pt-1 is the index adjusted closing price on the previous day, t - 1.
Table 1 displays descriptive statistics for the returns of the IPC, along with the results of the Augmented Dickey-Fuller (ADF) and KPSS unit root tests for the whole period, as well as the four subperiods of interest. Table 2 shows the same information for the IPC LargeCap, the IPC MidCap, and the IPC SmallCap indices.
Table 1 IPC’s Returns Descriptive Statistics: Daily Data
| Full Period | Pre-crises | Great Recession | European Crisis | Post-crises | |
|---|---|---|---|---|---|
| Jan/03/2000 - Sep/28/2018 | Jan/03/2000 - Mar/31/2007 | Apr/01/2007 - Sep/30/2009 | Oct/01/2009 - Dec/31/2012 | Jan/01/2013 - Sep/28/2018 | |
| Descriptive Statistics: | |||||
| Mean | 0.0396% | 0.0738% | 0.0026% | 0.0474% | 0.0083% |
| Median | 0.0308% | 0.0778% | 0.0354% | 0.0397% | 0.0000% |
| Maximum | 10.4407% | 7.0199% | 10.4407% | 4.1672% | 3.5251% |
| Minimum | -8.2673% | -8.2673% | -7.2661% | -6.0620% | -4.6789% |
| Standard deviation | 1.2546% | 1.3764% | 1.8832% | 0.9778% | 0.8130% |
| Skewness | 0.02839 | -0.10756 | 0.31270 | -0.55201 | -0.19315 |
| Kurtosis | 8.81 | 6.21 | 6.88 | 6.70 | 5.02 |
| |
|
|
|
|
|
| Jarque-Bera | 6882.78 | 816.93 | 421.13 | 526.07 | 264.26 |
| ρ-value | < 0.01 | < 0.01 | < 0.01 | < 0.01 | < 0.01 |
| Observations | 4890 | 1890 | 653 | 848 | 1499 |
| |
|
|
|
|
|
| Unit Root/Stationarity Tests: | |||||
| ADF | |||||
| t statistic | -31.081 | -30.989 | -23.470 | -18.279 | -19.032 |
| ρ-value | < 0.01 | < 0.01 | < 0.01 | < 0.01 | < 0.01 |
| KPSS | |||||
| t statistic | 0.160 | 0.022 | 0.178 | 0.044 | 0.046 |
| ρ-value | > 0.10 | > 0.10 | > 0.10 | > 0.10 | > 0.10 |
Source: Authors’ own elaboration with data retrieved from Economática.
Table 2 Size Indices Descriptive Statistics: Daily Data
| IPC LargeCap | IPC MidCap | IPC SmallCap | |
|---|---|---|---|
| Oct/26/2006 - Sep/28/2018 | |||
| Descriptive Statistics: | |||
| Mean | 0.0270% | 0.0242% | 0.0321% |
| Median | 0.0206% | 0.0368% | 0.0478% |
| Maximum | 10.2629% | 9.3894% | 6.8350% |
| Minimum | -7.1685% | -8.6734% | -6.8070% |
| Standard deviation | 1.1835% | 1.0389% | 0-9644% |
| Skewness | 0.14122 | -0.73202 | -0.76078 |
| Kurtosis | 11.01 | 11.87 | 9.81 |
| Jarque-Bera | 8321.10 | 10475.63 | 6309.82 |
| ρ-value | < 0.01 | < 0.01 | < 0.01 |
| Observations | 3112 | 3112 | 3112 |
| Unit Root/Stationarity Tests: | |||
| ADF | |||
| t statistic | -25.234 | -11.325 | -14.017 |
| ρ-value | < 0.01 | < 0.01 | < 0.01 |
| KPSS | |||
| t statistic | 0.074 | 0.070 | 0.089 |
| ρ-value | > 0.10 | > 0.10 | > 0.10 |
Source: Authors’ own elaboration with data retrieved from Economática.
According to the Jarque-Bera test6 in Table 1 and Table 2, the indices’ returns did not follow a normal probability distribution. Regarding the subindices, the returns of the IPC SmallCap exhibited the highest daily mean and median, as well as the lowest standard deviation. The LargeCap index presented the highest standard deviation.
Day-of-the-week effect results
The IPC and size indices DOW effect’s ordinary least squares regressions for the full period and the subperiods exhibited ARCH effects, except for the IPC model estimated for the European Sovereign Debt Crisis subperiod. According to Akaike’s Information Criterion (AIC), the EGARCH (1, 1) model was the most appropriate parameterization in all cases where GARCH-family models were applicable, as described earlier7. We used a quasi-maximum likelihood (QML) estimation since none of the EGARCH models’ residuals followed a normal probability distribution (Bollerslev & Wooldridge, 1992).
Table 3 reports the output for the EGARCH model corresponding to the IPC, for the full period and the four subperiods. Monday’s average returns were significantly positive during the full period and the European Crisis subperiod, which conflicts with the results regarding the presence of the Monday effect in the MSE reported by Cabello & Ortiz (2003) and Winkelried & Iberico (2018). The Kruskal-Wallis tie-adjusted test failed to reject the null hypothesis of equal returns on different days of the week8. All days of the week exhibited significantly lower volatility relative to Mondays during the full period or the subperiods. Fridays had the lowest volatility, a result that agrees with Kristjanpoller (2012a). However, the DOW effect in volatility disappeared during the last two subperiods.
Table 3 Day-of-the-Week: IPC
| Full Period | Pre-crises | Great Recession | European Crisis | Post-crises | |
|---|---|---|---|---|---|
| Jan/03/2000 - Sep/28/2018 | Jan/03/2000 - Mar/31/2007 | Apr/01/2007 - Sep/30/2009 | Oct/01/2009 - Dec/31/2012 | Jan/01/2013 - Sep/28/2018 | |
| Coefficient Value | Coefficient Value | Coefficient Value | Coefficient Value | Coefficient Value | |
| Mean Equation | |||||
| Monday (Constant) | 0.00062 ** | 0.00061 | 0.00010 | 0.00138 *** | 0.00032 |
| Tuesday (D1) | -0.00046 | 0.00029 | -0.00086 | -0.00138 | -0.00019 |
| Wednesday (D2) | -0.00041 | 0.00055 | -0.00066 | -0.00023 | -0.00056 |
| Thursday (D3) | -0.00050 | 0.00061 | 0.00059 | -0.00157 | -0.00098 *** |
| Frday (D4) | -0.00048 | -0.00030 | 0.00036 | -0.00134 | -0.00029 |
| Variance Equation | |||||
| Monday (Constant) | -0.03385 | -0.20210 | 0.26922 | ---- | -0.16896 |
| Tuesday (D1) | -0.06618 | -0.03109 | -0.73815 ** | ---- | 0.06134 |
| Wednesday (D2) | -0.28219 ** | -0.15355 | -0.43786 * | ---- | -0.11495 |
| Thursday (D3) | -0.20536 * | -0.16385 | -0.69780 *** | ---- | 0.02398 |
| Frday (D4) | -0.36264 *** | -0.47659 ** | -0.44262 | ---- | -0.12709 |
| ε2t-1 | -- | -- | -- | ---- | -- |
| σ2t-1 | -- | -- | -- | ---- | -- |
| ε2t-1 (ε2t-1 < 0) | -- | -- | -- | ---- | -- |
| |εt-1/σt-1| | 0.12654 *** | 0.11371 *** | 0.10458 *** | ---- | 0.03731 * |
| εt-1/σt-1 | -0.08157 *** | -0.11858 *** | -0.09995 *** | ---- | -0.10184 *** |
| log (σ2t-1) | 0.98668 *** | 0.96842 *** | 0.98620 *** | ---- | 0.98226 *** |
***, **, and * denote significance levels of 1%, 5%, and 10%, respectively.
Source: Authors’ own elaboration with data retrieved from Economática.
The results presented in Table 4 show evidence of the DOW effect in the large-capitalization index, since Thursday average returns were statistically lower than Monday average returns throughout the full period and the last subperiod. The returns of the IPC SmallCap index displayed a significant positive Friday effect in the complete period and the last subperiod. Also, the Kruskal-Wallis test rejected the hypothesis of equal returns on all days of the week during the full period. Thus, the presence of the Friday effect found by the EGARCH specification in the IPC SmallCap between 2006 and 2018 seems robust, a result that agrees with those reported in the literature for the MSE (Kristjanpoller & Muñoz, 2012; Seif et al., 2017; Winkelried & Iberico, 2018), even though not specifically for the small-capitalization index. Interestingly, during the subperiod 2006-2009, which roughly corresponds to the Great Recession, none of the size indices exhibited a significant presence of the DOW anomaly. Moreover, this calendar effect was consistently absent in the returns of the IPC MidCap throughout all time intervals.
Table 4 Day-of-the-Week: IPC Size Indices
| Full Period (Oct/26/2006 - Sep/28/2018) | Sub-period 1 (Oct/26/2006 - Sep/30/2009) | Sub-period 2 (Oct/01/2009 - Sep/28/2018) | |||||||
|---|---|---|---|---|---|---|---|---|---|
| IPC LargeCap | IPC MidCap | IPC SmallCap | IPC LargeCap | IPC MidCap | IPC SmallCap | IPC LargeCap | IPC MidCap | IPC SmallCap | |
| Coefficient Value | Coefficient Value | Coefficient Value | Coefficient Value | Coefficient Value | Coefficient Value | Coefficient Value | Coefficient Value | Coefficient Value | |
| Mean Equation | |||||||||
| Monday (Constant) | 0.00070 ** | 0.00042 | 0.00017 | -0.00026 | 0.00017 | 0.00028 | 0.00074 ** | 0.00040 | 0.00008 |
| Tuesday (D1) | -0.00084 * | -0.00050 | -0.00026 | -0.00009 | -0.00008 | -0.00086 | -0.00089 * | -0.00043 | -0.00007 |
| Wednesday (D2) | -0.00077 | 0.00021 | 0.00044 | 0.00075 | 0.00111 | 0.00078 | -0.00077 | 0.00009 | 0.00054 |
| Thursday (D3) | -0.00095 ** | -0.00022 | 0.00029 | 0.00131 | 0.00124 | 0.00071 | -0.00119 ** | -0.00043 | 0.00027 |
| Frday (D4) | -0.00071 | -0.00029 | 0.00124 *** | 0.00018 | 0.00139 | 0.00095 | -0.00061 | -0.00062 | 0.00120 ** |
| Variance Equation | |||||||||
| Monday (Constant) | -0.03903 | -0.16733 | -0.00145 | 0.21026 | 0.12121 | 0.15090 | -0.27844 ** | -0.81756 *** | -0.29558 |
| Tuesday (D1) | 0.01200 | -0.01181 | -0.39271 | -0.40861 | -0.52748 | -0.56579 | 0.15135 | 0.19869 | -0.29508 |
| Wednesday (D2) | -0.30711 ** | -0.39214 ** | -0.28591 | -0.64292 ** | -0.45997 | -0.25024 | -0.16983 | -0.37897 ** | -0.31704 |
| Thursday (D3) | -0.25187 * | -0.09789 | -0.18433 | -0.78070 *** | -0.56254 ** | -0.55551 * | -0.04559 | 0.11096 | -0.02538 |
| Frday (D4) | -0.21770 | -0.19491 | -0.45520 ** | -0.44629 | -0.57316 * | -0.70677 ** | -0.12789 | -0.03334 | -0.36968 |
| ε2t-1 | -- | -- | -- | -- | -- | -- | -- | -- | -- |
| σ2t-1 | -- | -- | -- | -- | -- | -- | -- | -- | -- |
| ε2t-1 (ε2t-1 < 0) | -- | -- | -- | -- | -- | -- | -- | -- | -- |
| |εt-1/σt-1| | 0.10893 *** | 0.16505 *** | 0.137523 *** | 0.11281 *** | 0.17156 *** | 0.15438 *** | 0.08925 *** | 0.16648 *** | 0.11039 *** |
| εt-1/σt-1 | -0.09183 *** | -0.06150 *** | -0.037743 ** | -0.11760 *** | -0.06838 ** | -0.04778 | -0.09983 *** | -0.11017 *** | -0.05782 *** |
| log (σ2t-1) | 0.98811 *** | 0.98068 *** | 0.982972 *** | 0.98087 *** | 0.98322 *** | 0.98322 *** | 0.97394 *** | 0.92659 *** | 0.95777 *** |
***, **, and * denote significance levels of 1%, 5%, and 10%, respectively.
Source: Authors’ own elaboration with data retrieved from Economática
Regarding the outcomes of the DOW analysis in the variance equations, all size indices exhibited significantly reduced volatility on at least one day of the week during the full period and at least one of the subperiods. Noticeably, Wednesdays displayed the largest number of statistically lower volatility coefficients.
In brief, the IPC mean returns presented evidence of the presence of the DOW effects, since Monday and Thursday returns were statistically different from those on other days of the week. Such an effect appeared in the two last subperiods examined, a result that opposes the notion of an increase in the MSE efficiency. The DOW effect was also detected in the volatility of the IPC, but it has recently disappeared.
The returns of the size-related indices also displayed evidence of the DOW effect, mainly in the IPC LargeCap index. However, that anomaly was not found in the returns of the IPC or the size indices in the subperiod corresponding to the Great Recession. The financial turmoil during that severe crisis episode increased the standard deviation of daily returns9, which, in turn, might have caused the lack of statistical significance of the DOW coefficients.
Holiday effect results
Except for the model used for the Eurozone Crisis subperiod, the residuals of all OLS regressions for the IPC showed heteroskedasticity, a finding that coincides with the results of the DOW examination for the same interval. As in the case of the DOW effect analysis, the EGARCH specifications were the best fit. Again, the residuals did not follow a normal distribution, so we applied QML estimation. The results of the EGARCH models for the IPC and the size indices are presented in Table 5 and Table 6, respectively.
Table 5 Holiday Effect: IPC
| Full Period | Pre-crises | Great Recession | European Crisis | Post-crises | |
|---|---|---|---|---|---|
| Jan/03/2000 - Sep/28/2018 | Jan/03/2000 - Mar/31/2007 | Apr/01/2007 - Sep/30/2009 | Oct/01/2009 - Dec/31/2012 | Jan/01/2013 - Sep/28/2018 | |
| Coefficient Value | Coefficient Value | Coefficient Value | Coefficient Value | Coefficient Value | |
| Mean Equation | |||||
| No post-holiday Monday (Constant) | 0.00053 ** | 0.00059 | -0.00018 | 0.00128 * | 0.00033 |
| Tuesday (D1) | -0.00044 | 0.00022 | -0.00037 | -0.00147 | -0.00023 |
| Wednesday (D2) | -0.00039 | 0.00033 | 0.00008 | -0.00017 | -0.00055 |
| Thursday (D3) | -0.00040 | 0.00062 | 0.00032 | -0.00149 | -0.00091 |
| Frday (D4) | -0.00034 | -0.00013 | 0.00068 | -0.00122 | -0.00023 |
| Pre-holiday (DPRH) | -0.00090 | -0.00120 | -0.00520 | -0.00066 | -0.00058 |
| Post-holiday (DPOH) | 0.00089 | 0.00197 | 0.00542 | 0.00274 | -0.00048 |
| Variance Equation | |||||
| No post-holiday Monday (Constant) | -0.11771 | -0.17150 | 0.14930 | ---- | -0.25676 |
| Tuesday (D1) | -0.00162 | -0.03408 | -059150 ** | ---- | 0.11209 |
| Wednesday (D2) | -0.20674 * | -0.12944 | -0.40356 | ---- | -0.07197 |
| Thursday (D3) | -0.15420 | -0.15899 | -0.63645 ** | ---- | 0.07837 |
| Frday (D4) | -0.22301 * | -0.43211 ** | -0.27425 | ---- | -0.03391 |
| Pre-holiday (DPRH) | -0.61945 *** | -0.70218 *** | -0.85285 ** | ---- | -0.35240 * |
| Post-holiday (DPOH) | 0.77557 *** | 0.78186 *** | 0.98297 *** | ---- | 0.45299 ** |
| ε2 t-1 | ---- | ---- | ---- | ---- | ---- |
| σ2t-1 | ---- | ---- | ---- | ---- | ---- |
| ε2t-1 (ε2t-1 < 0) | ---- | ---- | ---- | ---- | ---- |
| |εt-1/σt-1| | 0.13333 *** | 0.11036 *** | 0.11681 *** | ---- | 0.05444 ** |
| εt-1/σt-1 | -0.08611 *** | -0.11120 *** | -0.10270 *** | ---- | -0.10119 *** |
| log (σ2t-1) | 0.98585 *** | 0.97351 *** | 0.98326 *** | ---- | 0.97990 *** |
***, **, and * denote significance levels of 1%, 5%, and 10%, respectively.
Source: Authors’ own.
Table 6 Holiday Effect: IPC Size Indices
| Full Period (Oct/26/2006 - Sep/28/2018) | Sub-period 1 (Oct/26/2006 - Sep/30/2009) | Sub-period 2 (Oct/01/2009 - Sep/28/2018) | |||||||
|---|---|---|---|---|---|---|---|---|---|
| IPC LargeCap | IPC MidCap | IPC SmallCap | IPC LargeCap | IPC MidCap | IPC SmallCap | IPC LargeCap | IPC MidCap | IPC SmallCap | |
| Coefficient Value | Coefficient Value | Coefficient Value | Coefficient Value | Coefficient Value | Coefficient Value | Coefficient Value | Coefficient Value | Coefficient Value | |
| Mean Equation | |||||||||
| No post-holiday Monday (Constant) | 0.00063 * | 0.00021 | 0.00025 | -0.00063 | -0.00068 | 0.00040 | 0.00071 ** | 0.00030 | 0.00018 |
| Monday (Constant) | |||||||||
| Tuesday (D1) | -0.00086 * | -0.00051 | -0.00027 | -0.00015 | -0.00034 | -0.00119 | -0.00090 * | -0.00050 | -0.00015 |
| Wednesday (D2) | -0.00076 | 0.00025 | 0.00039 | 0.00103 | 0.00120 | 0.00089 | -0.00080 | 0.00013 | 0.00044 |
| Thursday (D3) | -0.00084 ** | -0.00003 | 0.00013 | 0.00130 | 0.00162 | 0.00031 | -0.00108 ** | -0.00032 | 0.00012 |
| Frday (D4) | -0.00055 | -0.00006 | 0.00101 ** | 0.00091 | 0.00183 * | 0.00029 | -0.00054 | -0.00026 | 0.00198 * |
| Pre-holiday (DPRH) | -0.00098 | -0.00004 | -0.00045 | -0.00234 | -0.00059 | -0.00115 | -0.00061 | 0.00011 | -0.00026 |
| Post-holiday (DPOH) | 0.00079 | 0.00277 ** | -0.00080 | 0.00617 ** | 0.00348 | -0.00114 | 0.00009 | 0.00222 * | -0.00027 |
| Variance Equation | |||||||||
| No post-holiday | -0.15709 | -0.33999 ** | -0.08612 | 0.13417 | 0.09264 | 0.06238 | -0.40231 ** | -1.08476 *** | -0.33605 * |
| Monday (Constant) | |||||||||
| Tuesday (D1) | 0.11098 | -0.07818 | -0.32410 | -0.30888 | -0.49617 | -0.68668 * | 0.25698 | 0.311049 | -0.19816 |
| Wednesday (D2) | -0.20252 | -0.33539 ** | -0.23187 | -0.56606 ** | -0.46941 | -0.39520 | -0.06628 | -0.289248 | -0.21805 |
| Thursday (D3) | -0.17287 | -0.00075 | -0.12739 | -0.70391*** | -0.53160 ** | -0.45898 * | 0.02587 | 0.207132 | 0.01082 |
| Frday (D4) | -0.02897 | -0.02191 | -0.32494 * | -0.31725 | -0.54378 | -0.74515 ** | 0.05388 | 0.153934 | -0.21720 |
| Pre-holiday (DPRH) | -0.61224*** | -0.71981 *** | -1.05028 *** | -1.01605 *** | -0.98411 *** | -1.43130 *** | -0.47674 ** | -0.590328 *** | -0.88869 *** |
| Post-holiday (DPOH) | 0.73907 *** | 0.96209 *** | 1.09206 *** | 1.00807 *** | 1.01547 *** | 1.61033 *** | 0.62674 *** | 0.983767 *** | 0.88415 *** |
| ε2t-1 | -- | -- | -- | -- | -- | -- | -- | -- | -- |
| σ2t-1 | -- | -- | -- | -- | -- | -- | -- | -- | -- |
| ε2t-1 (ε2t-1 < 0) | -- | -- | -- | -- | -- | -- | -- | -- | -- |
| |εt-1/σt-1| | 0.11446 *** | 0.16505 *** | 0.14311 *** | 0.11124 *** | 0.17679 *** | 0.21063 *** | 0.09976 *** | 0.20354 *** | 0.10737 *** |
| εt-1/σt-1 | -0.09790 *** | -0.06150 *** | -0.04275 ** | -0.11927 *** | -0.07960 ** | -0.06924 | -0.10255 *** | -0.11317 *** | -0.06196 *** |
| log (σ2t-1) | 0.98643 *** | 0.98068 *** | 0.98127*** | 0.98079 *** | 0.97944 *** | 0.97462 *** | 0.97198 *** | 0.91364 *** | 0.96133 *** |
***, **, and * denote significance levels of 1%, 5%, and 10%, respectively.
Source: Authors’ own.
The results in Table 5 suggest that IPC did not display significant abnormal returns before or after the holidays in any of the intervals examined. Also, the corresponding Kruskal-Wallis tests for all time intervals failed to reject the null hypothesis that the returns on holidays and non-holidays were the same. Therefore, the absence of the HE in the returns of the IPC seems robust. This result agrees with the findings recently reported in the literature (Seif et al., 2017; Winkelried & Iberico, 2018) but opposes the conclusions reached by Kristjanpoller (2012b) regarding the post-holiday effect on the MSE.
The results of the variance equations denote that there was significantly lower pre-holiday volatility in the complete sample period and the pre-crises and Great Recession subperiods. Moreover, post-holiday volatility was statistically higher throughout each of the time intervals considered, except for the European Crisis subperiod10.
According to the results displayed in Table 6, there were significantly higher than average post-holiday returns and statistically higher post-holiday volatility in the IPC MidCap in 2006-2018. The IPC LargeCap showed a comparable pattern in the first subperiod. So, in both instances, higher post-holiday returns might be related to higher volatility. On the other hand, the Kruskal-Wallis tests discovered no indication of the HE in the size indices. As in the case of the IPC, lower pre-holiday volatility was followed by higher post-holiday variance in the size indices. So, there is a tendency for post-holidays to exhibit higher returns and higher volatility, while pre-holidays present lower returns and lower volatility in the four indices.
In summary, our results show that the greatest number of DOW and HE anomalies on volatility occurred during the Great Recession in the four indices. Nevertheless, the DOW effect on returns appeared in the last two subperiods, that is, during the European Debt Crisis and post-crises subperiods.
The results also reveal that, overall, the IPC and the size indices’ returns were subject to significant shocks to the conditional variance and volatility clustering, a condition that rejects the EMH (Kumar & Dhankar, 2009). The large size of the latter term suggests that variance was persistent and changed only slowly through time. Also, the significantly negative coefficient values of the
The key findings of this research are reported in Table 7. The results of the regression models fail to reject the presence of the DOW effect in the returns of the IPC, the IPC LargeCap, and the IPC SmallCap in the full sample period. This conclusion agrees with the results reported by Kristjanpoller & Muñoz (2012), Seif et al. (2017), and Winkelried & Iberico (2018).
Table 7 Findings Overview
| IPC | IPC LargeCap | |||||||
| Returns | Volatility | Returns | Volatility | |||||
| Anomaly | The anomaly exists (HA) | The anomaly disappeared (HB) | The anomaly exists (HC) | The anomaly disappeared (HD) | The anomaly exists (HA) | The anomaly disappeared (HB) | The anomaly exists (HC) | The anomaly disappeared (HD) |
| Day-of-the-Week-Effect | Failed to reject | Rejected | Failed to reject | Failed to reject | Failed to reject | Rejected | Failed to reject | Rejected |
| Holiday Effect | Rejected* | --- | Failed to reject | Rejected | Rejected* | --- | Failed to reject | Rejected |
| IPC MidCap | IPC SmallCap | |||||||
| Returns | Volatility | Returns | Volatility | |||||
| Anomaly | The anomaly exists (HA) | The anomaly disappeared (HB) | The anomaly exists (HC) | The anomaly disappeared (HD) | The anomaly exists (HA) | The anomaly disappeared (HB) | The anomaly exists (HC) | The anomaly disappeared (HD) |
| Day-of-the-Week-Effect | Rejected* | --- | Failed to reject | Rejected | Failed to reject* | Rejected | Failed to reject | Failed to reject |
| Holiday Effect | Failed to reject | Failed to reject | Failed to reject | Rejected | Rejected | --- | Failed to reject | Rejected |
* Robust according to ANOVA and/or Kruskal-Wallis tests
Source: Authors’ own.
The hypothesis that the DOW anomaly has recently vanished was rejected for these three indices. Such findings diverge from some reports in the literature regarding the disappearance of this calendar effect from the stock markets in other equity markets (Tadepalli & Jain, 2018; Zhang et al., 2017), and the DOW effect seems to be persistent in Mexico’s Stock Exchange. In contrast, the hypothesis about the existence of the DOW effect in the returns of the IPC MidCap was consistently rejected, since the regression analyses did not find any evidence of its presence. Moreover, this finding is robust, according to the Kruskal-Wallis test.
The regression models consistently failed to reject the hypothesis that there is a DOW effect in the volatility of the four indices examined, and also failed to reject the hypothesis that this anomaly has disappeared from the volatility of the IPC and the small-capitalization index.
Conclusions
Market efficiency is a subject of great interest for policymakers and investors in charge of designing investment strategies. According to the EMH, investors cannot systematically beat the market through the inherent information of asset prices. However, the reported existence of market regularities, such as the Day-of-the-Week (DOW) and the Holiday Effect (HE), questions the absolute validity of this notion.
Although our results reveal that the DOW effect did not exist on the IPC MidCap, we find supporting evidence for the presence of the DOW effect on the returns of the IPC, large- and small-capitalization indices, and on the four indices’ volatility. Specifically, the results show evidence of Monday and Thursday effects in the returns of the IPC LargeCap, as well as a Friday anomaly in the IPC SmallCap. Furthermore, such effects have not disappeared from the size-related indices’ returns. The time- and size-related disaggregation of the series we performed allowed the identification of a recent significantly negative Thursday effect in the returns of the IPC and IPC LargeCap. This outcome contrasts with the findings reported in the literature regarding the vanishing of the DOW effect (Alt, Fortin, & Weinberger, 2011; Plastun, Sibande, Gupta, & Wohar, 2019) and questions the increase of efficiency in the MSE.
The results obtained for the DOW IPC’s volatility agree with those reported by Kristjanpoller (2012a), since the analysis found reduced volatility on Fridays; the small-capitalization index also showed that effect. Thus, the notion that Fridays are ‘good’ days for liquidity traders (Kiymaz & Berument, 2003) was confirmed for the IPC and SmallCap indices. Also, the analyses indicate that the IPC had significantly lower volatility on Wednesdays. The same anomaly was also present in the large- and medium-capitalization indices throughout the examined subperiods.
The regression model tests rejected the hypothesis that the HE was present in the returns of the IPC, the IPC LargeCap, and the IPC SmallCap, a conclusion that was further supported by the Kruskal-Wallis test results. This result agrees with the findings of other studies that report the absence of the holiday effect in the MSE (Duarte et al., 2013; Winkelried & Iberico, 2018). In contrast with the conclusion of nonexistence of the DOW effect in the IPC MidCap, the results denote a significant presence of the HE in the returns of that index from 2006 to 2018. This coincides with the conclusions reported in the literature about the existence of such an anomaly in the MSE (Duarte et al., 2013; Kristjanpoller, 2012b; Seif et al., 2017).
A pattern of low pre-holiday volatility and high post-holiday volatility in the four indices was significant and consistent across all time intervals considered. Our results indicate no evidence that this phenomenon disappeared from the size-related indices, which also challenges the notion of an increase in the MSE efficiency. A plausible explanation for the DOW effect is that volatility is higher on Friday and lower on Monday, and so are the corresponding average returns for those days (Campbell & Hentschel, 1992). However, that explanation does not hold in the case of the MSE’s indices. In any case, for example, significantly higher Monday average returns were generally accompanied by lower, although not significant, volatility.
On the other hand, the explanation proposed by Campbell & Hentschel (1992) for the Weekend Effect seems reasonable for the pre-holiday and post-holiday volatility and returns relationship found in this research. It has also been suggested that the HE may be explained by behavioral factors such as the change in the mood of investors before and after holidays (Dumitriu & Stefanescu, 2020; Gama & Vieira, 2013). In the case of the MSE, the significantly lower pre-holiday and higher post-holiday volatility patterns may, respectively, may relate to higher and lower trading volumes since such variables do not always move in tandem (Bollerslev, Li, & Xue, 2018). Moreover, liquidity traders are reluctant to trade in periods where the prices are more volatile (Foster & Viswanathan, 1990; Kiymaz & Berument, 2003). However, the pre-holiday and post-holiday pattern in the MSE leaves the door open for further research.

