


Servicios Personalizados
Revista
Articulo
 texto en
  Inglés (pdf)
 Artículo en XML
 Referencias del artículo
 Enviar artículo por email
Indicadores
-
 Citado por SciELO
 -
 Accesos
Links relacionados
-
 Similares en
SciELO
Similares en
SciELO
Compartir

 Permalink
Contaduría y administración
versión impresa ISSN 0186-1042
Contad. Adm vol.65 no.2 Ciudad de México abr./jun. 2020 Epub 09-Dic-2020
https://doi.org/10.22201/fca.24488410e.2018.1897
Articles
Model for generating value through intellectual capital in technology-based software companies
1 Universidad Tecnológica de Pereira, Colombia
The objective of this research is to propose a model to identify whether intellectual capital, composed of human capital, relational capital and structural capital, has a positive impact on the value of technology-based companies dedicated to software development. To define the model, we studied and analyzed the theory of intellectual capital and value generation, as the elements that compose it and the interrelation between them. To obtain the empirical information of the research, an online survey was used as instrument in order to construct the survey and define the indicators of the model, elements of different intangible valuation models were taken into account, which were adapted considering the characteristics of the companies under study. To test the hypotheses, to identify the relationship between the variables and to validate the proposed model, multivariate statistical analysis was used, using the Structural Equation Modeling (SEM) technique, considering in the different analyzes the statistical and practical significance.
JEL codes: D23; L86; G12; C39; C51
Keywords: Intellectual capital; Technology-based companies; Value generation; Structural equation models
El objetivo de esta investigación es proponer un modelo que permitiera identificar si el capital intelectual (CI), compuesto del capital humano, del capital relacional y el capital estructural, impacta positivamente en la generación de valor de las empresas de base tecnológica (EBT) dedicadas al desarrollo de software. Para definir el modelo se estudió y analizó la teoría referente al CI y la generación de valor, sus componentes y la relación entre ellos; para obtener la información empírica de la investigación, se utilizó como instrumento una encuesta en línea, la cual tuvo en cuenta elementos de diferentes modelos de valoración de intangibles, los cuales se adaptaron de acuerdo a las características propias de las empresas objeto de estudio. Para contrastar las hipótesis, identificar la relación entre las variables y validar el modelo planteado se utilizó el análisis estadístico multivariado, mediante la técnica de modelos de ecuaciones estructurales (MEE), considerando en los diferentes análisis la significancia estadística y práctica.
Código JEL: D23; L86; G12; C39; C51
Palabras clave: Capital intelectual; Empresas de base tecnológica; Generación de valor; Modelos de ecuaciones estructurales
Introduction
With the appearance and development of the new economy in the last decades-the economy of knowledge and information-companies have begun to give a leading role to knowledge, as they are considering it a fundamental element for value generation, advantages, and wealth. This knowledge is being transformed into information, which leads them to build new manners, methods, and ways of approaching problems to provide an added value that is useful for society. (Lanzas, A. 2015)
This added value that companies currently seek to give to their goods, services, methods, and processes, among others, has forced them to rethink and restructure the traditional policy of investment in assets that had occurred in past decades, such as investment in tangible capital (machines, raw materials, etc.), moving to investment in intangible capital, also called intellectual capital, such as customer satisfaction, the skills of workers, brand, information systems, know-how, among many others. (Lanzas, A. 2015)
What has driven and contributed most to the development of this new economy is globalization, which has led to the expansion of borders and markets, and competition has become global, forcing producers to become more competitive, to invest much more in research and development, to innovate, and to strengthen and train their employees (Torres, 2012, p. 17).
In the sense of the employees, Nevado and López (2004) state “that the performance of current societies depends increasingly on what they manage to do to prepare their people, develop their research and innovation capacity, and create systems to access, store, process, and use information regarding the investment in the formation of their IQ”. (p. 165)
All of the above has led to the formulation and implementation, in recent decades, of policies and strategies in Colombia (the country where this research was carried out) aimed at strengthening the creation, appropriation, and transfer of knowledge, such as the Science Law 1286 of 2009, the Entrepreneurship Law 1014 of 2016, the National Development Plan of Colombia 2014-2018, among others, which seek to develop strategies to generate knowledge and innovation in the productive apparatus, and permeate a culture of innovation and entrepreneurship in all spheres of the State.
The economic trends, plans, laws, and programs mentioned above have created the spaces and conditions for the emergence in Colombia of a new type of company called technology-based companies (TBC), that is, companies based on knowledge and innovation.
The different actors of society in Colombia (State, company, and university) have carried out projects and programs in a coherent and integrated manner to support TBC so that these companies can understand, integrate, and develop strategies to be effectively involved in the new information society and knowledge economy. Such support has focused mainly on providing financing mechanisms (which are insufficient), and promoting workspaces together with universities, research groups, technology parks, business incubators, among others, aimed at strengthening technological development. However, they do not accompany companies in their development and management processes, in fact, it is evident that in no small extent TBC in Colombia are presenting deficiencies in their internal management, because they have concentrated their efforts in the specialized technical development of their products or services, and have neglected the internal financial and administrative processes that allow them to determine the impact of their decisions (Padilla, 2015).
It is evident and somehow logical that TBC dedicate most of their efforts and resources to the development and creation of knowledge and innovation; however, neglecting the internal processes of the same can lead them to lose opportunities and not generate value for their owners.
TBCs belonging to the Parquesoft Colombia Technology Park were taken into consideration to carry out the research. These are companies dedicated to the development of computer solutions with a high innovative component.
Theoretical Framework
Intellectual Capital (IC); new asset in the knowledge economy
The concept of IC has been dealt with by various authors, and there is no generally accepted definition as such, but common elements referring to value creation, intangible assets (without physical substance), strategic assets, knowledge, and skills are evident in almost all definitions, mainly the following.
The University Institute Euroforum Escorial (1998), cited by Ochoa, M (2010) defines IC “as the set of intangible assets of an organization, which, although not reflected in traditional financial statements, is currently perceived by the market to generate value or to have the potential to generate value in the future” p. 35.
For Edvinsson and Malone (1998) IC refers to the relationships with customers and suppliers, the knowledge that the company possesses, technological capacities, and expertise of its employees, among others, capable of generating a competitive advantage in the market.
Ordoñez, P. (2004) citing Bueno, E. (1998) defines IC as “the set of distinctive basic competencies: some of technological origin, which also include all the elements of knowledge and experience accumulated by the company; others of organizational origin or those from the ‘action processes’ of the organization, and others of a personal nature, concerning the attitudes, aptitudes, and skills of the members of the organization”. p. 134
For this research, IC shall be understood as all those assets of an intangible type that the company owns, that do not appear in the financial statements, that originate from knowledge, and that offer possibilities of generating value if they are appropriately managed.
Components of the Intellectual Capital (IC)
Several classification proposals presented by different authors were reviewed for this research, and it was decided to take the classification proposed by Sveiby (2007), which approximates the classifications given by Edvinsson and Malone (1998); Kaplan and Norton (2008); Nevado and López (2013); Brooking (1996); Modelo Meritum, Camisón, Lapiedra, Segarra, and Boronat (2003) (Modelo Nova); and Modelo Intelect. Similarly, said classification was validated with the characteristics of the companies that were the object of study. The classification was also validated with the characteristics of the companies under study. Therefore, the IC is made up of the following components:
Human Capital (HC): Human capital focuses, as its name implies, on the people who are part of the organization, including teamwork, remuneration, and incentive systems, a culture of innovation, and education and training programs.
Structural Capital (SC): Is the knowledge that the company appropriates and that generates value, which remains in time. It includes organizational routines such as information and communication systems, research and development processes, and flexible organizational structures.
Relational Capital (RC): Refers to the value had by a company from the set of relationships it maintains with the environment, whether with its customers, suppliers, or R&D partners, and the perception they have of it. It includes teamwork with clients, relationships with suppliers, work with research groups, and participation in networks.
Technology-Based Companies (TBC) - Parquesoft Colombia
TBC defines as those organizations that generate value through the systematic application of technological and scientific knowledge, which design, develop, and make products, services, processes, and procedures with high innovation components. (Colciencias, 2008).
For Fariñas and López (2006), cited by Merritt, H. (2012), the creation of TBC presents excellent economic and social advantages due to its potential to achieve high growth rates in a relatively short period of time, to generate innovative items, to create high quality jobs, and its proclivity to generate products with higher added value and better rates of profit. (Lanzas, A. 2015)
The companies that are the object of study belong to a Colombian non-profit foundation founded in 1999, whose purpose is to facilitate the creation and development, for young entrepreneurs, of TBC that provide products and services of information technology to the market; it is called Parquesoft Colombia. The companies in the park have the following characteristics (Lanzas, A. 2015):
They emerge from entrepreneurial initiatives at universities, colleges, and institutes.
They function in the first years as informal companies, legally constituted at the moment in which their processes are formalized, and they have some positioning in the market. In the first years, negotiations are carried out at the forefront of the Park.
They are companies where the employees are mainly their owners; they resort to contracting third parties as they develop specific projects.
They work in associative networks to meet the needs of customers. One company supports the other in meeting the needs of customers.
They are proficient in software development processes but lack well-defined administrative and financial processes.
Most of them are physically located in the facilities offered by the Park, which covers the costs of connectivity, rent, public services, among others.
They have strong relationships with research groups and government sectors to develop research processes and obtain funding resources.
Value generation
The traditional objective of the companies has been to obtain the maximum benefit to achieve their survival. Nowadays, organizations have as a new aim to create or to generate value, not only to survive, but also to grow with time.
Generating value is a process that consists of identifying, creating, and maintaining opportunities and knowledge in order to allow companies to gain advantages to sustain and grow in the short, medium, and especially long term, this requires that the corporate objectives are integrated in a systemic manner with the strategies and resources necessary to achieve them. Under the protection of this process, companies can be oriented, managed, and measured, always to create value.
The creation of value involves identifying and exploiting the valuable resources the company has to improve its effectiveness, and this is translated into benefits for their clients, their employees, and especially their owners. It also means that the company can exceed initial expectations and that this enables it to have differentiating elements that generate advantages in the market.
“As value, we understand that conventional quality of the object not attributed from a calculation or an expert appraisal. Value is not a fact but an opinion” Álvarez (2010) citing Brilman (1990).
Traditionally, when speaking of value results and value creation in companies, this is associated with economic and financial indicators such as profitability, liquidity, risk, and financial structure. To measure the management of the company in its value creation process, financial tools are used such as return on investment (ROI), return on equity (ROE), economic value added (EVA), cash value added (CVA), discounted cash flows, among others.
It is relevant to point out that given the conditions of the current economy (knowledge economy), another series of non-financial indicators are included that help to identify whether organizations are generating value with future perspectives. When speaking of value with future perspectives, the fact that the company builds value with the capacity to generate even more value is referenced, that is to say, a value that allows it to sustain itself and grow over time, always with the aim of generating benefits higher than those expected by all the members of an organization (owners, employees, clients, and others).
Edvinsson et al. (1998), in the Skandia Navigator Model, propose a series of indicators in addition to the financial ones, which they call indices and that allow measuring the management of the company in the process of value creation. However, from the approach of proper IC use, these indices are related to customer satisfaction, employee training, motivation, leadership, market share, employee retention, administrative efficiency, among others.
Kaplan et al. (2008) in the Balanced Scored Card Model also propose a system that includes non-financial indicators that aim to measure business management through value generation. These are grouped under the perspective of customers, internal processes, and learning. These perspectives are closely related to relational capital, structural capital, and human capital, respectively.
In this research, non-financial indicators will be used to measure the value created in the companies of the park, a situation that is theoretically supported by the authors mentioned above.
Intellectual capital and value creation
The resources that affect the financial result of the companies can be classified as circulating assets (current), not circulating assets (fixed), intangible assets, and IC. Each resource participates in the generation of benefits for the organizations to a certain extent, which together would give the total benefits of the same. Lately, it has become indispensable to identify how the intangibles and the IC generate added value and increase the efficiency in the organizations to make strategic decisions. Therefore, intangible assets and IC have become an essential part of the market value of companies and organizations in general.
According to Ross et al. (1997), the total value of a company has two major components: Financial capital and IC. Financial capital refers to the components of value that are obtained by traditional valuation methodologies (multiples methods, accounting methods, based on value creation, mainly), and that can be represented in monetary values. The IC is in charge of valuing the intangible components of the organizations that generate the support of the financial results. The difficulty concerning this second component lies in the valuation of its component elements.
The analysis and specialized study of intangible assets (IC) arise from the limitations of traditional accounting since it does not provide sufficient information about their measurement and valuation. With traditional accounting, which only measures tangible assets and reports historical performance results, it is difficult to achieve full valuation of intangibles and thus cannot achieve a real vision of revenue potential for the company.
Since financial measures are not sufficient to determine the value status of an enterprise, other types of measures show a balanced value scheme between financial and intangible resources. “The development of a new measurement architecture requires defining what types of data a company needs to measure according to its strategies, how this data can be generated, and what rules must be followed to regulate its flow” (Santa y Salas 2012, p. 25).
It is possible to state that at this moment the IC is providing greater efficiency and proper sources of value creation, which add to the real value that a company has in the market (Casanueva, Palacios and Val, 2007). “The value of future profits lies in intangible values such as key people, networks and relationships, alliances, culture, and knowledge.” (Edvinsson et al. 1998, p. 49).
The valuation of intangibles and IC seeks to determine-through the use of mathematical and statistical models and as accurately as possible-the value of those company resources that are not material and that contribute to the generation of wealth and value.
Usually, when the term general asset valuation appears, reference is made to the economic and financial value of the assets that a company owns, that is, to their monetary value and, usually, not to their subjective value. For this research, it is necessary to clarify that the concept of value is not considered a monetary term, but rather a term of perception between the relations that exist between the variables to be analyzed since intangible assets are basically non-financial assets that contribute significantly to value generation in organizations.
To create value, intangible assets and IC must be transformed into products or services from which some value is derived. Intangible assets are generally called performance drivers, suggesting causal relationships between these resources and the creation of organizational value (Meljem et al., 2010, p. 82).
Estrada and Dutrénit (2007), citing Dierickx and Cool (1989), point out that: “In value creation processes, intangible resources such as creativity, talent, or an innovative perspective, can generate sustainable competitive advantages since they are unique, difficult to imitate, tacit in nature, and complex” (p. 131). This is how competitive success is associated with the availability and accumulation of intangible resources.
Measuring the impact of IC on value generation requires “transforming the way it is measured from a traditional activity-based approach (measuring what is done) to a new results-centered approach (measuring what is achieved and the effect it generates)” (Torres, 2005, p. 52). Valuing intangible assets and IC makes sense only to the extent that they can be translated into business results such as productivity, quality, customer service, competitiveness, profitability, value generation for the shareholder, among others (Torres, 2005, p. 53).
For Cañibano, García -Ayuso, and Sánchez (1999) the IC is generally considered as a fundamental determinant of the value of the company, and as an element closely associated with the existence of competitive advantages; this is supported as well by the Nova Model developed by Camisón et al. (2003).
Therefore, it is possible to state that an improvement in IC, understanding that its components (human capital, structural capital, and relational capital) are improved, generates a positive impact on value generation.
Proposed Model
As mentioned above, the IC is made up of three components: HC, SC, and RC. This conformation is the result not only of the differentiated accumulation of each one, but also of the connection and interrelation between them; that is to say that the components are not isolated elements, but somewhat connected and closely linked elements. Citing Bontis (1998), Sánchez, Melián, and Hormiga (2007) “certify the existence of the mentioned connections” (p. 108). The components of intellectual capital are not completely useful independently, and their combination offers more advantages for the benefit of companies. For Edvinsson et al. (1998), intellectual capital is the result of the joint management of HC, SC, and RC; the combination of these three components is what provides the source of value creation for the organizations.
For Sveiby (2007), Bontis, Know, and Richardson (2000), and the West Ontario University Model, there is a causality between the IC components, with the human capital component being the basis for the development of the relational and structural components; this, in turn, influences the results of the organizations.
Nonaka (2007) and Bueno, Del Real, Fernández, Longo, Merino, Murcia et al. (2011) in their Intellectus Model affirm that the IC base is in the HC and the RC, and these give rise to the EC. Nonaka (2007) expresses that the knowledge that the employees have (HC) and the relations that the company has (RC) must be conserved through the documentation and normalization of the same, generating the SC and protecting in this way the knowledge that leaves the company with the departure of the employees.
Taking into account the theoretical foundation presented so far, and according to the characteristics and needs identified in Parquesoft, a model is needed to determine if the IC that these companies currently have is contributing with value generation. Therefore, a model is proposed that identifies the impact that the IC has on value generation. Articulating the different pieces of the model that have been presented through the document, the following is obtained:

Research Methodology
The research carried out is of correlational type, applied type, vertical transverse type, non-experimental, and mixed type. The most important methodological elements in the development of the research are:
Construction of data collection instruments
To construct the data collection instrument-in this case, the survey-the elements proposed in the previous model were determined as variables. To measure the research variables, given that they are latent (non-observable) variables, several observable indicators are used. To determine the indicators to be used, a bibliographic review was carried out, through which the following indicators were defined (see Tables 1, 2, 3, and 4):
Table 1 Indicators of Human Capital (HC)
| Dimension | Survey Questions | Name of the indicator | Source | Type of Scale |
|---|---|---|---|---|
| Teamwork | Ideas for improvement usually come from teamwork | CH_TE_V1 | Own elaboration based on the Intelect project (1998) | Likert Scale |
| There is a high degree of trust among the people in our organization | CH_TE_V2 | Santos et al., 2011 p. 83 | Likert Scale | |
| Everyone in the company shares the same vision and seeks to achieve the same objectives | CH_TE_V3 | Own elaboration based on Delgado et al. (2011) p. 219 | Likert Scale | |
| Our employees support each other in formulating new ideas, solving problems, or increasing their daily work capacity. | CH_TE_V4 | Own elaboration based on Delgado et al. (2011) p. 219 | Likert Scale | |
| Education and training | Income per employee | CH_FyC_V3 | Roos et al (1997) | Ratio scale |
| Hours of training per employee | CH-FyC_V1 | Roos et al (1997) | Ratio scale | |
| Training expenses per employee | CH_FyC_V2 | Roos et al (1997) | Ratio scale | |
| Our employees have a high command of the English language | CH_FyC_V5 | Own | Likert Scale | |
| Our employees have a high degree of competence in computer and technological techniques. | CH_FyC_V4 | Martín et al (2009) p. 108 | Likert Scale | |
| Innovation culture | I see our company as innovative, with a willingness to experiment and the courage to take risks. | CH_CIn_V1 | Santos (2011) p. 80 | Likert Scale |
| We manage to extract value from the innovation process. | CH_CIn_V2 | Santos et al (2011) p. 80 | Likert Scale | |
| Our company has a work environment that encourages the active participation of people in the innovation of the company. | CH_CIn-V3 | Santos et al (2011) p. 80 | Likert Scale | |
| Remuneration and incentive systems | Our company provides incentives to employees who are innovative or who contribute ideas. | CH_RI_V1 | Martín et al (2009) p.108 | Likert Scale |
| Our employees have a high degree of satisfaction. | CH-RI_V2 | Martín et al (2009) p. 96 | Likert Scale |
Source: own elaboration taking into account the concepts of the cited authors
Table 2 Indicators of Structural Capital (SC)
| Dimension | Survey Questions | Name of the indicator | Source | Type of Scale |
|---|---|---|---|---|
| Tecnologías de la Información y comunicación | We use good practices | CE_TIC_V1 | Own elaboration | Likert Scale |
| Our organization uses registration and licensing as a way to preserve and protect knowledge | CE_TIC_V2 | Own elaboration | Likert Scale | |
| Our equipment and applications are state-of-the-art | CE_TIC_V3 | Own elaboration | Likert Scale | |
| Our organization has optimal internal communication channels | CE_TIC_V4 | Own elaboration | Likert Scale | |
| Dimension | Survey Questions | Name of the indicator | Source | Type of Scale |
| Research and Development | The number of developments and technological innovations has been high in the last three years | CE_ID_V1 | Adapted from Alama Alama et al (2009) p. 10 | Likert Scale |
| Our organization has the knowledge to compete in a global market | CE_ID_V2 | Alama et al (2009 p. 12) | Likert Scale | |
| Our company has a set of processes and procedures focused on promoting learning and innovation | CE_ID_V3 | Santos et al. (2011) p. 80 | Likert Scale | |
| Flexible organizational structure | Our employees can perform various functions in the company | CE_EOF_V1 | Own elaboration | Likert Scale |
| We have detailed descriptions of tasks, procedures, and policies to guide the action of employees | CE_EOF_V2 | Santos et al (2011) p. 80 | Likert Scale |
Source: own elaboration taking into account the concepts of the cited authors
Table 3 Indicators of Relational Capital (RC)
| Dimension | Survey Questions | Name of the indicator | Source | Type of Scale |
|---|---|---|---|---|
| Network participation | Participation in networks has allowed the organization to develop solutions and improvements in processes and products in recent years. | CR_PR-V1 | Own elaboration | Likert Scale |
| Our company has the skills to establish alliances | CR_PR-V2 | Martín et al (2009) p. 109 | Likert Scale | |
| Number of active and substantial collaboration agreements | CR_PR_V3 | Naranjo et al (2013) p. 48 | Metric | |
| The search for long-term relationships prevails | CR_PR_V4 | Román et al (2013) p. 361 | Likert Scale | |
| Relationship with customers | Our company has a broad portfolio of frequent clients | CE_RC_V1 | Martín et al (2009) p. 100 | Likert Scale |
| Customer relationships are usually longterm | CE_RC_V2 | Martín et al (2009) p. 100 | Likert Scale | |
| We work together with our customers to develop solutions | CE_RC_V3 | Delgado et al (2011) p. 219 | Likert Scale | |
| Percentage of ideas contributed by clients | CE_RC_V4 | Own elaboration | Percentage | |
| Relationship with suppliers | The relationships of our company with suppliers are generally long-term | CE_RP_V1 | Martín et al (2009) p 109 | Likert Scale |
| We work together with our suppliers to solve problems | CE_RP_V2 | Martín et al (2009) p. 109 | Likert Scale | |
| Ideas provided by suppliers | CE_RP_V3 | Naranjo et al (2013) p. 48 | Metric |
Source: own elaboration taking into account the concepts of the cited authors
Table 4 Indicators of Value Generation (VG)
| Dimension | Survey Questions | Name of the indicator | Source | Type of Scale |
|---|---|---|---|---|
| Sales | Your company exported in 2015 | GV-V1 | Own elaboration | Dichotomous question |
| Revenue from sales per employee in 2015 (Total sales $/total employees) | GV-V2 | Own elaboration | Ordinal question | |
| Innovation | Number of new products developed between 2013 and 2015 | GV-V3 | OCDE (2005). pp. 34-37 | Ratio scale |
| Number of new services developed between 2013 and 2015 | GV_V4 | OCDE (2005). pp. 34-37 | Ratio scale | |
| Number of significant improvements in products developed between 2013 and 2015 | GV_V5 | OCDE (2005). pp. 34-37 | Ratio scale | |
| Number of significant improvements in services developed between 2013 and 2015 | GV_V6 | OCDE (2005). pp. 34-37 | Ratio scale | |
| Number of new marketing channels developed between 2013 and 2015 | GV_V7 | OCDE (2005). pp. 34-37 | Ratio scale | |
| Employees | Number of employees between 2013 and 2015 | GV_V8 | Own elaboration | Ordinal scale |
Source: own elaboration taking into account the concepts of the cited authors
Population and Sample
As mentioned above, the companies under study are the companies of Parquesoft Colombia. The technical datasheet of the sample appears in Table 5.
Table 5 Technical datasheet of the sample
| Date of survey application | February 2nd to April 14th, 2016 |
| Population | 140 companies |
| Size of the sample | 80 valid instruments |
| Data collection tool | Non-continuous and active survey |
| Sampling procedure | The questionnaire was sent to all companies in the population, through a link to Google Forms |
| Means of implementation of the survey | Email (sending link) and phone contact |
| Survey completed by: | Legal representative of the company |
| Software used to collect and analyze information | Google Forms SmartPLS 2.0 |
Source: own elaboration
Methodology for the analysis of the information
When reviewing the existing literature on the theoretical models that analyze the IC, it is evident that each one presents different structures, offers different results (financial results, indicators, value), uses different analysis variables, and depends on the specific conditions of the company to be valued. Therefore, it is possible to conclude that there is no single method of valuation or analysis of the IC.
Similarly, the literature review identified the existence of a series of authors who use other methodological tools to identify the relationships between IC components and the variables to be studied. The tools identified are multivalent statistical analysis techniques (second generation statistical techniques), including Structural Equation Modeling (SEM). Barletta, Pereira, Yoguel, and Robert (2013); Ospina, Berrio, Bedoya, Cárdenas, and Muñoz (2013); Motta, Zavaleta, Llinás, and Luque (2013).
To analyze the research data and validate the proposed model, SEMs will be used. SEMs are multivariate techniques that combine aspects of multiple regression (examining dependency relationships) and factor analysis (representing immeasurable concepts - factors - with multiple variables) to estimate a series of simultaneously interrelated dependency relationships. Cepeda, G. (2004). Pp.4
SEM can be analyzed through two statistical techniques. For this research, it was chosen to use the analysis technique based on components or Partial Least Squares (PLS), due to being considering the appropriate one according to the characteristics of the variables of the research. The SmartPLS 2.0 software was used for the analysis.
Evaluation of the results of the research
The analyzed data come from the surveys carried out to the companies; these were organized and tabulated according to the requirements of the SmartPLS 2.0 software to be analyzed. To validate the model through the PLS technique of SEM in the first stage, it is necessary to evaluate the measurement models (indicators), which consists of determining whether the theoretical concepts are correctly measured through the observed variables. This evaluation has the purpose of demonstrating the solidity of the measurement instrument (survey) used.
The evaluation of the structural model is made in the second stage. This evaluation consists of determining how the empirical information obtained with the research supports the theoretical concepts, defining if it is possible to confirm the theory to examine the predictive capacities of the model and the relation between its constructs.
Table 6 presents the evaluations made in each of the stages and the expected results.
Table 6 Analyses applied in the SEM
| Stage | Procedure | Valid values |
|---|---|---|
| Stage 1: Assessment of the validity and reliability of the model | Reliability of internal consistency | Cronbach’s alpha > 0.7 Compound reliability (ρc) >0.7 |
| Individual item reliability | Charges λ >= 0.5 | |
| Convergent validity | Average Variance Extracted > 0.5). | |
| Validity Discriminant | Cross-load criterion. | |
| Stage 2: Validation of the structural model | Determination Coefficient R² | Identifies values of 0.67, 0.33, and 0.19, denoted as substantial, moderate, and weak, respectively. |
| Path Coefficients β | Path coefficients that reach at least a value of 0.2 and are ideal if they are higher than 0.3 | |
| Bootstrapping Analysis | Allows the Student “t” analysis to be executed for the significance of the relationships of the path model. Indicators whose Student “t” is higher than 1.96 are significant. | |
| Q² Value | Values of 0.02, 0.15, and 0.35 reveal small, medium, or high predictive relevance, respectively. |
Source: own elaboration taking into account the concepts of Cepeda and Roldán, (2004)
Figure 2 presents the nomogram of the model:
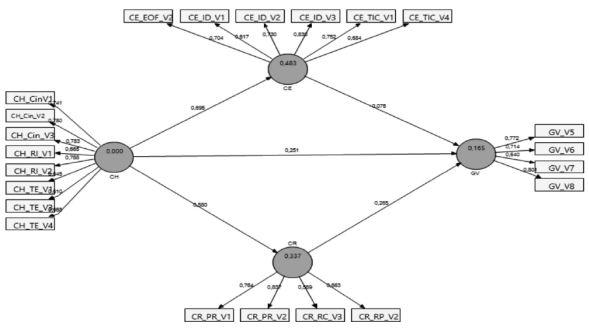
Source: own elaboration using SmartPLS 2.0. Ringle, Wende, and Will (2005)
Figure 2 Nomogram with individual loads
Assessment of the validity and reliability of the model
Reliability of internal consistency: As can be seen in Table 7, the compound reliability of each of the constructs had a value greater than 0.7, which shows that the indicators that make up each of these factors are related to each other. In Table 7, the constructs SC, HC, and VG show Cronbach’s alpha values higher than the accepted minimum value, meaning that the indicators of each of them are related to their respective construct and provide validity to each of them. The RC variable had a value of 0.68, less than the expected minimum; for research purposes and given that in the analysis of internal reliability it obtained an acceptable value, it is not eliminated from the research, which also ensures preserving the validity of content.
Table 7 Reliability and validity analysis
| Variable or construct | Convergent Validity (AVE) | Reliability of internal consistency | |
|---|---|---|---|
| Compound reliability | Cronbach’s alpha | ||
| SC | 0.5218 | 0.8666 | 0.81 |
| HC | 0.5088 | 0.8915 | 0.86 |
| RC | 0.5119 | 0.8043 | 0.68 |
| VG | 0.5390 | 0.8228 | 0.73 |
Source: own elaboration using SmartPLS 2.0. Ringle, Wende, and Will (2005)
Convergent validity: In Table 7, all constructs have an AVE value greater than 0.5, which means that the different items intended to measure a concept or construct indeed measure the same. So, the adjustment of these items is significant, and they are highly correlated.
Individual reliability of the item: In Figure 2, the values in the arrows pointing to the indicators (tables) are the loads λ, which give values greater than 0.5. The indicators in Figure 2 are less than the indicators presented in Tables 1, 2, 3, and 4, since a filtering of indicators was made, eliminating those that had a load λ of less than 0.5. A load greater than 0.5 means that this item contributes significantly to the construction of the latent variable.
Discriminant validity: Analyzing the cross-loads result (see Table 8 and 9) it was obtained that each indicator presents a higher correlation with its latent variable than with others; this indicates the extent that a given construct is different from other constructs. The square root of AVE of each construct is higher than the correlation between them; therefore, it is possible to conclude that the model meets the criterion of discriminant validity and that the latent variables are unmistakably differentiated.
Table 8 Square root of AVE
| Construct | Square root of AVE |
|---|---|
| SC | 0.7224 |
| HC | 0.7133 |
| RC | 0.7155 |
| VG | 0.7342 |
Source: own elaboration using SmartPLS 2.0. Ringle, Wende, and Will (2005)
Tabla 9 Correlations between constructs. Fornell-Larcker criterion
| SC | HC | RC | VG | |
|---|---|---|---|---|
| SC | 0.7224 | |||
| HC | 0.6953 | 0.7133 | ||
| RC | 0.6055 | 0.5802 | 0.7155 | |
| VG | 0.2587 | 0.3517 | 0.3646 | 0.7342 |
Source: own elaboration using SmartPLS 2.0. Ringle, Wende, and Will (2005)
From the results shown in this section, it is possible to conclude that the scales analyzed to measure the dimensions of human capital, structural capital, relational capital, and value generation are valid and reliable.
Validation of the structural model
R² coefficient: The values that appear within the circles (endogenous latent variables) (Figure 2) are the R² value, and as can be observed they have values greater than 0.1, which indicates that the model has predictive capacity on the endogenous variables of it.
Model path coefficients are the values that are in the arrows that join the latent variables (circles Figure 2), the values below 0.2 mean that the exogenous variable does not have a significant impact on the endogenous variable.
Table 9 displays the results of the Bootstrapping analysis.
Table 9 Bootstrapping análisis
| Relation between constructs | Standard error | T-Student | Level of significance |
|---|---|---|---|
| SC -> VG | 0.1958 | 0.3906 | Not significant |
| HC -> SC | 0.0547 | 12.7005 | Significant |
| HC -> RC | 0.0712 | 8.1552 | Significant |
| HC -> VG | 0.1248 | 2.0113 | Significant |
| RC -> VG | 0.1285 | 2.0647 | Significant |
Source: own elaboration using SmartPLS 2.0. Ringle, Wende, and Will (2005)
As seen in the table above, the bootstrapping analysis for the model confirms the result given by the path ß coefficients, where the relationship between the structural capital construct and value generation is not significant.
Q² value: this value measures the predictive capacity of the model, Table 9 shows that the Q² values of endogenous constructs are higher than zero, which indicates the predictive capacity of the model.
Table 10 Q² value
| Total | SSO | SSE | Q² = 1-SSE/SSO |
|---|---|---|---|
| SC | 480 | 363.12 | 0.2435 |
| HC | 640 | 640.00 | |
| RC | 320 | 268.59 | 0.1606 |
| VG | 320 | 293.75 | 0.0820 |
Source: own elaboration using SmartPLS 2.0. Ringle, Wende, and Will (2005)
With the results presented in this section, it can be stated that the empirical information obtained with the research supports the theoretical concepts, the model has predictive capacity, and there is a relationship between its constructs, in other words, they have statistical significance.
Qualitative analysis of results
The results of the evaluation of the model were presented in the previous section. In this section, a qualitative interpretative analysis of each of these results will be made to validate the proposed model.
Human Capital: To measure human capital, given that it is an exogenous latent variable, it was initially proposed to measure it using 14 indicators distributed in four dimensions (see Table 1). However, after evaluating the measurement models in which the robustness of the measurement instrument used is demonstrated, six indicators were eliminated. It is important to point out that all the indicators related to the education and training dimension were eliminated, a situation that raises concern regarding the strength of the HC since the training and knowledge of the employees are fundamental elements in this construct. As a result, it is possible to infer either that the companies are not allocating resources and efforts, or that the resources allocated are not generating the necessary impact.
The indicators that contribute most to the elaboration of the indicator are those related to the culture of innovation dimension, as they have the highest loads, all higher than 0.7 (see Graph 2). These factors reaffirm the nature of the companies in the Park, companies based on innovation in their products, processes, and services.
Second in importance, as regards the contribution of the HC construction, is the dimension of remuneration and incentives, highlighting the degree of satisfaction on the part of the company employees.
As for the third and last component, teamwork, all indicators have loads higher than 0.6, being acceptable values, but not optimal ones. It leads to the idea that teamwork spaces should be encouraged and improved because it is there that knowledge is created and transferred, and where innovation processes take place.
Structural Capital: Structural capital is an endogenous latent variable, which depends on the human capital construct and in turn, feeds the value generation construct, as defined in the model.
To measure the structural capital, nine indicators were initially proposed; however, after carrying out an analysis of the individual reliability of each item, three indicators were eliminated, two belonging to the information and communication technologies (ICT) dimension and one to the flexible organizational structure dimension.
The dimension that contributes most to this construct is “research and development”, which ratifies the basis of the companies of the park, highlighting mainly the existence of spaces, processes, and procedures for researching and developing ideas. This dimension is reinforced and ratified with the “culture of innovation” dimension of the human capital construct, in which it also plays an important role.
This construct, as shown by the SEM analysis presented, does not help explain value generation within the companies of the park.
Relational Capital: It is the component of the IC that contributes the most and explains the value generation construct. For this construct, 12 indicators were initially proposed, which were left in model 4 (indicators).
In this case, the dimension that stands out most is that of “participation in networks”, as it presents the highest burdens in terms of its contribution to the construction, confirming that the number of links that companies have is positively related to the level of value generation; this increases the possibilities of opening new markets and improving the competitive performance of companies.
While the “relationship with customers” dimension contributes, this is done weakly, a situation that is corroborated by the fact that companies have mostly business models focused on developing their products and services.
Value Generation: For this construct, eight indicators were initially proposed, leaving four indicators of the dimensions of innovation and employees. It is important to emphasize that these results validate one of the fundamental characteristics of the TBC software, which is precisely innovation.
Conclusions
The research focused on the study of the IC, which, as argued, is composed of three highly interrelated elements: HC, SC, and RC. HC is the base that supports the other capitals and is, therefore, the base of the IC. Furthermore, IC plays a fundamental role in the current knowledge economy, as it is an asset that contributes significantly to the processes of generating value within organizations.
SEM made it possible to identify both the causal relationships between the components of the intellectual capital of the companies under study and the value generation within them since it facilitated the articulation of theory and empirical data obtained.
The proposed model states that the components of the IC-in this case, HC, SC, and RC- contribute positively with value generation within technology-based companies. This model was empirically validated since the multivariate statistical analysis carried out indicated that 8.83% of the value generation construct is explained and constructed by the human capital, and 9.66% of the same by the relational capital. Conversely, the structural capital does not positively affect value generation.
One of the main contributions of this work was to structure the CI capital coherently for the companies under study through the identification of their components and the relationship between them, proposing a series of indicators that allowed them to be measured. Another significant contribution was to determine the causal relations of the components of the IC with value generation.
As a general conclusion, the proposed model proves the theory and has the predictive capacity of the behavior of the endogenous constructs of the research, allowing to determine that the components of the HC and RC of the IC, contribute positively with value generation. It is relevant to point out that they only explain 18.49% of the value generated in the companies of the park. This result allows concluding that there are other series of elements, not considered in the research, that also contribute to VG. The research allowed contrasting the strategic role that IC plays in obtaining value in companies. This model allows the companies in the park to realize that the efforts made to strengthen IC have an impact on value generation.
Referencias
Alama, E. M. (2009). Capital intelectual y resultados empresariales en las empresas de servicios profesionales de España. Tesis de la Universidad Complutense de Madrid, Facultad de Ciencias Económicas y Empresariales, Departamento de Organización de Empresas. [ Links ]
Álvarez, C. (2010). Hacia un nuevo modelo de valoración de intangibles. Trabajo de grado Doctorado, Ciencias de la Comunicación, Universitat Jaume. Castellón. [ Links ]
Barletta, F., Pereira, M., Yoguel, G., y Robert, V. (2013). Argentina: Dinámica reciente del sector de software y servicios informáticos. Revista CEPAL. https://doi.org/10.18356/2813fe44-es [ Links ]
Bontis, N., Know, W., y Richardson, S. (2000). Intellectual capital and business performance in Malaysian industries. Journal of Intelectual Capital, 1(1), pp 85-100. https://doi.org/10.1108/14691930010324188 [ Links ]
Brooking, A. (1996). Intellectual Capital: Core Asset for the Third Millennium Enterprise. London: International Thomson Business Press. https://doi.org/10.1016/S0024-6301(97)80917-X [ Links ]
Bueno, E., Del Real, H., Fernández, P., Longo, M., Merino, C., Murcia, C. y Salmador, M. (2011). Modelo Intellectus de Medición, gestión e información del capital intelectual. (Nueva versión actualizada). Universidad Autónoma de Madrid. [ Links ]
Camisón, Z. C., Lapiedra, A. R., Segarra, M. y Boronat, N. M. (2003). Marco conceptual de la relación entre innovación y tamaño organizativo. Revista Madrid, No. 9, octubre-noviembre. http://www.madrimasd.org/revista/revista19/tribuna/tribuna1.asp. [ Links ]
Cañibano, L. García-Ayuso, y M. Sánchez, P. (1999). La relevancia de los intangibles para la valoración y la gestión de empresas: revisión de la literatura (1). Revista Española de Financiación y Contabilidad, 100, 17-88. [ Links ]
Casanueva, C., Palacios, M. y Val, T. (2007). Inversión en Nuevas empresas de base Tecnológica en la comunidad de Madrid, [en línea]. Madrid. Recuperado 9 de septiembre de 2011, de Recuperado 9 de septiembre de 2011, de http://www.ingor.etssi.upm.es/administración.html [ Links ]
Cepeda, G.; Roldán, J.L. (2004). “Aplicando en la Práctica la Técnica PLS en la Administración de Empresas”, Congreso de la ACEDE, septiembre 19, 20 y 21, Murcia, España. [ Links ]
Colciencias (2008). Las empresas de base tecnológica e innovadoras y su relación con los fondos de inversión en capital. Convenio BID-Colciencias-Programa Finbatec. Bogotá: Javegraf. [ Links ]
Delgado, M., Martín de Castro, G., Navas, J. E., y Cruz, J. (2011). Capital social, capital relacional e innovación tecnológica. Una aplicación al sector manufacturero español de alta y media-alta tecnología. Cuadernos de Economía y Dirección de la Empresa, 14(4), 207-221. https://doi.org/10.1016/j.cede.2011.04.001 [ Links ]
Edvinsson, L. y Malone, M. S. (1998). El capital intelectual: Cómo identificar y calcular el valor de los recursos intangibles de su empresa. Colombia: Editorial Norma S.A. [ Links ]
Estrada, S. y Dutrénit, G. (2007). Gestión del conocimiento en Pymes y desempeño competitivo. Engevista, 9(2), pp. 129-148. https://doi.org/10.22409/engevista.v9i2.203 [ Links ]
Kaplan, R. y Norton, D. (2008). Mapas Estratégicos: convirtiendo activos intangibles, en resultados tangibles. Barcelona: Ediciones Gestión 2000. [ Links ]
Lanzas, A. (2016). Modelo para medir el impacto del capital humano en los resultados de la innovación en un grupo de empresas de base tecnológica de software, Ponencia, XXI Congreso Internacional de Contaduría, Administración e Informática, Universidad Nacional Autónoma de México. [ Links ]
Martín de Castro, G; Alama, E; Navas, J; López, P. (2009). El papel del capital intelectual en la innovación tecnológica. Una aplicación a las empresas de servicios profesionales de España. Cuadernos de Economía y Dirección de la Empresa, (40), pp. 83-109. https://doi.org/10.1016/S1138-5758(09)70043-X [ Links ]
Meljem, S., Revah, B., Cruz, Y. y Romero, N. (2010). Valuación y Reconocimiento de Activos Intangibles. Un enfoque estratégico. México: IMEF, Price Waterhouse Coopers e ITAM. [ Links ]
Merritt, H. (2012). Las empresas mexicanas de base tecnológica y sus capacidades de innovación: una propuesta metodológica. Trayectorias, Año 14, Núm. 33-34, Julio 2011-junio 2012, 27-50. [ Links ]
Motta, J. J., Zavaleta, L., Llinás, I., y Luque, L. (2013). Procesos de innovación y competencias de los recursos humanos en la industria del software en Argentina. Revista Iberoamericana de Ciencia, Tecnología y Sociedad, 24(8), 145-145. [ Links ]
Nonaka, I. (2007). La empresa creadora de conocimiento. Harvard Business Review. Julio 2007. Disponible https://bschogardecristo.files.wordpress.com/2007/08/nonaka_red.pdf [ Links ]
Naranjo, C., Rubio, J., Salazar, L., Robledo, A.., & Duque, J. (2013). Indicadores de capital intelectual. Memorias, 11(19), 39-51. [ Links ]
Nevado, D. y López, V. (2013). Gestione y controle el valor integral de su empresa. Análisis integral: modelos, informes financieros y capital intelectual para rediseñar la estrategia. Madrid: Ediciones Díaz de Santo. [ Links ]
Nevado, D. y López, V. (2004). Una herramienta de gestión de intangibles ocultos mediante técnicas econométricas. Método y aplicación. Revista Contabilidad y Dirección, 1, pp. 163-182. [ Links ]
OCDE (2005) Oslo Manual: Guidelines for Collecting and Interpreting Innovation, 3rd Edition. OECD Publications, Paris. [ Links ]
Ochoa, M., Prieto, M. y Santidrián, A. (2010) Estado actual de los modelos de capital intelectual y su impacto en la creación de valor en empresas de Castilla y León. España: Consejo Económico y Social de Castilla y León. [ Links ]
Ospina, S. T., Berrío, F. G., Bedoya, I. B., Cárdenas, M. V., y Muñoz, J. E. (2013). Medición de capital intelectual usando estadística multivariada. Revista Ingeniería Industrial, 1(1), 77-84. [ Links ]
Ordoñez De Pablos, P. (2004). El capital estructural organizativo como fuente de competitividad empresarial: un estudio de indicadores. España. Economía industrial, (357), Pp.131-140. [ Links ]
Padilla, L. (2015). Barreras para la innovación en las pymes colombianas de base tecnológica: una mirada desde la gestión. Universidad Militar Nueva Granada. [ Links ]
Ringle, C., Wende, S, y Will, A. (2005). SmartPLS 2.0.M3. Hamburg: SmartPLS. Retrieved from http://www.smartpls.com [ Links ]
Román, R., Gómez, A. y Simida, A. (2013). El capital social organizacional de la pequeña empresa innovadora. Un ensayo de medición en las ciudades de Cali y Medellín. Estudios Gerenciales, 29, p.356-367. https://doi.org/10.1016/j.estger.2013.09.010 [ Links ]
Ross, J., et al (1997). Capital intelectual: el valor intangible de la empresa. Buenos Aires: Ediciones Paidós Ibérica. [ Links ]
Salazar, E. M. A. (2008). Capital intelectual y resultados empresariales en las empresas de servicios profesionales de España (Doctoral dissertation, Universidad Complutense de Madrid) [ Links ]
Sánchez, A., Melián, A. y Hormiga, E. (2007). El concepto del Capital Intelectual y sus Dimensiones. Investigaciones Europeas de Dirección y Economía de la Empresa, 13, (2), Pp. 97-111. [ Links ]
Santa, L. y Salas, M. (2014). El capital intelectual como esquema de valor en el futuro. Revista Estrategias, 10, (19), pp. 25-31. https://doi.org/10.16925/es.v10i19.518 [ Links ]
Santos-Rodrigues, H., Dorrego, P. F., y Jardón, C. F. (2011). El capital estructural y la capacidad innovadora de la empresa. Investigaciones Europeas de Dirección y Economía de la Empresa, 17(3), 69-89. https://doi. org/10.1016/s1135-2523(12)60121-x [ Links ]
Sveiby, K. (2007). Methods for measuring intangible assets. Documento disponible en internet http://www.sveiby.com [ Links ]
Torres, L. (2012). La nueva dependencia: los activos intangibles. Capital intelectual, (15), pp. 14-35 [ Links ]
Received: February 02, 2018; Accepted: August 24, 2018
 Este es un artículo publicado en acceso abierto bajo una licencia Creative Commons
