


Serviços Personalizados
Journal
Artigo
 texto em
  Inglês (pdf)
 Artigo em XML
 Referências do artigo
 Enviar este artigo por email
Indicadores
-
 Citado por SciELO
 -
 Acessos
Links relacionados
-
 Similares em
SciELO
Similares em
SciELO
Compartilhar

 Permalink
Contaduría y administración
versão impressa ISSN 0186-1042
Contad. Adm vol.65 no.1 Ciudad de México Jan./Mar. 2020 Epub 24-Abr-2020
https://doi.org/10.22201/fca.24488410e.2019.1790
Articles
Training, average wages and taxes as factors that explain the attitude toward job regulation in contexts of informality
1CENTRUM Católica Graduate Business School Pontificia, Universidad Católica del Perú, Perú
2Universidad San Martín de Porres, Perú
The hiring of illegitimate staff is a widespread problem across small and midsize enterprises, affecting the wages of those working within the bounds of the law. For that reason, the objective of the study was to validate a model that explains the attitudes towards labor regulation. Two hypotheses were tested: a) professional training mediates the relationship between educational level and attitude toward labor regulation; b) average wage and attitude toward tax regulation predict attitude towards labor regulation. It is a cross-sectional study. The conceptual model of exploratory nature works with two data collection tools: the National Survey of Enterprises (ENE) 2015 and structured interviews applied to Peruvian SME owners. For ENE 2015 it was used one-step stratified sampling. The quantitative analysis was carried out with PLS-SEM (Partial Least Squares - Structural Equation Modeling), a technique for structural modeling that maximizes the variance; for the qualitative analysis, the terMEXt program was used. The proposed causal routes for the two hypotheses explained a moderately high proportion of the two variables belonging to the conceptual model, training received (R2 = 0.396) and attitude toward labor regulation (R2 = 0.448). This study contributes to understanding the informal culture within SMEs. The application of this approach in other sectors is recommended to improve attitudes towards labor reforms.
Keywords: Professional training; Labor informality; Tax regulation; Labor regulation; Adanco
JEL code: C55; J46; M48
La informalidad en la gestión del personal es un problema extendido en las pequeñas y microempresas, afectando los salarios de los trabajadores. Por ello, el objetivo del estudio fue validar un modelo que explica la actitud hacia la regulación laboral. Las hipótesis fueron: a) la capacitación profesional recibida media la relación entre nivel educativo y actitud hacia la regulación laboral; b) la remuneración promedio y la actitud hacia la regulación tributaria predicen la actitud hacia la regulación laboral. Se trata de un estudio de corte transversal. El modelo conceptual de naturaleza exploratoria emplea dos instrumentos de recolección de datos: la Encuesta Nacional de Empresas (ENE) 2015 y entrevistas estructuradas a dueños de MYPES peruanas. Para la ENE 2015 se empleó un muestreo aleatorio estratificado de una etapa. El análisis cuantitativo se realizó con PLS-SEM (Ecuaciones Estructurales con Mínimos Cuadrados Parciales), una técnica de modelamiento estructural que maximiza la varianza; para el análisis cualitativo se empleó el terMEXt. Las rutas causales propuestas para las dos hipótesis explicaron una proporción moderadamente alta de las dos variables del modelo conceptual, capacitación recibida (R2 = 0.396) y actitud hacia la regulación laboral (R2 = 0.448). Este estudio ayuda a comprender la cultura informal en las MYPES y presenta un enfoque aplicable a sectores industriales o comerciales.
Palabras clave: Capacitación laboral; Informalidad laboral; Regulación tributaria; Regulación laboral; Adanco
Código JEL: C55; J46; M48
Introduction
Jobs and private entrepreneurial activity drive the development of a country. In the case of Peru, whose economic regime is the social market economy, the private entrepreneurial structure has not been able to incorporate formal Small and Micro Enterprises (SMEs), whether by facilitating their formalization process or by sharing effective management practices. This represents a weakness for the private sector and for the economy in general, given that this sector requires preferential attention in State policies, as medium, small, and micro enterprises do not have a solid base to enter into the production, marketing, and finance processes that lead to providing national or foreign consumers quality products with added value and with constant innovation (Abusada, 2017; Belapatiño et al., 2017).
To put this into perspective, SMEs in Peru generate 21.6% of the Gross Domestic Product (GDP); however, only 17% of them are formalized, while the remaining 83% operate submerged within the informal economy. Regarding employment generation, the SME sector occupies 7.7 million workers, which is equivalent to 45% of the Economically Active Population (EAP) of Peru. That is to say, this sector is one of the main sources of employment in Peru. However, it is not enough to be employed, since by being within the informal economy many of these workers do not have social benefits or health insurance when working in companies that are not formalized (INEI, 2014; Saavedra, 2016).
The formalization of SMEs increases their value, taking advantage of the benefits of the market and strengthening the decision of the entrepreneurs, the authorities, and all the interested parties by complying with the provisions. This is possible because formalization is a dynamic behavior that is in constant change; this process is much more than documents and authorizations. After the initial stage, which tends to represent a high cost, comes the time for management, it is then that these companies find a market that promotes or contributes to informality. In this manner, informality also represents a behavior that has its own synergy, it is a reality that has entered into the mental schemes of citizens, and it is so strong that many times it prevails over the formal management of a company. Entrepreneurial formalization, informality, and the management of SMEs show a series of problems that require an integral solution, with the support of key actors of the economy, because economic development relies on an integral (involving all sectors) and long-term approach that allows overcoming, at mid-term, the high indices of informality in general and in the management of SMEs.
A first step to achieve this vision is to understand the personnel management practices that occur within the SMEs, that is, the type of human resources management adopted by the owners of the SMEs, since they decide whether their company begins to operate (or continues to operate) in informality or if it integrates into the formal economy. To understand how informal practices manifest in the management of the personnel who work in SMEs, the manner in which informality has been addressed in the management of SMEs is examined. Subsequently, a few studies on job informality are reviewed for the case of Peru and other Latin American countries.
Informality in the personnel management of SMEs
Different studies have shown how informal practices manifest when managing an SME, ranging from the failure to deliver payment invoices (or altering the figures in them) to the hiring of temporary personnel, without assuming labor costs such as social security, bonus for time of services, or the omission in the statement of withheld taxes (Fuller-Love and Scapens, 1997; Kotey and Folker, 2007; Voss and Brettel, 2013). In this regard, a first study examined the effect of incentives and wage benefits on the productivity of the workers of small and medium-sized companies, for which a case study was used. The company analyzed was a small shipyard with an approximate turnover between £1.5 and £2 million per year, employing around 30 to 40 workers. The bonus was assigned per hour worked and it was considered whether the worker fulfilled all the tasks above the expected performance level. If the performance of the worker was below the expected, the weekly bonus for 40 hours worked was £10 less than that of the workers that had performed above the expected. The results showed that while there was resistance to the change within the company studied, it was possible to identify the factors that reduce the negative behaviors towards formal and structured management systems, such as planning short and mid-term actions, identifying the tasks to be completed or recording such tasks (Fuller-Love and Scapens, 1997).
A second study focused on the informal practices in the management of SMEs and analyzed the relationship between the type of training for the workers (formal vs informal) and the size of the company (medium vs small), as well as the relationship between said training and the type of company (family-owned vs not family-owned). The researchers used data from a longitudinal study for the fiscal years 1994-1995 and 1997-1998 and contrasted the hypotheses using the multivariate analysis of variance (MANOVA). The findings confirmed that the training in the work center is the predominant training method in small and medium companies. While in smaller companies the informal training method prevails, once the size of the company increases, the adoption of formal methods increases rapidly, but this increase stabilizes when it reaches a certain point. By analyzing the reasons that lead a small and medium entrepreneur to adopt informal practices in personnel management, the researchers maintain that said behavior is consistent with the strategic direction of the small entrepreneurs, who are conscious of the fact that training generates competitive advantages by having trained workers, but they opt for the informal scheme given that said benefits become palpable in the long-term, as small companies are worried about surviving in the short-term (Kotey and Folker, 2007). In a more recent study, it was explored how personnel management systems influence the effectivity of formal and informal management controls within small companies. To this end, the researchers examined the performance of 317 small and medium-sized companies, testing a conceptual model based on the resource dependence theory applied to management control. The findings showed that the control mechanisms have a strong effect on the performance of small and medium companies if the company places more emphasis on the formal practices of personnel management (Voss and Brettel, 2013).
After a brief review of informality in the personnel management of SMEs, both in developed countries and in emerging economies, this study addresses one of the facets that this type of human resource management manifests: the informal economy within SMEs.
Studies on informal employment in Latin America and Peru
Although various studies have been published on the problem of informal employment in Latin America, most of said works are theoretical reviews, and when these are backed by data, their approach is basically descriptive, that is, they are not translated into conceptual models that explain how informality operates in the economies and companies. For a theoretical review of informal employment, the studies by Arellano (2012) and Jiménez (2012) can be consulted.
Among the Latin American studies that explain informal employment based on a model of associated factors, the work of Uribe García et al. (2008) stands out, who worked with data from the Continuous Household Survey, applied between 2001 and 2006 on the 13 largest metropolitan areas of Colombia. The authors of said study utilized a bivariate probit model to identify the factors that increase the probability of having an informal job, be underemployed, or have an underemployed informal job. According to the results of the logistic regression, the factors that increase the probability of having an informal job were working in the commercial, restaurant, or hotel sectors (a 21% increase) or working in the transport sector (a 14% increase). On the other hand, working in the electricity, gas, or water sectors, or in the agricultural or mining sectors reduced the probability of having an informal job by 41% and 10%, respectively. It should be noted that individual factors such as being male, being married, or the level of education had a reduced effect on the probability of having an informal job by 5%, 4%, and 3%, respectively.
Concerning studies on informal employment in Peru, from a management, economic, or financial perspective, no research was found published in journals indexed in Scopus, SciELO, or Redalyc; only a few undergraduate and graduate theses were found (Arela, 2016; Bello, 2010; Cuba, 2017; Nieves, 2015; Vilca, 2013). A first aspect that ought to be highlighted is that all of the studies were carried out in different regions of the country, but not in Lima, the capital, with a focus on the regions of La Libertad and Lambayeque.
A first study analyzed the causes that lead the micro-entrepreneur to opt for informal employment, for which 635 informal traders from the Mercado Central de Chiclayo were surveyed, determining how extensive informality is in said market (Bello, 2010). The other two studies were carried out in the city of Trujillo. The first of them examined the effect of informal employment on the motivation of 103 workers of a shopping mall (Vilca, 2013). Concerning the working conditions, 72% of employees worked in their company between six months and a year, while 85% reported not having a work contract or benefits, and almost 95% stated working more than 8 hours a day. Regarding motivational conditions, more than 95% indicated that their wages covered few (or almost none) of their basic needs, which explains why 90% of those surveyed were looking for a different job.
In the second study carried out in the city of Trujillo, the owners of 20 printing houses were surveyed, who responded a structured questionnaire comprised of 18 questions (Nieves, 2015). Of these, 90% were not in agreeance to include workers in the payroll of the company, 80% stated not agreeing with wages being above the minimum living wage, and 75% disagreed with workers enjoying their legal benefits. The other answers of the micro-entrepreneurs reveal the same negative behavior towards the labor rights of the workers or the economic benefits that should correspond to them according to the law. In general, this has the same descriptive approach of the substantiated theses in Peru on informal employment from a management, economic, and financial perspective.
With the exception of the study that identified the factors that predict, in a statistical sense, the fact of having an informal job, almost all the studies on informal employment in Latin American reported in academic literature have a clearly descriptive character. This confirmation limits the possibility of finding integral explanations on informal employment that allow developing and implementing formalization programs that are attractive for micro-entrepreneurs.
From a broader perspective, according to the theory of planned behavior by Icek Ajzen (1991), changes in behavior are conditioned by the behavioral intention, which is explained by the behaviors and perceptions that the person has towards the object of change. Of these, behavior has greater incidence on the intent that becomes the precursor of the desired conduct. For this reason, this study focuses on the behaviors towards informal employment, because it is considered that their better understanding will allow designing more effective incentive programs to promote the adoption of formal human resource management practices. For this reason, below is a review of the studies that have focus on one of the facets of informal employment: the behavior towards labor regulation, because it is understood that behavior is one of the elements that explains the decision of SME owners to begin (or maintain) different informal employment mechanisms for their employees.
Factors that explain the behavior towards labor regulation
The review of the literature allowed identifying two studies that explain the behavior towards labor regulation based on a set of individual and entrepreneurial factors (Kellough and Nigro, 2005; Svalund et al., 2016), as well as of variables at an individual and at a country level (Hipp and Anderson, 2015). The first of them analyzed the behaviors of employees in the public sector towards the labor reforms undertaken by the state of Georgia, USA, during the 1990s. While the authors do speak of the perception of employees towards said labor reforms, six-point Likert scales (1 = Completely disagree, 6 = Completely agree) were used for data collection. That is, they indeed analyzed the behaviors towards labor regulation. The results of the linear regression analysis show that the education of the employees had a negative effect on the behavior towards labor regulation: “the civil service reform act has managed to get workers to be more productive and faster in their responses” (β = -0.141, p<0.001); “under the authority provided by the civil service reform act, my office can quickly hire highly qualified workers” (β = -0.083, p<0.01).
The second study examines the behaviors towards labor regulation in Finland, Norway, and Sweden (Svalund et al., 2016); in said work, the researchers analyzed whether there were differences between the behavior of the nationals and the behavior of the immigrants. In theory, nationals preferred a stricter labor legislation that had strong controls, while immigrants preferred a more flexible legislation. To measure the behaviors towards labor regulation, it was first explained to the workers of Norway and Sweden that current legislation limits the ability of employers to fire their workers, then they were asked what they thought of said labor regulation. There were three answer options: a) it should be easy for employers to fire their workers; b) the current laws are good; and c) it should be difficult for employers to fire their workers.
In the case of Finland, the questions and answer options were presented differently. Given that a logistic, binomial regression model was used, the questions were grouped in dichotomous categories for the analysis. The likelihood ratio (LR) of having a high remuneration increased the probability of agreeing with the easy firing of workers in Sweden, compared with Norway and Finland (LR = 3.58, p<0.001 and LR = 5.79, p<0.001, respectively). Concerning the level of education, only in Sweden did having higher education increase the probability of agreeing with the easy firing of workers (LR = 2.22, p<0.05, when compared with Finland).
In a multilevel study carried out in 20 member countries of the OECD, the researchers analyzed the factors associated with the behavior towards the flexibilization of the labor conditions, assuming that said labor flexibility allows reducing unemployment. Flexibility was estimated through an additive scale that included four items: accepting a job with lower pay; accepting a temporary job; accepting a job in a very distant place; and learning new skills. According to the findings, at an individual level, the variables with the highest negative association (p < 0.01) were: having an office job (β = -0.400), being female with children (β = -0.356), and relationship flexibility (β = -0.213). On the other hand, the variables that had the highest positive association (p < 0.001) with behavior towards the flexibility of the working conditions were: having a supervisory position (β = 0.437), the length of the working day (β = 0.418), and job satisfaction (β = 0.179). Concerning the factors associated with labor flexibility at the country level, the unemployment benefits showed a positive association (γ = 1.349, p < 0.01), while the protection measures against lay off had a negative relationship (γ = -1.644, p < 0.01).
Conceptual model, hypothesis, and research question
Even when the previously developed review of the literature includes variables that explain the behavior towards labor regulation based on the answers of the workers, the opinions and data provided by the owners of the companies (large, medium, and small) were analyzed for the exploratory approach of the conceptual model. This is an important consideration because no conceptual models were found in academic literature that were supported by the responses of company owners, but rather on the information provided by the employees. For this reason, the studies reviewed in order to establish the hypotheses must be seen as an approximation, and not as direct empirical evidence, since these are data detected during the review of the literature. In addition to the availability of the data, the other argument for using the responses of the owners when exploring the conceptual model of this study is the source of the informal practices in personnel management, since it is usually the owners who incur in or establish the conditions for an informal practice (e.g., not registering the social security payment in the ledgers or the tax to diminish the economic situation of the unemployed).
Based on the variables associated with the previously reviewed constructs, two causal routes were identified for the behaviors towards labor regulation: a) the professional training received mediates the relationship between educational level and behavior towards labor regulation; b) average wages are associated with the behavior towards labor regulation.
The behavior towards labor regulation is explained in a direct manner by the average wages and training received, and in an indirect manner by the educational level and the context of informality. According to the findings of Hipp and Anderson (2015), and of Svalund et al. (2013) there is a direct relationship between the income or wages received and the behavior towards labor regulation. In fact, the likelihood ratio in said study was statistically significant for the variables of education (indirect relationship) and income (direct relationship).
For its part, the latent variable of training refers to the specialized training received at the workplace. Generally, training tends to be analyzed as an explicative variable; however, this study approaches it as a dependent construct, because the human capital theory of Gary Becker is not always fulfilled. He indicated that companies seek to improve the productivity and performance of their workers through more training. Conversely, in contexts of high labor flexibility and limited resources, employers prefer to finance the training of the workers with the greatest potential (that is, the most skilled or productive) instead of guiding financing towards the workers with the lowest performance. This generates a vicious cycle that leads some workers to be better trained and for others to have a growingly deficient training.
In this section evidence has been presented on the predictive relationships that exist between the constructs of educational level, average wages, professional training, and behavior towards labor regulation, but no empirical evidence was presented on the possible causal routes between informality and behavior toward tax regulation with the other variables of the conceptual model. Nevertheless, given that the informal practices on behalf of the owners of the companies are part of corporate life, the authors of this study considered it necessary to include the effect of informality on the behavior toward labor regulation. In this sense, the inclusion of the constructs of informality and of behavior toward tax regulation comprise the contribution of this conceptual model.
Due to the above, this study proposes a conceptual model of an exploratory character that responds to the following question: how does the training of the workers, average wages, and tax regulation influence the perception of labor overregulation on the part of Peruvian SMEs?
Methods
It is a cross-sectional, exploratory study that uses two data gathering instruments: The National Employment Survey (ENE) 2015 and structured interviews to three owners of Peruvian SMEs. A random, single-layer stratified sampling was used for ENE 2015.
The ENE 2015 is a yearly survey that the Instituto Nacional de Estadística e Informática (INEI) (National Institute of Statistics and Informatics) of Peru makes available to academics, researchers, and relevant interest groups. The participants of the survey were Peruvian companies (n = 19,204) that had a turnover of more than USD $23,899 in 2015 (according to the exchange rate of 3.18 soles, fixed by the Central Reserve Bank of Peru). The complete database was downloaded from the portal of the INEI. Subsequently, the companies that had no temporary suspension, lacked a fiscal address, had been qualified as nonexistent, without economic activity, or deregistered-whether ex officio or definitively-were selected from the total records (n = 17,782). Nevertheless, it should be noted that there was a large number of missing values because most of the company owners did not answer all of the questions in the survey, thus a special algorithm was used to prove the conceptual model given the high number of missing values.
This quantitative approach was complemented with the interviews to the owners of the SMEs, which helped to understand how the informal management of personnel manifests and the importance attributed to formalization; given that the spontaneous answers of the interviewees were analyzed, the discourse of the owners of the microenterprises was analyzed in this sense.
ENE 2015 - Variables included in the study
The ENE 2015 used a 35-page questionnaire with more than 300 questions, not all of them relevant for the conceptual model of this study. Therefore, the relevant items of the ENE 2015 were organized in the following latent variables, which were then included in the conceptual model proposed.
Educational level. This includes seven items concerning the educational level achieved by the company workers (e.g., postgraduate, undergraduate, university dropout, complete technical career, incomplete technical career, secondary / primary schooling, basic schooling / no level at all).
Training. This includes seven items concerning the areas in which the company workers were trained: languages, business management, occupational safety and health, information and communication technologies, socioemotional skills (leadership, training, others), technical topics (machine use, welding, others), and marketing / sales strategy.
Monthly wages. This includes five items concerning the average monthly wages that the company workers receive, according to occupational category: executive (chairman of the board, director, manager, assistant manager), permanent employee (contract for one or more years), permanent worker (contract for one or more years), temporary employee (less than a year), and temporary worker (less than a year). Given that there were various typographical errors and many missing values, only the average wages of the executives, permanent workers, and temporary employees were considered.
Informality. This includes two items concerning the problems of financing and informality, factors that limited company growth: Did financing problems limit company growth? Did the corruption of public officials limit company growth? Did informality limit company growth?
Tax regulation. This includes three ordinal items estimated using a 7-point Likert scale that measures the behavior towards tax overregulation: procedures for the compliance of obligations (payment, statements, others) concerning national taxes (income tax, general sales tax, selective excise tax, etc.), procedures for the payment of municipal taxes (property tax, sales tax, vehicle ownership tax, excise tax, etc.), and audit and sanction activities of the Superintendencia Nacional de Administración Tributaria (SUNAT) (National Superintendence of Tributary Administration) concerning national taxes. While the measurement level is ordinal, these were included as indicator variables of the tax regulation construct because the PLS-SEM structural modeling technique used in this study makes it possible to work with variables estimated at an ordinal level (Hair et al., 2017).
Labor regulation. This includes four ordinal items estimated using a 7-point Likert scale that focus on the behavior towards labor overregulation: required criteria by the Ministry of Labor and Promotion of Employment for the hiring of workers for a fixed term and for a definite period, as well severance payment for a worker hired for a fixed term and for an indefinite period. As with the tax regulation construct, the four ordinal items were used as indicator variables given that PLS-SEM handles different levels of measurement, in addition to the interval/ratio level used in structural equation modeling based on covariance matrices.
ENE 2015 - Conceptual model and hypotheses
Based on the review of the academic literature and knowledge of informal practices in personnel management, causal routes were identified to understand the relationship of the latent variables included in the conceptual model proposed for this study (see Figure 1).

Source: original proposal by the authors of this study.
Figure 1 Conceptual model that explains the behavior towards labor regulation
Hypotheses of the study
In the structural models the research hypotheses are expressed by the causal routes between the latent variables included in the model. In this sense, two hypotheses were established.
H1: The educational level and the effects of informality explain the training received by the workers of Peruvian SMEs.
H2: The training received, monthly wages, and behavior towards tax regulation explain the behavior toward labor regulation within Peruvian SMEs.
Although it is true that the findings reported in the academic literature allowed establishing provisional relationships between the constructs, in a strict sense during the revision of the literature no studies were found that simultaneously addressed the relationship between the six latent variables included in the structural model of this study, not even considering the empirical evidence provided by the studies based on correlation analyses or on regression studies. For all of these reasons, the conceptual model has an exploratory nature. Consequently, to examine the model, the structural modeling technique based on covariance will not be used-given that said technique is directed to validating conceptual models and focuses more on the explanation; instead, structural models that maximize variance, such as PLS-SEM, will be used. The analysis criteria of the measurement model and of the structural model will be explained in the following section.
ENE 2015 - Structural equation modeling
Given the assumptions that most of the indicators would not have a normal distribution, it was decided to use partial least squares structural equation modeling (PLS-SEM), since traditional structural models based on covariance assume that the variables estimated have a normal distribution. Following the guidelines established for PLS-SEM (Hair et al., 2017; Sarstedt et al., 2014), the validation of the model considered the evaluation of the measurement model and of the structural model. Concerning the measurement model, reflexive variables were used, since it was assumed that the indicator variables were associated; in this sense, each latent variable measures a common trait between its respective indicator variables. To consider that the latent variable had an adequate level of reliability, a value equal to or greater than 0.7 was considered for Cronbach’s alpha, the composite reliability index, and the ρ of Dijkstra-Henseler. As for validity, a value of 0.5 was fixed for the average variance extracted (AVE) in order to determine that the variables had adequate convergent validity. Additionally, the Fornell-Larcker criterion was used to establish the discriminant validity of the latent variables, said criterion establishes that the square root of the AVE must be greater than the correlation between the constructs. Regarding the evaluation of the structural model, the determination coefficient (R2) was obtained for each latent variable explained, though previously it was verified if there was evidence of collinearity between the constructs included in the model. Furthermore, two minimum values were established to determine whether the extracted variance was moderate or satisfactory: 0.50 and 0.70, respectively (Sarstedt et al., 2014). To determine significance and obtain the standard errors of the route coefficients, bootstrapping was used with 4,999 repetitions. As for the goodness of fit of the model, the values of the criteria were examined: unweighted least squares discrepancy (dULS), geodesic discrepancy (dG), and standardized root mean square residual (SRMR).
Although the SmartPLS software is one of the most used programs for PLS-SEM, since it has a user-friendly interface, it offers few options to deal with missing values (mean replacement, erase by case and pairs). In addition, given that what was sought to explore was the predictive capability of the conceptual model and since it was not possible to improve the data collection, it was decided to use ADANCO 2.0.1 (Henseler, 2017), which allows creating a constant to deal with missing values, because it was assumed that said omission was not random, but that the lack of an answer also revealed information.
The diversity of opinions for dealing with missing values was of great importance given the high number of these cases in the ENE 2015 database, since despite comprising a limitation for the external validity of the results, it is one of the first efforts carried out in Peru, at a national scale, on the situation of the companies.
For the purposes of grouping, those companies that had an annual turnover of less than USD $181,604 (at an exchange rate of 3.18 soles per dollar) were considered as microenterprises (n =7,157), while those with a turnover above USD $181,604 and below
USD $2,058,176 (according to the aforementioned exchange rate) were considered small enterprises (n = 2,301). Companies were classified in this manner because Peruvian legislation differentiates between microenterprise and medium-sized enterprise according to the annual turnover in soles, after tax deduction. In addition to the statistics for the general structural model, the corresponding indicators of the structural models for the Peruvian SMEs that were included in ENE 2015 were obtained.
Interviews to the owners of the SMEs - analyzed variables
Given that the conceptual model includes the latent variables of informality and labor regulation, it was considered pertinent to explore both variables from a qualitative perspective; therefore, the interview was also used as a data collection instrument. Thus, three owners of microenterprises answered four questions on their perception of informality in SMEs and the benefits that said enterprises obtain when formalized: “Why does informality emerge and lasts?”, “What is informality for you?”, “Why is labor informality accepted by workers?”, and “Is it possible to reduce labor informality?”. These questions corresponded to the following variables: origin of formality, conception of informality, acceptance of labor informality, and reduction of labor informality.
Interviews to the owners of SMEs - automatic term extraction
In order to analyze the spontaneous answers of the owners of the enterprises, a text mining technique known as automatic term extraction was used, which extracts the multi-word terms with the greatest semantic value or contribution to the meaning of the text and assigns them a score called a C-value. Said indicator is obtained through statistic and linguistic analyses, which are specific for each language. In this manner, the most relevant terms within a set of documents can be obtained. The answers were analyzed using the term extractor terMEXt (Barrón Cedeño, 2008).
Results
Descriptive data
The indicators of the six latent variables showed a high level of dispersion, as anticipated in the Methods section (see Table 1). Said finding corroborated the pertinence of using PLS-SEM to validate the conceptual model.
Table 1 Central tendency and dispersion measurements of the indicator variables of the conceptual model
| Variable | Indicator | Mean | Std. Dev. | Cases |
| Educational level | Primary-Secondary (e_prisc) | 40.244 | 312.974 | 13,698 |
| (number of workers) | Incomplete technical (e_tecni) | 7.410 | 130.436 | 13,698 |
| Complete technical (e_tecnc) | 22.335 | 172.487 | 13,698 | |
| Incomplete higher ed. (e_univi) | 8.614 | 72.706 | 13,698 | |
| Complete higher ed. (e_univc) | 29.730 | 173.276 | 13,698 | |
| Postgraduate (e_posgr) | 4.400 | 52.997 | 13,698 | |
| Training received | Business management (c_gest) | 7.170 | 70.957 | 7,901 |
| (workers per topic) | Safety and health (c_segur) | 70.601 | 325.787 | 7,901 |
| Information technology (c_tics) | 8.672 | 127.286 | 7,901 | |
| Social skills (c_habil) | 14.288 | 153.554 | 7,901 | |
| Technical-Productive (c_produc) Marketing and sales (c_market) |
17.535 9.474 |
117.724 89.255 |
7,901 7901 |
|
| Monthly wages | Executives (r_ejec) | 6,878.113 | 8,459.070 | 9,734 |
| (wages by category) | Fixed employees (r_emppr) | 2,236.219 | 4,350.900 | 10,852 |
| Fixed workers (r_obrpr) Temporary employees (r_empev) Temporary workers (r_obrev) |
1,486.508 1,585.140 1,301.571 |
2,846.078 2,897.994 2,361.778 |
3,880 5,172 3,219 |
|
| Informality | Difficult financing (i_limit1) | 0.551 | 0.988 | 14,236 |
| (according to priority) | Corrupt official(i_limit2) Informality (i_limit3) |
0.300 0.685 |
0.789 1.058 |
14,236 14,236 |
| Labor regulation | Hire fixed (r_labor1) | 4.051 | 1.719 | 11,794 |
| (mean on the scale) | Layoff fixed (r_labor2) | 4.634 | 1.600 | 11,187 |
| Hire temporary (r_labor3) | 3.928 | 1.474 | 11,787 | |
| Layoff temporary (r_labor4) | 4.668 | 1.580 | 10.853 | |
| Tax regulation | National taxes (r_tribut1) | 0.551 | 0.988 | 14,236 |
| (mean on the scale) | Municipal taxes (r_tribut2) | 0.300 | 0.789 | 14,236 |
| Audit (r_tribut3) | 0.685 | 1.058 | 14,236 |
Source: created by the authors using the results of the study. Std. Dev. = Standard Deviation
Obtained using ADANCO 2.0.1. Algorithm for missing values = Constant value. Route weighted scheme.
Evaluation of the measurement model
Most of the loads for the indicators of the latent variables of educational level, average wages, labor regulation, and tax regulation achieved values close to or above the expected minimum (0.70), but with the constructs of training and informality most of the loads were below the expected value. Concerning internal consistency, most of the latent variables achieved a high reliability, since, except for the latent variable of informality, the values of the rho coefficients of the other constructs were equal to or greater than 0.70 (see Table 2).
Table 2 Results of the evaluation of the measurement model
| Variable | Indicator | Loads | α | ρJ | ρD-H | AVE |
| Educational level | e_univc | 0.7936 | 0.6755 | 0.7779 | 0.6811 | 0.3763 |
| e_tecnc | 0.6742 | |||||
| e_prisc | 0.6377 | |||||
| e_tecni | 0.5386 | |||||
| e_univi | 0.5081 | |||||
| e_posgr | 0.4711 | |||||
| Training received | c_segur | 0.8369 | 0.5425 | 0.7118 | 0.6709 | 0.3133 |
| c_habil | 0.6453 | |||||
| c_produc | 0.5842 | |||||
| c_market | 0.3891 | |||||
| c_gest | 0.3858 | |||||
| c_tics | 0.3486 | |||||
| Monthly wages | r_ejec | 0.8406 | 0.6453 | 0.7600 | 0.7804 | 0.4037 |
| r_emppr | 0.7287 | |||||
| r_empev | 0.6209 | |||||
| r_obrpr | 0.4940 | |||||
| r_obrev | 0.3889 | |||||
| Informality | i_limit1 | 0.9368 | 0.1333 | 0.5424 | 0.2245 | 0.3527 |
| i_limit2 | 0.3684 | |||||
| i_limit3 | 0.2119 | |||||
| Labor regulation | r_labor1 | 0.8648 | 0.8991 | 0.8988 | 0.8999 | 0.6398 |
| r_labor2 | 0.8446 | |||||
| r_labor4 | 0.8320 | |||||
| r_labor3 | 0.7878 | |||||
| Tax regulation | r_tribut1 | 0.8873 | 0.8434 | 0.9055 | 0.8440 | 0.7615 |
| r_tribut2 | 0.8787 | |||||
| r_tribut3 | 0.8516 |
Source: created by the authors using the results of the study. α = Cronbach’s alpha; ρJ = Jöreskog’s rho; ρ D-K =
Dijkstra-Henseler’s rho; AVE = Average Variance Extracted
Note: obtained using ADANCO 2.0.1. Algorithm for missing values = Constant value. Route weighted scheme.
Concerning the convergent validity, only the latent variables of tax regulation and labor regulation achieved acceptable AVE values, that is, said constructs achieved an explained variance of 76% and 64%, respectively, for the items associated with each one of them.
Regarding discriminant validity, once more with the exception of the latent variable of informality, the AVE value of the constructs of the conceptual model was greater than the square of the correlation between the constructs, following the specification of the Fornell-Larcker criterion to determine discriminant validity. The result of this test reveals that of the six latent variables only five of them are really independent (see Table 3).
Table 3 Fornell-Larcker criterion to analyze discriminant validity
| 1. | 2. | 3. | 4. | 5. | 6. | (AVE > CLV2) | |
| 1. Educational level | 0.3763 | Yes | |||||
| 2. Training | 0.3913 | 0.3133 | No | ||||
| 3. Informality | 0.0001 | 0.0002 | 0.3527 | Yes | |||
| 4. Monthly wages | 0.0463 | 0.0374 | 0.0001 | 0.4037 | Yes | ||
| 5. Tax regulation | 0.0045 | 0.0046 | 0.0796 | 0.0366 | 0.7615 | Yes | |
| 7. Labor regulation | 0.0107 | 0.0088 | 0.0373 | 0.0698 | 0.4278 | 0.6898 |
Source: created by the authors using the results of the study.
Note: the AVE values are shown in bold in the diagonal, the values not in the diagonal correspond to the square of the correlations of latent variables (CLV).
Obtained using ADANCO 2.0.1. Algorithm for missing values = Constant value. Route weighted scheme.
Evaluation of the structural model
The causal routes proposed for the two hypotheses explained a moderately high ratio of the two latent variables dependent on the conceptual model: training received (R2 = 0.396) and labor regulation (R2 = 0.448), given that they obtained values equivalent to 40% and 45% of the explained variance of each construct (see Figure 2 and Table 4).
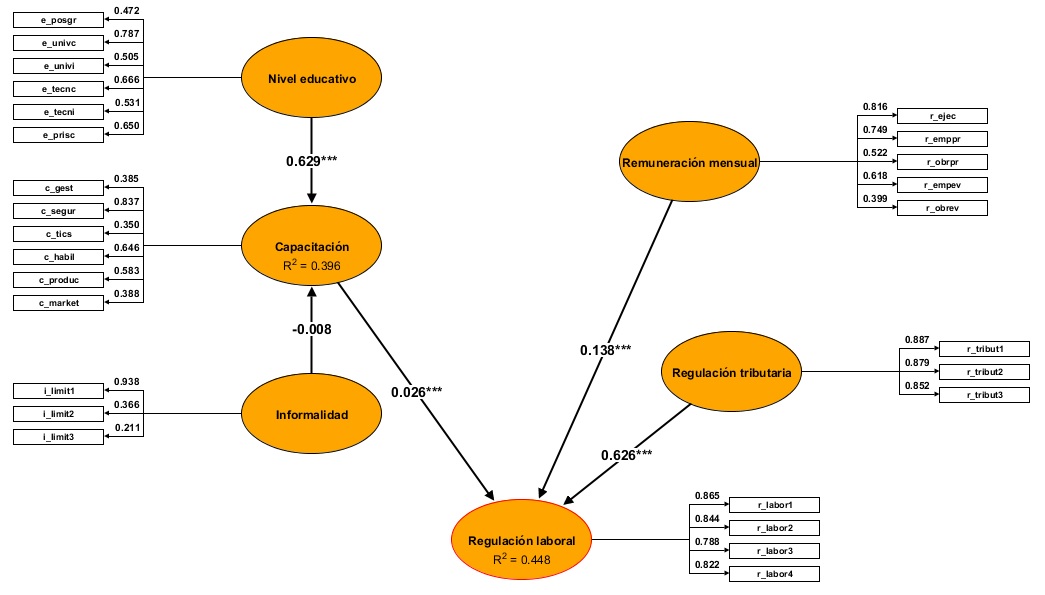
Note: obtained using ADANCO 2.0.1. Algorithm for missing values = Constant value. Route weighted scheme.
Source: created by the authors using the results of the study.
Figure 2 Conceptual model of the factors that explain the behavior towards labor regulation.
Table 4 Route coefficients and results of the bootstrapping
| Causal routes | Route coefficients | Bootstrapping | ||
| Sample mean | Std. Dev. | t-value | ||
| Educational level → Training | 0.6255 | 0.6408 | 0.0506 | 12.3690 |
| Informality → Training | -0.0082 | -0.0096 | 0.0067 | -1.2185 |
| Monthly wages → Labor regulation | 0.1398 | 0.1411 | 0.0068 | 20.5891 |
| Tax regulation → Labor regulation | 0.6257 | 0.6249 | 0.0061 | 102.0319 |
| Training → Labor regulation | 0.0244 | 0.0239 | 0.0062 | 3.9338 |
Source: created by the authors using the results of the study. Std. Dev. = Standard Deviation.
Note: obtained using ADANCO 2.0.1. Algorithm for missing values = Constant value. Route weighted scheme.
Concerning the size of the effect, of the five causal routes proposed only two had a strong effect according to the reference values suggested by Cohen (1988): tax regulation à labor regulation (f 2 = 0.6832) and educational level à training (f 2 = 0.6427). In the other causal routes, the effect of the explicative latent variables was weak (0.02 ≤ f 2 < 0.15) or insignificant (f 2 < 0.02). By being evaluated in an integral manner, it was found that the estimated data model did not achieve an adequate fit with the original data model, given that the result of the discrepancy tests generated values above the allowed limits (see Table 5).
Table 5 Goodness of fit tests of the PLS-SEM model
| 95th percentile | 99th percentile | Obtained value | Above the limit? | |
| dULS | 1.4762 | 1.6786 | 1.6884 | Yes |
| dG | 0.3603 | 0.4043 | 0.4087 | Yes |
| SRMS | 0.0625 | 0.0666 | 0.0373 | Yes |
Source: created by the authors using the results of the study.
Note: obtained using ADANCO 2.0.1. Algorithm for missing values = Constant value. Route weighted scheme.
The negative results of the goodness of fit tests can be due to the elevated presence of missing values. Although the algorithm to treat missing values allows incorporating them in the structural model, its effects in the modeling manifest in the coefficients used to evaluate the structural model.
Estimation of the structural model for small and micro enterprises
The explanation of the behavior towards labor regulation in small and micro enterprises showed a different pattern to that of the general model. In the former, the explained variance of the latent variables of training received, and of labor regulation was of 39% and 11%, respectively, while the value of the route coefficients decreased for most of the latent constructs. Concerning the structural model for small enterprises, the explained variance of both constructs was of 27% and 14%, respectively, and the magnitude of the structural coefficients also decreased in a significant manner.
As for the measurement model, in both cases there was a high variability in the values of the Dillon-Goldstein composite reliability index, and the AVE of the latent variables included in the model. In fact, the values of Cronbach’s alpha fell below a week level of reliability for the constructs of educational level and informality (see Tables 6 and 7). Therefore, the results of the structural modeling for the small and micro enterprises that participated in ENE 2015 must be taken with caution.
Table 6 Route coefficients of the structural model for microenterprises (n = 7,157)
| Causal routes | Route coefficients | p-valor |
| Educational level → Training | 0.621 | 0.000 |
| Informality → Training | -0.018 | 0.232 |
| Tax regulation → Labor regulation | 0.325 | 0.000 |
| Monthly wages → Labor regulation | -0.046 | 0.001 |
| Training → Labor regulation | 0.001 | 0.883 |
Source: created by the authors using the results of this study.
Note: obtained using Stata 14.2 and the SmartPLS program. Reliability: educational level (DG = 0.539, α = 0.267), training received (DG = 0.652, α = 0.417), monthly wages (DG = 0.631, α = 0.355), labor regulation (DG = 0.834, α = 0.734), tax regulation (DG = 0.770, α = 0.555), informality (DG = 0.039, α = 0.000). AVE (educational level = 0.187, training received = 0.228, monthly wages = 0.256, labor regulation = 0.551, tax regulation = 0.544, informality = 0.349). Bootstrapping with 500 repetitions. Lost values were calculated using the average of the available indicators.
Table 7 Route coefficients of the structural model for microenterprises (n = 2,301)
| Causal routes | Route coefficients | p-value |
| Educational level → Training | 0.520 | 0.000 |
| Informality → Training | 0.016 | 0.656 |
| Tax regulation → Labor regulation | 0.368 | 0.000 |
| Monthly wages → Labor regulation | -0.060 | 0.001 |
| Training → Labor regulation | 0.059 | 0.011 |
Source: created by the authors using the results of this study.
Note: obtained using Stata 14.2 and the SmartPLS program. Reliability: educational level (DG = 0.621, α = 0.371), training received (DG = 0.642, α = 0.386), monthly remuneration (DG = 0.706, α = 0.517), labor regulation (DG = 0.822, α = 0.712), tax regulation (DG = 0.769, α = 0.551), informality (DG = 0.000, α = 0.000). AVE (educational level = 0.251, training received = 0.244, monthly wages = 0.287, labor regulation = 0.532, tax regulation = 0.543, informality = 0.334). Bootstrapping with 500 repetitions. Lost values were calculated using the mean of the available indicators.
Analysis of the interview answers
The microentrepreneurs interviewed considered that excessive legal and administrative regulation is the main reason for entering and remaining in informality, as informality becomes a way to create jobs and generate wealth, especially in the provinces of the interior of the country (see Table 8). For them, informality is part of the economic and social context, given that it appears during the formalization process, when the entrepreneurs are made conscious of how difficult it is to fulfill the current labor laws, in particular those regarding wages (see Table 9). Concerning the acceptance of labor informality, the microentrepreneurs indicate that it is due to the lack of qualification of the workers, the owners of the SMEs taking advantage of the situation, and the willingness of the workers, for example, to agree to not receive social benefits in exchange of these not being deducted from their wages (see Table 10). As for measures to combat informality, they indicate that it must be done in a progressive and permanent manner, beginning with the areas with the least decision level (see Table 11).
Table 8 Terms with greater semantic value to explain the origin of informality
| No. | Multiword term | C-value |
| 1 | Legal and administrative regulation | 2.4546 |
| 2 | Informality opportunities | 2.1410 |
| 3 | Continuity of informality | 2.1410 |
| 4 | Lack of understanding | 2.1043 |
| 5 | Job positions | 2.0862 |
| 6 | Province market | 2.0862 |
| 7 | Wealth creator | 2.0680 |
| 8 | Working capital | 2.0680 |
| 9 | Informal sale | 1.6182 |
| 10 | Excessive time | 1.6182 |
Source: created by the authors using the results of this study.
Note: obtained using the term extractor terMEXT.
Table 9 Terms with greater semantic value to explain their conception on informality
| No. | Multiword term | C-value |
| 1 | Labor informality | 3.2222 |
| 2 | Economic and social context | 2.4222 |
| 3 | Health care institutions | 2.4222 |
| 4 | Wage perception | 2.1346 |
| 5 | Interests of entrepreneurs | 2.1346 |
| 6 | Formalization process | 2.0902 |
| 7 | Current labor regulations | 2.0902 |
| 8 | Difficulties in compliance | 2.0680 |
| 9 | Unstable situation | 1.6444 |
| 10 | Labor market | 1.6444 |
Source: created by the authors using the results of this study.
Note: obtained using the term extractor terMEXt.
Table 10 Terms with greater semantic value to explain the acceptance of labor informality
| No. | Multiword term | C-value |
| 1 | Levels of informality | 2.1180 |
| 2 | Lack of qualification | 2.1180 |
| 3 | Situation of informality | 2.0930 |
| 4 | Taking advantage | 2.0930 |
| 5 | Sales case | 2.0930 |
| 6 | Conjunction of interests | 2.0930 |
| 7 | Work area | 1.6000 |
| 8 | Reduced wages | 1.6000 |
Source: created by the authors using the results of this study.
Note: obtained using the term extractor terMEXt.
Table 11 Terms with greater semantic value to explain how to reduce labor informality
| No. | Multiword term | C-value |
| 1 | Progressive and permanent manner | 2.525 |
| 2 | Type of legal regulations | 2.440 |
| 3 | Permanent process | 1.680 |
| 4 | Lower levels | 1.680 |
Source: created by the authors using the results of this study.
Note: obtained using the term extractor terMEXT.
Discussion
Partial validation of the conceptual model
The conceptual model has five causal routes, two that explain the training receive and three that render account of the behavior toward labor regulation. The constructs of informality and behavior towards tax regulation have not been included in similar structural models previously reported in academic literature; nevertheless, the authors of this study consider it important to include them in the conceptual model due to the fact that informality and tax evasion are very prevalent in countries such as Peru.
The structural modeling using PLS-SEM allowed validating most of the causal routes, but not the informality → training route. It is an important trajectory because it was assumed that said training mediated the relationship between informality and the behavior towards labor regulation, generating with it an important dynamic to understand the effect of informality, given the assumption that professional training would influence a positive behavior towards labor regulation. On the other hand, the behavior toward tax regulation (the second latent variable contributed to the conceptual model) not only achieved a causal route with statistical significance, but also a moderately high effect. Although said relationship has not been analyzed in depth in academic literature, it is relevant data since it indicates the strength this component has in promoting a positive behavior towards labor regulation.
Connections with academic literature and contribution of the model
Of the three studies analyzed in the theoretical foundation section, the findings of this study are consistent with the study of Svalund et al. (2016), who also found a positive and significant relationship between wages and behavior towards labor regulation. However, in the case of this study, the effect of educational level on the behavior towards labor regulation was mediated by the professional training received in the company. The other two studies reviewed in the substantiation of the model are not directly comparable, because they examine conceptual models integrated by other variables. Concerning the study of Svalund et al. (2006), it is not possible to identify more common elements since said study used a logistic regression model, whereas the present study used a structural model based on partial least squares. This leads to the belief that the number of studies that explain the behavior towards labor regulation in contexts of informality using PLS-SEM models could be broadened, because these models have become a standard when examining latent variables of a psychological type such as behaviors and perceptions.
Since the structured questionnaires that measure the behavior within the organization are comprised by items grouped in subscales, when analyzed using regression models the structural relationships that exist between said constructs were left aside. In fact, recognizing said structural dynamic is one of the reasons that explains the wide adoption of structural models.
As for the contribution of the conceptual model, despite not achieving an adequate goodness of fit, the conceptual proposal of this study identifies two explicative routes for the behavior towards labor regulation: a training route and an economic route. In the training route, the effect of educational level is mediated by the professional training received in the company, while in the economic route, monthly wages and the behavior toward tax regulation act directly on the behavior towards labor regulation. Both explicative routes present challenges in different fronts. In the former, the explicative route questions current understandings in the business world; for its part, the latter route leads to the evaluation of the viability of replicating experiences that were successful in other social and economic conditions.
In contexts with low levels of informality and institutional stability, organizational behavior follows the expected patterns; for example, companies make efforts to improve their human capital, investing heavily in their workers. However, in highly informal contexts, marked by the lack of resources, companies look to maximize their investment in human capital and prioritize the allocation of resources to provide better training opportunities to the workers with greater potential or better performance within the company. In fact, two studies show that a low educational level and low wages (or precarious working conditions with low wages) predict, in a statistical sense, receiving deficient training or not being considered in the training programs financed by the employers. In the first study 20,377 workers were surveyed who came from 6,223 work centers. From said survey, the answers of a subsample of workers with a full-time regular job (n = 16,295) were analyzed, which were then divided between workers with high and low wages: 86% and 14%, respectively. According to the results of the logistic regression model, having higher education (LR = 1.497, p < 0.001) and an administrative or managerial job (LR = 1.361, p < 0.001) increases the probability of receiving training at work (Zeytinoglu et al., 2008). When the relationship between participating in job training programs and educational level, those who indicated having gone beyond secondary education or even gotten to higher education had a greater probability of receiving training at work: LR = 2.028, p < 0.001 and LR = 1.734, p < 0.001, respectively (Zeytinoglu and Cooke, 2008).
The second study worked with a sample of 24,197 workers from 6,631 work centers. The logistic regression model identified the factors associated with being excluded from, declining, or receiving training. In the case of the workers who were excluded, not having completed secondary education meant a 36% lower probability of being considered to receive training at work (Cooke et al., 2011). Furthermore, an analysis was done, separately, of the workers with lower wages who received training at work, and not having concluded secondary education reduced the probability of being trained by 42% (Cooke et al., 2009).
As for the economic route, the major challenge is in improving the perception that the owners of the SMEs have of the formalization process, which is expressed in the benefits that a company obtains by integrating itself into the formal system, where the most important is the possibility of obtaining financing from the banking system. In addition to having working capital to ensure the supply of inputs for the goods and services that the SMEs offer to their clients, another benefit is the positive way in which formal companies are perceived by their clients, since being formalized makes small companies have to maintain minimum levels of quality. Concerning the benefits of formalization, 3,565 owners of marginalized and informal microbusiness, who had received support from the Centro de Investigación, Asistencia y Docencia para la Micro y Pequeña Empresa (CIADMYPE) (Research, Administration and Teaching Center for Small and Micro Enterprises), were interviewed in order to know their intention to formalize. Correspondence analysis was used to determine whether the intent to formalize depended on the following variables: desire to formalize, current business goals, existence of competition, market knowledge, reason for launching the business or place of origin. According to the findings of the study, the desire to receive financing, having the expansion of the business as a goal, and perceiving the market potential favor the intent to formalize. Interestingly enough, knowing that the small or medium enterprise faces competition does not influence on the intent to formalize (Aguilar-Barceló et al., 2011).
A study carried out in Brazil analyzed the reasons that led 607 entrepreneurs from Matto Grosso to join the formalization promotion program and to verify if they were satisfied with the obtained results. The microentrepreneurs interviewed indicated that the main benefits of formalization were having a legal company, working for themselves, having coverage for the retirement pension, and having easy access to credit. Concerning the requested credit, only 11% of those who requested credit obtained the expected financing. In addition, it was found that the microentrepreneurs of older age and who requested lower credits have a greater possibility for their financing request to be approved (Da Silva and Decourt, 2016). Recently, an analysis was carried out on the development perspective of small Russian enterprises within the modernization processes, driven by sectoral and tax policies undertaken in Russia. For this, the researchers used different time series analysis methods, the structural, functional, and systematic analysis of the aforementioned policies, as well as the analysis of the causal connections between the associated factors. The results showed that the combined use of both policies has made possible the activation of small enterprises and of the Russian economy as a whole (Gashenko and Zima, 2017).
The emphasis on the benefits obtained by the SMEs highlights the positive assessment of the formalization of the SMEs; however, it is also possible to analyze said assessment from a negative perspective attributed to the formalization process. From this approach, the negative assessment is expressed in the perception of the cost overruns or the excessive regulation associated with the management of a formalized company. Although there are different control mechanisms, this study focused on the labor and tax overregulation.
In this regard, researchers from the World Bank examined the effect of introducing preferential regimes for small and micro enterprises of Georgia in the creation of formal companies and the payment of taxes, for this they used a data panel for the 2008-2012 period. When comparing the creation rate of new companies before the tax reform (2008-2009) with said rate after the reform (2011-2012), the regression discontinuity analysis showed that there was an increase of 27% to 41% in the number of new microenterprises that had a turnover of less than USD $18,255 per year. In the small enterprises that had a turnover between USD $18,255 and USD $60,850 such changes were not observed. Also, no effect was observed in the compliance with the payment of taxes. It should be noted that the increase in the number of microenterprises was only observed during the first year of the tax reform (Bruhn and Leoprick, 2016). A recent study with small and medium enterprises in Indonesia examined the effect of implementing a new tax code in the payment of taxes of companies that had a turnover of less than USD $355,500 per year. A qualitative design was used with representatives of the relevant interest groups, who participated in a focus group discussion. Although the new tax code sought a just and equative treatment, the taxpayers felt that the tax overload did not lessen with the new code, since most of them operate at a small scale and have a low turnover (Rahayu, 2017).
Returning to the conceptual model, although partial support was found for the research hypotheses, it is not possible to compare the findings of this study with what is reported in the academic literature, because the structural modeling presented in this research is one of the first implementations of PLS-SEM to identify the factors that explain the behavior towards labor regulation. In this sense, this is a first step in understanding why the owners of small and micro enterprises decide to enter into and remain in informality, a dynamic that was also explored through the answers of the interviewed entrepreneurs.
The path towards formalization
Informality in the management of SMEs is not an isolated phenomenon within the economy of a country, it is part of the environment and above all receives the influence of all the cultural, economic, and social factors. In some countries the percentage of informality is extremely high, which significantly affects all the sectors, although in some of them, as is the case of the labor sector, its effects are not immediately perceived. Labor informality is found in the context of entrepreneurial informality; therefore, it is not an isolated fact, it is influenced by the environment and promoted by all those involved or responsible for solving it. For example, on the part of the State, labor regulations do not promote or create the conditions for the worker to access the formal labor market from the beginning of their working life; for this reason, workers-particularly young workers-request not being in any labor regime because they consider them as very distant, as occurs with pensions or because the wages are extremely low.
Compliance with labor obligations on the part of the company is the normal and natural path, it means formal action, which is what is desired for the economy of a country. To improve the work-company relationship, labor regulations must promote better relationships and benefits for both parts, otherwise it promotes a constant conflict that affects relationships, production, and productivity.
Labor informality takes place when the partial or total transactions that workers and companies perform occur at the margin of the legal regulations, and of those concerning the yielding of the service of the workers. In this context, it is considered that labor informality is affecting the economic growth of the country: the decrease in the income of new workers to the labor market and the creation of fewer well-paid jobs increase in the distrust of the entrepreneurs, in deterioration of the working environment and of the wellbeing of the workers, as well as decrease in the capture of greater income by the State. From another perspective, it promotes the creation of new companies and jobs, perhaps in highly precarious conditions, but poses a solution to unemployment that prevails in emerging economies.
Given all of this, the conceptual model presented in this study contributes as a first approximation to the issue from the perspective of structural models. Future studies that do not have the limitations that emerged during this study will surely improve the external validity of the presented results.
Limitations of the Study
Three limitations were found that could limit the scope of the results presented in this study: the missing values, the measurement model, and the study design. Although the high number of missing values was not an obstacle to obtain significant route coefficients with moderate and medium effect sizes, the structural model did not achieve an adequate goodness of fit because a high presence of missing values impedes having complete correlation or covariance matrices, which are the starting point to calculate the goodness of fit indicators. Given that it was not possible to improve the collection of data because it dealt with a national level initiative, the only thing that could be done was to use the best possible algorithm to deal with missing values. Since the assumption that the “non-answer” of the entrepreneurs who participated in the ENE 2015 revealed information, said “non-answer” was assumed to have a constant value and was incorporated in the model. Future replicas of this study will help corroborate the pertinence of the adopted approach.
The second limitation was concerning the moderate levels of convergent and discriminant validity when the measurement model was evaluated. Although said values did not improve when disaggregating the PLS-SEM for small and micro enterprises, the high level of reliability was maintained. This shows that other explicative routes should be explored to improve the validity of the model, which although it was not as robust as expected, does constitute a starting point to understand what factors influence the behavior towards labor regulation.
The study design was the third limitation, because, with the exception of the educational level achieved, the latent variables included in the conceptual model have a dynamic character. In this sense, it would have been best to use a longitudinal data panel design, but said information will only be available within four to five years, since the INEI has announced that the ENE will be applied every two years. At the time of this work, only the data from the ENE 2015 were available, whose surveys were applied towards the end of the year 2014. Despite all of this, these preliminary findings are being presented because they are the only data at a national scale available on the behavior of entrepreneurs towards labor regulation.
Conclusions
Informality in company management is a widespread problem in Latin American Countries, in particular in small and micro enterprises. This situation is aggravated when it is transferred to personnel management, since this can affect the average wages paid to the workers. Therefore, it is important to identify the factors that explain the behavior towards labor regulation, because if the behavior is strongly negative it is probable that the owner of the small or micro enterprise is looking for the first opportunity to manage their personnel in an informal manner (e.g., hire a worker without a contract or without having them on the payroll, hire a worker with a contract and have them on the payroll but without receiving all of their benefits, etc.). In this sense, despite the fact that the conceptual model presented in this study has some limitations, it is a starting point to ithin companies.
This study presents results aggregated at the national level as a first approximation in order to better understand the path towards labor regulation; however, the interested associations or unions could replicate this analytical approach to verify if the reported variables have the same level of incidence, analyzing the data by industrial or commercial sector, since this will allow designing targeted strategies that will allow improving the behavior towards labor reforms.
As the interviewees indicated, it is possible to stop labor informality, but it requires a continuous and progressive process, because a gradual improvement is the safest way to achieve a change in business culture that remains stable in time.
REFERENCES
Aguilar-Barceló, J. G., Texis-Flores, M., & Ramírez-Angulo, N. (2011). Conformación de la expectativa de formalización de la microempresa marginada en México. Innovar, 21(41), 63-75. Disponible en: http://www.scielo.org.co/scielo.php?script=sci_arttext&pid=S0121-50512011000300006 . Consultado: 22/10/2019. [ Links ]
Ajzen, I. (1991). The theory of planned behavior. Organizational Behavior and Human Decision Processes, 50(2), 179-211. http://doi.org/10.1016/0749-5978(91)90020-T. [ Links ]
Arela Bobadilla, R. W. (2016). Análisis microeconómico del impacto de la informalidad laboral en el déficit cuantitativo tradicional de vivienda y la decisión entre alquilar y comprar una vivienda en el Perú entre 2012 y 2015. (Tesis de licenciatura, Universidad Católica San Pablo, Arequipa, Perú). Disponible en: http://repositorio.ucsp.edu.pe/bitstream/UCSP/14901/1/ARELA_BOBADILLA_RON_ANA.pdf . Consultado: 22/10/2019. [ Links ]
Arellano Ortiz, P. (2012). La informalidad en América Latina: Revisión del concepto y experiencias. Revista Internacional de la Protección Social, 1(1), 101-112. Disponible en: https://idus.us.es/xmlui/handle/11441/61990 . Consultado: 22/10/2019. [ Links ]
Barrón Cedeño, L. (2008). Manual para el extractor de término terMEXt. Disponible en: http://users.dsic.upv.es/~lbarron/publications/2008/Barron_manual_terMEXt.pdf . Consultado: 22/10/2019. [ Links ]
Bello Marín, B. (2010). Impacto de la informalidad laboral en la gestión y el desarrollo de las microempresas del Mercado Central de la ciudad de Chiclayo - 2008. (Tesis de Licenciatura, Universidad Señor de Sipán, Chiclayo, Perú). Disponible en: http://www.pead.uss.edu.pe/bitstream/uss/2511/1/BELLO%20MARIN.pdf . Consultado: 22/10/2019. [ Links ]
Bruhn, M. & Loeprick, J. (2016). Small business tax policy and informality: evidence from Georgia. International Tax and Public Finance, 23(5), 834-853. http://doi.org/10.1007/s10797-015-9385-9. [ Links ]
Cohen, J. (1988). Statistical power analysis for the behavioral sciences. 2nd. ed. Hillsdale, NJ: Laurence Erlbaum and Associates. [ Links ]
Cooke, G. B., Chowhan, J., & Brown, T. (2011). Declining versus participating in employer-supported training in Canada. International Journal of Training and Development, 15(4), 271-289. http://doi.org/10.1111/j.14682419.2011.00386.x. [ Links ]
Cooke, G. B. , Zeytinoglu, I. U., & Chowhan, J. (2009). Barriers to training access. Perspectives on Labour and Income, 21(3), 45-56. [ Links ]
Cuba Asillo, S. R. (2017). Análisis de los factores que determinan la informalidad laboral en el distrito de Puno, 2016. (Tesis de Ingeniería, Universidad Nacional del Altiplano, Puno, Perú). Disponible en: http://repositorio.unap.edu.pe/bitstream/handle/UNAP/5564/Cuba_Asillo_Stiwarth_Rolando.pdf . Consultado: 22/10/2019. [ Links ]
Da Silva, J. V. V. M. & Decourt, R. F. (2016). Sole micro entrepreneurs: Perceptions about the formalization of small business in Brazil. International Business Management, 20(21), 5208-5214. [ Links ]
Fuller-Love, N. & Scapens, R. W. (1997). Performance related pay: A case study of a small business. International Small Business Journal, 15(4), 48-63. http://doi.org/10.1177/0266242697154003. [ Links ]
Gashenko, I. V. & Zima, Y. S. (2017). Perspectives of development of small business within modernization of tax and cluster policy. Contributions to Economics, 529-536. http://doi.org/10.1007/978-3-319-45462-7_51. [ Links ]
Hair, J. F., Hult, G. T. M., Ringle, C. M. & Sarstedt, M. (2017). A primer on partial least squares structural equation modeling (PLS-SEM). 2nd ed. Thousand Oaks, CA: Sage. [ Links ]
Henseler, J. (2017). Adanco 2.0.1 - User manual. Disponible en: https://www.composite-modeling.com/get-adanco/. Consultado: 22/10/2019. [ Links ]
Hipp, L. & Anderson, C. (2015). Laziness or liberation? Labor market policies and workers’ attitudes toward employment flexibility. International Journal of Social Welfare, 24(4), 335-347. http://doi.org/10.1111/ijsw12155. [ Links ]
INEI (2014). Resultados de la Encuesta de Micro y Pequeña Empresa, 2013. Lima, Perú: Instituto Nacional de Estadística e Informática. Disponible en: https://www.inei.gob.pe/media/MenuRecursivo/publicaciones_digitales/Est/Lib1139/libro.pdf . Consultado: 22/10/2019. [ Links ]
Jiménez Restrepo, D. M. (2012). La informalidad laboral en América Latina: ¿explicación estructuralista o institucionalista? Cuadernos de Economía, 31(58), 113-143. Disponible en: http://www.scielo.org.co/scielo.php?script=sci_arttext&pid=S0121-47722012000300006 . Consultado: 22/10/2019. [ Links ]
Kelloug, J. E. & Nigro, L. G. (2005). Dramatic reform in the public service: At-will employment and the creation of a new public workforce. Journal of Public Administration Research and Theory, 16(3), 447-466. http://doi.org/10.1093/jopart/mui052. [ Links ]
Kotey, B. & Folker, C. (2007). Employment training in SMEs: Effect of size and firm type - Family and nonfamily. Journal of Small Business Management, 45(2), 214-238. http://doi.org/10.1111/j.1540-627X.2007.00210.x. [ Links ]
Matlay, H. (2002). Industrial relations in the SME sector of the British economy: An empirical perspective. Journal of Small Business and Enterprise Development, 9(3), 307-318. http://doi.org/10.1108/14626000210438625. [ Links ]
Rahayu, N. (2017). Analysis of tax treatment of personal taxpayers engaging in business with certain gross income (small enterprise). International Journal of Economic Research, 14(9), 289-298. [ Links ]
Sarstedt, M. , Ringle, C. M. , Smith, D., Reams, R., & Hair, J. F. (2014). Partial least squares structural equation modeling (PLS-SEM): A useful tool for family business researchers. Journal of Family Business Strategy, 5(1), 105-115. http://doi.org/10.1016/j.jfbs.2014.01.002. [ Links ]
Svalund, J., Saloniemi, A., & Vulkan, P. (2016). Attitudes toward job protection legislation: Comparing insiders and outsiders in Finland, Norway and Sweden. European Journal of Industrial Relations, 22(4), 371-390. http://doi.org/10.1177/0959680115626057. [ Links ]
Uribe García, J. I., Ortiz Quevedo, C. H., & García Cruz, G. A. (2008). Informalidad y subempleo en Colombia: dos caras de la misma moneda. Cuadernos de Administración, 21(37), 211-241. Disponible en: http://www.scielo.org.co/scielo.php?script=sci_arttext&pid=S0120-35922008000300010 . Consultado: 22/10/2019. [ Links ]
Velapatiño, V., Grippa, F., & Perea, H. (2017). Perú: Informalidad laboral y algunas propuestas para reducirlas: análisis macroeconómico. BBVA Research: Observatorio Económico Perú, 2017, 1. Disponible en: https://www.bbvaresearch.com/wp-content/uploads/2017/01/Observatorio-informalidad-laboral1.pdf . Consultado: 22/10/2019. [ Links ]
Vilca Vereau, L. S. (2013). El impacto de la informalidad laboral en la motivación de los trabajadores del Centro Comercial El Virrey del distrito de Trujillo. (Tesis de Licenciatura, Universidad Nacional de Trujillo, Perú). Disponible en: http://dspace.unitru.edu.pe/bitstream/handle/UNITRU/2516/vilca_lorenzo.pdf . Consultado: 22/10/2019. [ Links ]
Voss, U. & Brettel, M. (2014). The effectiveness of management control in small firms: Perspectives from resource dependence theory. Journal of Small Business Management , 52(3), 569-587. http://doi.org/10.1111/jsbm.12050 [ Links ]
Zavala, M. (2016). Los impresionantes números del sector informal peruano. El Comercio. Disponible en: https://elcomercio.pe/economia/peru/inei-impresionantes-numeros-sector-informal-peruano-229623 . Consultado: 22/10/2019. [ Links ]
Zeytinoglu, I. U. & Cooke, G. B. (2009). On-the-job training in Canada: Associations with information technology, innovation and competition. Journal of Industrial Relations, 51(1), 95-112. http://doi.org/10.1177/0022185608099667. [ Links ]
Zeytinoglu, I. U., Cooke, G. B., Harry, K., & Chowhan, J. (2008). Low-paid workers and on-the-job training in Canada. Relations Industrialles / Industrial Relations, 63(1), 5-29. [ Links ]
Received: November 27, 2017; Accepted: October 19, 2018; Published: January 31, 2019
 Este es un artículo publicado en acceso abierto bajo una licencia Creative Commons
