


 nova página do texto(beta)
 Inglês (pdf)
 Artigo em XML
 Referências do artigo
 Enviar este artigo por email
 Citado por SciELO
  Similares em
SciELO
Similares em
SciELO 
 Permalink
Introduction
Why do people who constitute organizations act as they do? (Hambrick & Mason, 1984) This question has been debated over the last few years in light of the various strategic theories, which have sought to explain past results and predict the future. Previously, the focus of these theories was the factors that were external to organizations, but recent studies have pointed to human factors as a source of the creation and maintenance of competitive advantages (Cyert & March, 1963; Hoskisson, Hitt, Wan, & Yiu, 1999).
Studies on the influence of managerial characteristics began to be relevant in the late 1950s (Boone, Van Olffen, & Van Witteloostuijn, 1998). Theoreticians from the Carnegie School (March & Simon, 1958; Cyert & March, 1963) recognized that organizational decisions are made by limited rational people. These limits are a result of the individuals’ restricted abilities to process all information that is relevant to decision making in complex environments due to the uncertainty and to the constant need to use subjective judgements (March & Simon, 1958; Boone et al., 1998).
As a form of response to this complexity, managers process part of the relevant stimuli and obtain information according to their own cognitive biases (March & Simon, 1958). In the 1970s, the interest in managers responsible for decision making related to the futures of organizations was intensified (Child, 1974; Dhaouadi, 2014). In this period, three branches stood out: Organizational Ecology (Hannan & Freeman, 1977), Neo-Institutional Theory (Meyer & Rowan, 1977), and Resource-Based View Theory (Hambrick & Mason, 1984). The latter was one of the pillars for the creation of the Upper Echelon Theory - UEP (Hambrick & Mason, 1984), which gives decision makers the role of influence in business performance (Dhaouadi, 2014).
Hambrick and Mason (1984, p. 195) defend the argument that “managers matter”. They stated that the intrinsic and acquired characteristics throughout their professional and academic trajectory end up reflecting on the management, thus causing them to exert influence in the formulation and adoption of the most appropriate organizational strategy (Finkelstein, Hambrick, & Cannella, 2009). Observable and cognitive characteristics affect their choices and, consequently, their profitability, continuity, and entrepreneurial future (Carpenter, Sanders, & Gregersen, 2001).
Initially, the characteristics emphasized by the Upper Echelon Theory were the psychological ones, which are represented by cognitive factors and values, and the observable ones, which are portrayed by age, professional trajectory, previous experiences, heterogeneity, origin and economic position (Hambrick & Mason, 1984). The performance measures used by these studies (Cho & Hambrick, 2006; Harjoto & Jo, 2009; Hu & Liu, 2015; Peni, 2014; Mansi & Pandey, 2016) have been the return on assets (Peni, 2014), the return on equity (Harjoto & Jo, 2009), and profits (Cho & Hambrick, 2006).
Even in different aspects, the influences of the executives in all the resulting actions, processes and performance may be related. Empirical studies have examined the importance of the specific characteristics of senior executives, their work experiences and their network relationships as antecedents to corporate entrepreneurship (Wei & Ling, 2015), the relationship between the service time of the upper echelons and the company performance (Simsek, 2007), and the reflections of strategic leaders on the quality of decisions (Lin & Rababah, 2014).
Although a large number of UEP studies have been conducted during the last three decades, they have presented ambiguous results and some inconsistencies remain (Wang, Ma, & Wang, 2015). Given the need to observe the importance of the managers who constitute the upper echelons and their relationship to organizational performance, there is the present study’s following research question: What is the relationship between the observable characteristics of CEOs and organizational performance? To answer this question, it is necessary to analyse the relationship between the observable characteristics of CEOs and the performance of the listed companies in the New Market segment of BM&FBOVESPA from the years 2010 to 2015.
The justification for this research is to contribute to the development of organizational studies by using the explanatory power that the observable characteristics of CEOs have with respect to business performance. In addition, the study is original because of the possibility of finding new results that have not yet been disseminated in the scientific-professional environment (Castro, 1977). Although the research started more than three decades ago, the results found in UEP studies are not unanimous. The same characteristics, depending on the selected sector or sample, may have different effects. In particular, in Brazil, UEP has been relatively little studied (Medeiros, Serra, & Ferreira, 2009; Serra, Serra, & Tomei, 2014).
Review of the literature and hypothesis development
A number of management, economics, and psychology theories had already recognized, albeit indirectly, the influence of top executives (March & Simon, 1958; Cyert & March, 1963; Hambrick & Mason, 1984). Under the interest of these influences, March and Simon published the first study on the subject in which they insisted on the interrelationship between motivation and cognitive factors as the central premise of Organizational Theory (March & Simon, 1958).
Cyert & March (1963) stated that member diversity affected the operational efficiency of the organization (Finkelstein, Hambrick, & Cannella, 2009) . Organizational decisions are made by limited rational people. These limits are the results of the individuals’ restricted ability to process all information that is relevant to decision making (March & Simon, 1958; Boone et al., 1998).
The cognitive basis of an individual is formed by the individual’s experiences, including their formal training and work history. Thus, each manager’s specific perception of environmental stimuli depends in part on the experiences they have had during their lifetime and their personal demographics (March & Simon, 1958; Cyert & March, 1963).
Subsequently, with the expansion of studies on the subject, Child (1974) demonstrated that the competitiveness of the companies goes beyond the human factor, since it also depends on external factors, besides the control of the top management. During this period, there were three distinct branches concerning the importance of top managers (Child, 1974; Dhaouadi, 2014). One of them is the Population Ecology of Organizations, popularly known as Organizational Ecology, which attributes only to the environment the role of influencing organizational results (Hannan & Freeman, 1977).
In the same period, another theory that dealt with the importance of the environment was the object of researched. It was the Institutional Theory, which attributed importance to both the environment and managers (Meyer & Rowan, 1977). Different from the first two theories that attribute total or partial influence to the environment, the Resource-Based View (RBV) attributes relevance to internal aspects. The RBV’s main premise is that the unique resources and skills of each organization will provide a competitive advantage for companies (Barney, 1991).
One of the human strategic resources associated with outcomes, either positively or negatively, is the managers who lead the organizations (Hambrick & Mason, 1984; Carpenter et al., 2001; Mendes et al., 2017). One of the subfields of RBV (Serra et al., 2014), the Upper Echelon Theory (UEP), states that strategic decisions and the consequential organizational results are influenced by the characteristics of managers who constitute the upper echelons (Hambrick & Mason, 1984).
Each decision maker brings their own set of data when faced with a particular organizational situation. These data reflect the cognitive basis of the decision maker. They are immutable. Therefore, when they undergo new experiences and acquire new knowledge, their perceptions are updated and may undergo significant changes (March & Simon, 1958; Hambrick & Mason, 1984).
A situation that involves choosing a strategy is not so simple. The decision makers use their cognitive basis and values when making choices, thus creating a screen between the situation and their eventual perception (Hambrick & Mason, 1984). The managers’ field of view is limited, and they cannot absorb all aspects of the organization and of the environment that are present. The managers’ perceptions are even more limited, thus resulting in selectivity of what is recognized by their vision. The information selected for processing and interpretation is chosen based on the values and cognitive characteristics (Hambrick & Mason, 1984).
The manager has a restricted field of view through which a selective reception and a consequent interaction produce strategic choices. The filtering process occurs through the characteristics of the upper echelon, which are defined as “psychological” and “observable”. The psychological variables are the cognitive basis and values, while the observable ones are mainly demographic, experimental, social and financial (Hambrick & Mason, 1984).
Most UEP studies analyse the characteristics of managers for the purpose of evaluating organizational performance, and this evaluation is usually performed on the basis of profitability. In general, the performance evaluation may be conducted in two forms: qualitatively (importance) and quantitatively (measurement) (Catelli, 2001).
In this study and in others regarding UEP, the performance evaluation is qualitative and uses numerical indicators, such as economic-financial indicators (Michel & Hambrick, 1992; Parrino, 1997; Peni, 2014; Hu & Liu, 2015; Bortoluzzi, Zakaria, Santos, & Lunkes, 2016). These indicators are obtained through the analysis of the accounting statements. Hence, the return on assets indexes, the degree of indebtedness and general liquidity were used.
In detail, the return on assets is one of the main indexes used to measure profitability and consists of the relationship between the returns received by the organization compared to its assets (Return on Assets-ROA) (Yang & Zhao, 2014; Cook & Glass, 2015; Pham, Oh, & Pech, 2015; Cline & Yore, 2016). This indicator makes it possible to highlight the returns on the values applied by a company with respect to its assets in a given period.
The degree of indebtedness shows the policy of obtaining resources of the organization. That is, the measure shows if an organization uses their own resources or a third parties’ re-sources, and the proportions of each one. Through the level of indebtedness, it is possible to measure the financial health of the company. Finally, the liquidity indicator was used to assess the payment capacity, which is the ability of the organization to honour its commitments in the short term (Sheikh & Wang 2012). In this research, the following characteristics were used: family control, duality, experience in the position, training, gender, age and origin. These characteristics were analysed by means of the hypotheses discussed below.
There is no consensus regarding the influence of family control. Some studies state that the presence of high participation rates by family members is responsible for the decrease of corporate performance (Allouche, Amann, Jaussaud, & Kurashina, 2008; Basco, 2013).
Therefore, the following hypothesis arises:
H1: CEOs who have family relationships or control stock have a negative influence on organizational performance.
Duality is the combination of the positions of CEO and chairperson of the board. There is ambiguity in the literature regarding whether the duality of the Chief Executive Officer (CEO) is beneficial or detrimental (Yang & Zhao, 2014). In some situations, duality is a cultural and political representation of the country or region where the organization is inserted, such as Vietnam, which has the ideology that powers should not be divided (Pham et al., 2015). The main argument against duality is found in the Theory of the Firm (Jensen & Meckling, 1976), which states that a manager who accumulates both positions will never be able to serve both sides since the manager will always be benefiting one side or the other. On the other hand, the main argument in favour of dual leadership is the company’s ability to respond rapidly to changes in the environment (Yang & Zhao, 2014). Thus, in light of the reported, the following hypothesis is conjectured:
H2: The duality of the CEO positively influences organizational performance.
According to the study by Gupta & Govindarajan (1986), CEOs with more experience may be more familiar with organizational markets, technologies, people, processes and cultures, and this may help them to develop a shared and more accurate cognitive structure in new environments. Greater experience of upper echelon managers may produce social cohesion, and this attribute may increase socialization and lead to better organizational performance (Michel & Hambrick, 1992). In this context, the following hypothesis is given:
H3: Greater experience of CEOs positively influences organizational performance.
Education, to a certain extent, serves as an indicator of a person’s value system and cognitive preferences, and is a determining factor in measuring their receptivity towards an innovation (Hambrick & Mason, 1984). Executives with high education levels provide valuable human capital for the company. They have a greater cognitive capacity and greater capacity for information processing, thus contributing to more effective solutions in situations that require decision making (Amran, Yusof, Ishak, & Aripin, 2014, Menegazzo, Lunkes, Mendes, & Schnorrenberger, 2017). In this sense, the following hypothesis is proposed:
H4: The level of training of CEOs positively influences organizational performance.
Academic researchers have suggested that gender differences are responsible for performance differences by adding distinct values to organizations. In general, the studies that were found indicate that the participation of women in management contributes to the improvement in corporate governance and organizational performance (Mesa & Montecinos, 1999; Peni, 2014). Moreover, some scholars argue that diversity increases organizational equity, while other scholars argue that diversity increases conflict, reduces cooperation, and impairs performance (Pescatello, 1972; Tiano et al., 1986; Cook & Glass, 2015). The literature on gender differences provides evidence suggesting that women have greater communication skills and a more effective leadership style in the contemporary environment than men (Peni, 2014). In this direction, the following hypothesis is presented:
H5: The presence of a female CEO on the management team positively influences organizational performance.
When correlating the performance and age of managers, significant evidence was found that longevity would affect performance, either positively or negatively (Peni, 2014). Prendergast & Stole (1996) created a forecast model that shows that younger CEOs invest more aggressively and take on greater risks in order to show their superior capacity. Younger managers focus on short-term goals and seek to build their reputation, while older managers are concerned with choosing projects that positively reflect the value of their retirement (Peni, 2014). Thus, the following hypothesis is suggested:
H6: The presence of younger CEOs will have a positive influence on organizational performance.
Managers called insiders are more apt to develop and implement actions that satisfy the demand of managers at lower levels. In addition, investors may see the promotion of insiders as a sign of stability and continuity (Puffer & Weintrop, 1995; Parrino, 1997). Puffer & Weintrop (1995) argue that hiring managers that are outsiders may result in new ideas and skills for the organization and may represent a sign of change and renewal. Given the context, the following hypothesis is developed:
H7: The promotion of managers who were already part of the organization will positively reflect on organizational performance.
After presenting the theoretical review and the hypotheses to be tested, the next topic shows the methodological procedures used for the operationalization of the research.
Methodology
This study was based on the companies that have shares traded in the New Market segment of BM&FBovespa. This segment was chosen because of the highly differentiated corporate governance standard that is represented by a high standard of transparency, a large volume of offers and the voluntary adoption of additional corporate governance practices that are required by Brazilian law (BM&FBovespa, 2017).
The period of analysis is from 2010 to 2015. The choice of this period is justified by the availability of information about the observable characteristics and because the accounting and financial information was available. The population of the segment corresponds to 129 companies, of which 104 presented the data that was necessary for the analysis.
The data of the financial statements were obtained from Economática® software. The information of the Higher Levels was collected from the Reference Form of each company and year in accordance with the sub-items in the form, called the 12 - 6.8 Assembly and Administration. Data were collected from companies that had financial data and executives who had been with the company 5 or 6 years. Companies with no information regarding the two tenures were excluded. Figure 1 shows the variables of the studied object in the Libby box of the research.
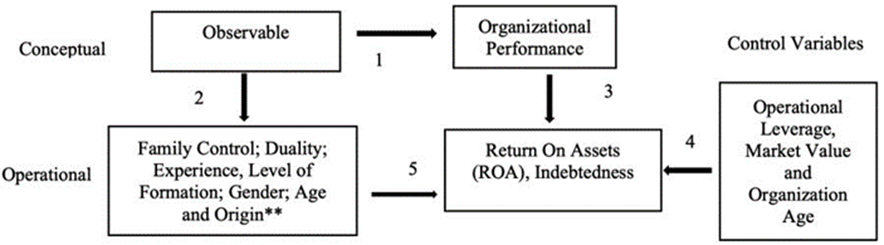
** Origin: Outsider (hired manager of another organization) or Insider (manager who already worked in the organization).
Figure 1: Predictive Validity Framework. Source: Adapted from Libby, Bloomfield and Nelson (2002).
In each relationship, there is at least one dependent variable and one independent variable. However, for real-world situations, it is necessary that this relationship includes another type of variable, the moderator. A moderator or control variable is a second independent variable that is included because it may significantly contribute to or have a contingent effect on the original relationship between the independent and dependent variables (Cooper & Schindler, 2011).
The control variables market value (Talke, Salomo, & Rost, 2010), company age (Díaz-Fernández, González-Rodríguez, & Simonetti, 2015; Pham et al., 2015; Cline & Yore, 2016) and operational leverage (Cronqvist et al., 2012; Ansari, Goergen, & Mira, 2014) were extracted from the studies on UEP that were the result of the review of the literature.
According to the UEP, the CEO has an important role. Although this power is not “absolute” since it depends on the corporate culture, most of the times strategic decisions are influenced by their leaders (Wei & Ling, 2015). Thus, in this study, the characteristics of CEOs were used to analyse organizational performance (Ansari et al., 2014; Hu & Liu, 2015; Wei & Ling, 2015; King, Srivastav, & Williams, 2016), and organizational performance was assessed by the return on assets that consists of the ratio between net income compared to assets. The indebtedness that shows the organization’s resource mobilization policy was measured from short- and long-term liabilities in contrast to total assets. In turn, liquidity was used to evaluate the company’s ability to pay given its short-term assets and liabilities.
For the companies that had a change of executive within the year, as the criterion of classification, first the executive who has stayed the longest in the year under analysis was chosen. In cases in which there was a tie, the inclusion of the executive who has stayed longer in the company was determined.
Regarding family control, the following criteria were analysed: the foundation of the organization, the kinship with the founding members or the holder of the largest percentage share of the company. The duality was analysed through the combination of the positions of chairperson of the board and the chief executive officer of the company.
The experience was analysed based on the term of the CEO. In addition, previous experience in the same sector of activity was also analysed. The training was analysed in terms of the level of education and the area of training. For the influence of gender, the female presence or absence in the direction of the company was taken into account. Age was analysed by creating two ranges that divided managers into young and old. The origin and succession take into account whether the managers were already members of the company before assuming upper echelon positions.
To analyse the results, the panel data analysis was performed using the Statistical Analysis Software STATA. The tests of Chow, Breusch-Pagan and Hausman were performed. Next, the results of the procedures performed to determine the approach are presented.
Table 1 Assumption of the panel data analysis
| Tests | Results | Hypotheses |
| Panel A - Return on Assets | ||
| LM of Breusch-Pagan |
X2 =
1.03 Sig, X2 = 0.155 |
The variance of the residues reflecting individual differences is equal to zero (POLS) |
| F of Chow | F = 0.85 Sig, X2 = 0.834 |
The intercepts are the same for all cross-sections (POLS), |
| Hausman test |
X2 = 2.56 Sig, X2 = 0.999 |
The model of error correction is adequate (random effects), |
| Panel B - Indebtedness | ||
| LM of Breusch-Pagan |
X2 =
0.047 Sig, X2 = 0.246 |
The variance of the residues reflecting individual differences is equal to zero (POLS) |
| F of Chow | F = 2.08 Sig, X2 = 0.000 |
The intercepts are different for all cross-sections (fixed effects), |
| Hausman test |
X2 = 90.79 Sig, X2 = 0.000 |
The model of error correction is not adequate (fixed effects), |
| Panel C - Liquidity | ||
| LM of Breusch-Pagan |
X2 =
79.67 Sig, X2 = 0.000 |
The variance of the residues reflecting individual differences is different from zero (random effects) |
| F of Chow | F = 4.11 Sig, X2 = 0.000 |
The intercepts are different for all cross-sections (fixed effects), |
| Hausman test |
X2 = 54.31 Sig, X2 = 0.000 |
The model of error correction is not adequate (fixed effects), |
Source: Research data (2017).
The tests determined the fixed effects as the most appropriate approach for the treatment of the data of the models of indebtedness and liquidity, and the random effects approach as that for the profitability model. A better detailing of the data analysis will be presented in the following section.
Results
To begin the analysis of the data, the descriptive statistics of the return on assets, indebtedness and liquidity is shown in Table 2.
Table 2 Descriptive statistics of the dependent variables
| Variable | Maximum | Minimum | Mean | Standard deviation |
| Return on Assets | 86.5% | -67.2% | 4.3% | 13.2% |
| Indebtedness | 116% | -20.6% | 27.8% | 26.9% |
| Liquidity | 70.7% | 0 | 2.8% | 8.2% |
Source: Research data (2017).
It is possible to observe in Table 2 that the level of return on indebtedness was higher than that related to the return on assets or liquidity. It is important to highlight that the negative numbers related to indebtedness are not related to a specific sector. However, some sectors are more affected than others, such as basic products (oil, mining and steel) and construction, which correspond to more than 44% of this study’s sample. They have a mean indebtedness four times higher than their revenue generation.
As a counterpart to the increase in indebtedness, profitability and liquidity decreased. The Brazilian companies listed on BM&FBovespa have sold less and lost half of their profits in the first half of 2015. Even in a crisis, the CEOs’ responsibilities do not decrease, and their role is still to ensure the highest returns to the shareholders. It is up to the managers to adapt to the new reality of the market and sustain the continuity of the business. This is the basic premise of UEP in which managers (more precisely, their intrinsic characteristics) are related to the identified results (Hambrick & Mason, 1984).
In the following, we developed the descriptive analysis of the independent variables: experience, age, experience in the sector, duality, level of training, kinship, gender and origin. Table 3 presents the results of the variables experience and age.
Table 3 Descriptive statistics of the variables experience and age
| Variable | Maximum | Minimum | Mean | Standard deviation |
| Experience | 53 | 0,5 | 8,4 | 9,7 |
| Age | 80 | 33 | 52 | 9,4 |
Source: Research data (2017).
Table 3 shows a great difference between the periods of longer and shorter terms as well as a great age difference between older and younger managers. Currently, it is observed that the board of directors, executives and investors want to know how the CEO addresses market variations over a long period by taking into account both the term and the age of the manager (Musteen, Barker, & Baeten, 2006; Brick, Palmon, & Wald, 2006). The presence of older managers is the result of the complexity of finding a successor. This is the great challenge presented by the companies listed on BM&FBovespa. The difficulty of finding a successor for the current CEO has contributed to the presence of managers at more advanced ages and with longer terms (BM&FBovespa, 2015).
A study conducted by Raz et al. (2004) found that the regions of the brain responsible for more complex memories and cognition show a representative decline after the age of 60. The statute of some Brazilian companies establishes the age of 65 as the period for mandatory retirement (BM&FBovespa, 2017). In contrast, other studies did not establish an age limit and only sought to establish ranges within the analysed sample (Hambrick & Mason, 1984).
Experience accompanies age. Thus, it is possible to state that older managers usually have a longer term of office, which benefits the organization (Cline & Yore, 2015). However, there is not a consensus regarding the appropriate period of experience and age. The analysis of the characteristics related to their previous performance in the company sector, duality, graduate education and kinship are illustrated in Table 4.
Table 4 Descriptive statistics of the variables previous experience, duality, graduate education and kinship
| Previous Experience in the Sector | Duality | Graduate Education | Kinship | |
| Have | 83% | 44% | 53% | 28% |
| Do Not Have | 17% | 55% | 47% | 72% |
| Total | 100% | 100% | 100% | 100% |
Source: Research data (2017).
According to the presented data, as far as previous experience is concerned, most CEOs have experience in the business sector of the companies in which they currently work. It is important to highlight that the experience of managers in other organizations was often not as the CEO. In-depth knowledge of the company and of the sector is relevant to the generation of long-term growth (Hambrick & Mason, 1984).
Crainer & Dearlove (2015) cited a study conducted by Standard & Poor’s 500 in which 20% of the CEOs of American companies had already held the position of CEO in another organization. That is, they already had experience. In some cases, the experience of having already run an organization may not contribute to the manager’s current position. Nevertheless, in diverse sectors, it was found that organizations seek CEOs with previous experience due to the need for more specific characteristics (Berry, Bizjak, Lemmon, & Naveen, 2006).
The second highlighted variable is the duality of leadership, which consists of the combination of the positions of CEO and chairperson of the board. It is evident that, in most organizations, CEOs do not hold both positions. This result is a consequence of the rule imposed on companies listed on Bovespa in the New Market segment in 2011, which imposed the separation of these two positions. According to the Corporate Governance Best Practices Code (2015), the end of dual leadership should have occurred by May 2014, and non-compliance with this rule is subject to a fine or, in extreme cases. However, some companies are not yet following this rule.
Empirical studies suggest that CEO duality has both positive and negative aspects (Dey, Engel, & Liu, 2011; Yang & Zhao, 2014; Pham et al., 2015). Nonetheless, with the 2008 crisis, the separation of these two positions became the subject of discussion. The argument used by the responsible bodies refers to the irresponsible performance of executives concerned with their own earnings rather than the interests of shareholders and the organization itself, which could be avoided with the end of the combination of positions.
Regarding the variable related to the level of education, it is shown that more than 50% of managers have a graduate degree. Another relevant point in the sample data is that this percentage has increased over the years. A study conducted by the Harvard Business Review (2015) stated that a CEO with a graduate degree is approximately 40 positions ahead of a CEO without a graduate degree.
The last variable highlighted in Table 4 refers to the presence of a family relationship/ control stock with the company’s CEO. Based on the presented information, it is possible to observe that, in the studied period, the mean of founding/kinship with CEOs or with percentage shares was 30% in the first three years, and later this percentage decreased. According to the literature, the decrease of family influence is more common as the company has more years of foundation (Ansari et al., 2014).
According to Ansari et al. (2014), 80% of family businesses in their first generation have a paternalistic stance. However, future generations may switch to professional management if they do not have a successor in the family. After the presentation of the independent variables related to training, a female presence in the organization’s presidency is highlighted. Table 5 shows the descriptive analysis of the variables gender and origin.
Table 5 Descriptive statistics of the variables gender and origin
| Variable | % | |
| Gender | Female | 3% |
| Male | 97% | |
| Total | 100% | |
| Origin | Insider | 55% |
| Outsider | 45% | |
| Total | 100% | |
Source: Research data (2017).
It may be observed in Table 5 that the management of organizations is dominated by male managers, and women in leadership positions were a minority in the studied companies. In addition, the few female managers who achieve the position of CEO suffer greater pressure with respect to goals, intense control, resistance, and defiance to their authority by other directors (Cook & Glass, 2015).
In a more detailed examination, the results show that the presence of women in CEO positions increased in 2015. The main areas of activity of these women were the service and financial market areas. However, analysing the retrospective of the last three years, there is a regression of the female presence in leadership positions. By contrast, the world scenario has changed according to the research of the International Business Report (IBR) - Women in Business that was conducted by Grant Thornton in 36 countries.
The next independent variable presented refers to the origin of the executive, whether s/he comes from another organization or was an employee of the company. Over 50% of managers in the presidency had been hired from other organizations. The numbers in Brazil differ from the world numbers. In the research conducted by the Harvard Business Review (2015), approximately 74% were insiders. In India, for example, this proportion was 63%, while in Japan approximately 90% rose from a position in the company. Inside executives perform better in the United States, United Kingdom and Latin America, while outsiders perform better in Continental Europe, India and China.
According to the UEP, the promotion of managers who have already worked in the organization contributes to the effectiveness of organizational performance by increasing the profitability and reducing conflicts with the board (Shetty & Perry, 1976; Michel & Hambrick, 1992; Lippert & Porter, 1997).
After the presentation of the descriptive statistics, the panel data analysis is presented.
Thus, Table 6 shows the results for the return on assets.
Table 6 Panel data results - Return on Assets
| Variables | Fixed Effects | Random Effects | POLS | |||
| Coefficient | Sig, | Coefficient | Sig, | Coefficient | Sig, | |
| Constant | 127.103 | 0.922 | 664.253 | 0.603 | 676.707 | 0.577 |
| Leverage | -0.424 | 0.884 | 0.184 | 0.947 | 0.238 | 0.930 |
| Market Value | 0.000 | 0.776 | 0.000 | 0.835 | 0.000 | 0.809 |
| Age | -20.816 | 0.962 | -44.786 | 0.872 | -47.063 | 0.861 |
| Telecommunications | Omitted | -327.469 | 0.831 | -329.665 | 0.820 | |
| Oil, Gas and Biofuels | Omitted | -506.008 | 0.710 | -522.470 | 0.686 | |
| Information Technology | Omitted | -450.613 | 0.730 | -459.660 | 0.711 | |
| Non-Cyclical Consumption | Omitted | -66.669 | 0.954 | -65.728 | 0.953 | |
| Public Utility | Omitted | -355.643 | 0.764 | -363.757 | 0.746 | |
| Basic Materials | Omitted | -254.787 | 0.832 | -261.496 | 0.818 | |
| Construction and Transportation | Omitted | 107.933 | 0.925 | 99.528 | 0.927 | |
| Cyclical Consumption | Omitted | -137.287 | 0.904 | -138.930 | 0.898 | |
| Financial and Others | Omitted | -174.300 | 0.881 | -175.033 | 0.874 | |
| Industrial Goods | Omitted | -241.588 | 0.838 | -249.606 | 0.823 | |
| Fashion and Style | Omitted | -110.517 | 0.930 | -115.279 | 0.923 | |
| Health Sciences | -104.118 | 0.967 | -376.933 | 0.705 | -387.927 | 0.684 |
| Computer Science | -10.098 | 0.996 | -131.038 | 0.941 | -151.548 | 0.931 |
| Human science | -192.986 | 0.891 | -99.939 | 0.890 | -91.921 | 0.894 |
| Legal Science | -140.791 | 0.909 | -258.319 | 0.731 | -264.582 | 0.715 |
| Exact Sciences | -94.826 | 0.927 | -24.835 | 0.966 | -22.128 | 0.969 |
| No Training | -79.990 | 0.952 | -304.972 | 0.650 | -310.655 | 0.630 |
| Applied Social Sciences | -97.802 | 0.925 | -232.246 | 0.691 | -235.313 | 0.675 |
| Level of Training | 34.722 | 0.947 | -353.588 | 0.146 | -363.093 | 0.119 |
| Experience | -334.122 | 0.266 | -325.489 | 0.173 | -329.340 | 0.158 |
| Gender | 68.921 | 0.968 | 37.254 | 0.956 | 36.359 | 0.955 |
| Duality | 14.512 | 0.975 | -132.034 | 0.612 | -136.437 | 0.586 |
| Experience in the Sector | 141.704 | 0.851 | 401.016 | 0.263 | 413.956 | 0.229 |
| Kinship | 210.620 | 0.858 | -110.608 | 0.739 | -109.525 | 0.729 |
| Origin | 21.687 | 0.970 | -237.252 | 0.411 | -248.647 | 0.370 |
| R2 | 0.164 | 0.016 | 0.018 | |||
| Adjusted R2 | -0.039 | -0.031 | -0.029 | |||
Source: Research data (2017).
The results of the analysis of the relationship between the profitability of the company and the observable characteristics of the CEOs were not significant. None of the observable characteristics of the managers presented sufficient power to explain the performance of the organization with respect to profitability. In contrast to the obtained results, previous studies have shown a positive relationship between the CEO’s observable characteristics and profitability (Pham et al., 2015; Allouche et al., 2008; King et al., 2016). Table 7 shows the results of the data regression for the Indebtedness panel.
Table 7 Panel data results - Indebtedness
| Variables | Fixed Effects | Random Effects | POLS | |||
| Coefficient | Sig, | Coefficient | Sig, | Coefficient | Sig, | |
| Constant | -727.566 | 0.037 | -193.593 | 0.619 | -207.965 | 0.560 |
| Leverage | 0.013 | 0.987 | 0.453 | 0.546 | 0.578 | 0.467 |
| Market Value | 0.000 | 0.918 | 0.000 | 0.398 | 0.000 | 0.376 |
| Age | -77.563 | 0.504 | -22.040 | 0.784 | -35.981 | 0.650 |
| Telecommunications | Omitted | 42.571 | 0.928 | 19.909 | 0.963 | |
| Oil, Gas and Biofuels | Omitted | 78.517 | 0.851 | 61.691 | 0.871 | |
| Information Technology | Omitted | 113.838 | 0.777 | 120.730 | 0.740 | |
| Non-Cyclical Consumption | Omitted | 50.502 | 0.888 | 56.300 | 0.862 | |
| Public Utility | Omitted | 63.649 | 0.862 | 58.690 | 0.859 | |
| Basic Materials | Omitted | 99.571 | 0.788 | 103.732 | 0.756 | |
| Construction and Transportation | Omitted | 100.318 | 0.777 | 123.799 | 0.699 | |
| Cyclical Consumption | Omitted | 25.308 | 0.943 | 38.473 | 0.904 | |
| Financial and Others | Omitted | 86.057 | 0.810 | 72.890 | 0.822 | |
| Industrial Goods | Omitted | -209.535 | 0.564 | -211.177 | 0.520 | |
| Fashion and Style | Omitted | 107.639 | 0.780 | 131.143 | 0.709 | |
| Health Sciences | 541.287 | 0.426 | 178.434 | 0.546 | 125.503 | 0.654 |
| Computer Science | 174.517 | 0.734 | 112.857 | 0.815 | 119.051 | 0.817 |
| Human science | 278.811 | 0.460 | 219.171 | 0.303 | 202.612 | 0.318 |
| Legal Science | 695.396 | 0.036 | 114.283 | 0.601 | 98.395 | 0.644 |
| Exact Sciences | 587.868 | 0.034 | 110.854 | 0.517 | 69.791 | 0.672 |
| No Training | -364.117 | 0.309 | 165.538 | 0.405 | 185.680 | 0.327 |
| Applied Social Sciences | 531.768 | 0.058 | 226.762 | 0.186 | 215.521 | 0.192 |
| Level of Training | -293.808 | 0.036 | -7.840 | 0.914 | 39.014 | 0.569 |
| Experience | 126.394 | 0.116 | 117.548 | 0.079 | 113.483 | 0.098 |
| Gender | -221.487 | 0.635 | 5.521 | 0.978 | 29.181 | 0.878 |
| Duality | -209.402 | 0.092 | 31.908 | 0.674 | 70.052 | 0.342 |
| Experience in the Sector | -150.135 | 0.457 | -179.095 | 0.091 | -149.335 | 0.140 |
| Kinship | 1944.714 | 0.000 | -4.699 | 0.963 | -71.303 | 0.444 |
| Origin | 103.097 | 0.499 | 156.590 | 0.066 | 136.280 | 0.095 |
| R2 | 0.320 | 0.033 | 0.040 | |||
| Adjusted R2 | 0.156 | -0.014 | -0.006 | |||
Source: Research data (2017).
According to the results presented in Table 7, the variables level of training and duality have a negative relationship with indebtedness, whereas kinship has a positive relationship. The other studied variables were not significant.
There are no previous studies that have found a negative relationship between a high level of training and indebtedness. Nevertheless, levels of training are related to organizational effectiveness. High levels of education are determinants of strategic choices. They reflect individual skills, knowledge and cognitive bases and positively contribute to the company’s performance, which may be reflected in low levels of indebtedness. Therefore, the hypothesis that addresses the positive relationship between the level of training and performance may not be accepted.
No research was found that showed a negative relationship between duality and indebted-ness. However, the combination of positions allows for quick responses to events that may affect the organization, thus contributing to decisions that result in the reduction of indebted-ness. Hence, the hypothesis dealing with the positive influence of duality may be accepted.
With regard to family influence, there are no other results in the UEP literature that relate indebtedness to the CEO’s kinship. Nonetheless, family business directors are usually chosen by kinship rather than managerial skills, which may contribute to decisions that result in increased indebtedness. Therefore, it is possible to accept the hypothesis that addresses the negative influence of kinship on business performance. Table 8 shows the results of the regression on panel data for Liquidity.
Table 8 Panel data results- Liquidity
| Variables | Fixed Effects | Random Effects | POLS | |||
| Coefficient | Sig, | Coefficient | Sig, | Coefficient | Sig, | |
| Constant | -3.141 | 0.439 | 4.431 | 0.530 | 4.201 | 0.365 |
| Leverage | -0.001 | 0.877 | -0.001 | 0.892 | 0.000 | 0.975 |
| Market Value | 0.000 | 0.032 | 0.000 | 0.041 | 0.000 | 0.032 |
| Age | -0.950 | 0.482 | 0.853 | 0.454 | 1.744 | 0.091 |
| Telecommunications | Omitted | -5.650 | 0.534 | -4881 | 0.379 | |
| Oil, Gas and Biofuels | Omitted | 10.767 | 0.165 | 12.331 | 0.013 | |
| Information Technology | Omitted | -2.391 | 0.753 | -0.406 | 0.932 | |
| Non-Cyclical Consumption | Omitted | 2.715 | 0.692 | 2.586 | 0.540 | |
| Public Utility | Omitted | -1.549 | 0.824 | -0.456 | 0.916 | |
| Basic Materials | Omitted | -2.487 | 0.724 | -1.392 | 0.749 | |
| Construction and Transportation | Omitted | 0.784 | 0.907 | 2.717 | 0.514 | |
| Cyclical Consumption | Omitted | -1.364 | 0.839 | 0.162 | 0.969 | |
| Financial and Others | Omitted | -3.025 | 0.656 | -1.792 | 0.670 | |
| Industrial Goods | Omitted | -0.735 | 0.915 | 0.789 | 0.853 | |
| Fashion and Style | Omitted | -2.569 | 0.716 | -0.836 | 0.855 | |
| Health Sciences | -30.929 | 0.000 | -0.758 | 0.873 | 8.588 | 0.019 |
| Computer Science | -0.552 | 0.927 | -1.315 | 0.822 | -3.209 | 0.630 |
| Human science | 0.949 | 0.829 | 0.261 | 0.936 | -0.006 | 0.998 |
| Legal Science | -0.365 | 0.924 | -4.945 | 0.117 | -5.442 | 0.050 |
| Exact Sciences | -0.343 | 0.915 | -2.423 | 0.341 | -2.251 | 0.294 |
| No Training | -3.043 | 0.466 | -5.189 | 0.090 | -5.407 | 0.028 |
| Applied Social Sciences | -0.831 | 0.799 | -2.877 | 0.260 | -2.665 | 0.214 |
| Level of Training | 2.305 | 0.157 | 0.585 | 0.606 | -0.163 | 0.854 |
| Experience | -2.682 | 0.004 | -2.528 | 0.004 | -2.790 | 0.002 |
| Gender | 1.774 | 0.744 | 7.195 | 0.031 | 6.413 | 0.010 |
| Duality | 1.574 | 0.277 | 0.517 | 0.644 | 0.197 | 0.836 |
| Experience in the Sector | 3.589 | 0.128 | 1.825 | 0.265 | 1.481 | 0.259 |
| Kinship | 12.589 | 0.001 | 0.044 | 0.980 | -1.973 | 0.103 |
| Origin | -0.300 | 0.866 | 0.305 | 0.814 | 0.307 | 0.772 |
| R2 | 0.520 | 0.061 | 0.156 | |||
| Adjusted R2 | 0.403 | 0.015 | 0.115 | |||
According to the results of Table 8, it is possible to observe that the experience variable has a negative relationship with liquidity, while kinship has a positive relationship. The other studied variables were not significant.
Concerning the influence of managers’ experience on liquidity, previous studies have highli-ghted the positive impact of more experienced managers on performance due to greater autonomy in decisions related to the use of cash in hand (Peni, 2014; Hu & Liu, 2015). Nevertheless, the obtained results differ from the literature. They may be explained by the fact that more experienced managers are not willing to take risks and make safer investments. Hence, the hypothesis dealing with the positive relationship between experience and performance may not be accepted.
With respect to the other variables with significance, there are no previous studies dealing specifically with the relationship (positive or negative) between kinship and liquidity. However, the positive relationship with liquidity may be attributed to company planning practices that have taken into account the liquidity needs of shareholders/family and that have established clear criteria for the distribution of dividends and profits.
The other hypotheses that address the positive influence of the gender, age and origin of CEOs are not significant in any of the analysis models. Thus, it was not possible to delineate a positive or negative relationship with performance.
Conclusions
The results of this research show that the New Market segment was one of the segments most affected by the recent oscillations in the economy. This segment has also presented difficulties in the succession of its directors who have increasingly longer terms, even though they exceed the age limit imposed by Bovespa, which may affect the future of these companies. Duality is another rule that is not being followed. A considerable number of directors still occupy two of the main roles of the organization, which may affect the images of these companies.
The companies in the sample have been moving away from family management and increasingly approaching professional management. The hiring of external managers by the organization and the valuation of previous experience in the sector of managers who assume CEO positions have both increased. Despite the benefits of promoting members of the organization, hiring outside managers contributes to corporate governance by bringing in an external version that is unrelated to the shareholders.
Regarding education level, most CEOs had graduate training. The presence of females in the company’s direction is another important point of emphasis. The percentage that was minimal did not evolve during the analysed period, thus showing that, despite advances in relation to gender equality, women still find ample resistance regarding leadership positions.
Concerning the statistical analysis, no significant relationships were found between three of the seven raised hypotheses and organizational performance. These are the age, gender, and origin of CEOs. These implications differ from most of the results presented by the UEP literature, which has established a positive or negative relationship between these characteristics and the performance of companies. Family control, experience and training were negatively related. Only duality had a positive relationship with organizational performance.
The presented results should be viewed from the perspective of limitations, such as the use of only the CEO rather than the entire management team. Another factor is the analysis by segment instead of the sectorial analysis, which may interfere in the results taking into account the particularities of each area of performance.
Additionally, the analysis was consolidated; the six years was considered as a whole and as individual years, which may influence the evaluation of the data. Moreover, it should be noted that the Brazilian economic situation was not taken into account for the diagnosis of the obtained information. The economic situation is indicated by the use of other variables that, until now, were little approached, such as religion, culture and heterogeneity. A qualitative, subjective study aimed at elaborating on the particularities of the characteristics of managers is recommended.

