


 nova página do texto(beta)
 Inglês (pdf)
 Artigo em XML
 Referências do artigo
 Enviar este artigo por email
 Citado por SciELO
  Similares em
SciELO
Similares em
SciELO 
 Permalink
Introduction
The Pharmaceutical sector is the industry where a patent system is of paramount importance, promising substantial returns to successful innovation. However, the pharmaceutical sector is complex and unique. Aspects that contribute to the complexity of the sector include research and development (R&D) of a new molecule; products take a long time to develop. It takes 10 to 15 years on average to develop a new medicine from the early stages of compound discovery through the approvals of the U.S. Food and Drug Administration (FDA), F&D. U.S. (2015, 2016), the regulation, the public policies (industrial and health), the number and kinds of firms that operate and interact in the market and how those firms or entities interact.
The need for patent valuation: importance of patents
The effective patent term is short. It starts from the date the drug is registered, which is much earlier than the date the actual drug enters the market. The average effective patent life for medicines is 11.5 years following commercial launch. Also, the initial investment in R&D (research & development) is high, so the patent rights play a more crucial role in recouping the investments in new drugs. The average cost to develop a new medicine has been estimated at upward of US$2.6 billion, Grabowsky (2002, 2003, 2014, 2017), according to an analysis conducted by the Tufts Center for the Study of Drug Development. The drug is covered under patent protection, which means that only the pharmaceutical company that holds the patent is allowed to manufacture, market the drug and eventually make a profit from it. The drug development process is known to be complex, costly and time-consuming, Di Masi et al., (2003).
Patents and revenues
Patented drugs contribute over 70% of total drug sale revenues. The moment a drug goes off patent, companies suffer a noticeable impact on revenues. There was a bumpy ride for the industry in 2011-2012 when 16 major patents expired. This amounted to about $12 billion of 2011 revenues and over $30 billion of 2012 revenues, Pharma (2014). The lifetime of the patent varies between countries and also between drugs. Since the company applies for a patent long before the clinical trial to assess a drug’s safety and efficacy has commenced, the effective patent period after the drug has finally received approval is often around seven to twelve years.
Once the patent has expired, the drug can be manufactured and sold by other companies. At this point, the drug is referred to as a generic drug. According to guidelines in most countries, including those from the US FDA, generic drugs have to be identical to the branded drug in terms of efficacy, safety, usage, route of drug administration, pharmacokinetics and pharmacodynamics, Di Masi et al. (2003).
Innovation: The valuation of investment R&D projects through real options
Then the different processes and phases in the research and development of new products in the health sector are presented.
The phases of a drug development
The drug development phase is a long and demanding process that requires several different tests and phases cleared in order to obtain a final approval. Each phase can be seen as an option for you at the end of the phase have to take a decision on whether to discard the project or continue developing it (exercise the option). The decision is based on the prospects of the drug (the underlying asset) which test results reveal at the end of each phase.
The drug development process is very risky because it is difficult to know how long and how much it will take to get a phase approved as the research requirements are very different for different disease areas, Di Masi et al., (2003), Pharma (2014) and Grabowsky (2002, 2003, 2014, 2017). The following exposs the process of developing a new drug.
The discovery/lead optimization phase
The first phase is the discovery phase or lead optimization phase, F&D. U.S. (2015, 2016). A drug development often starts by either identifying a new biochemical compound to find out if it has a positive effect on a known disease or trying to find a cure or vaccine for a disease by testing different biochemical compounds on it.
On a more technical level, the biochemical compound is tested on human tissue in order to get an indication of an effect. If this indication is positive, the work for a chemical structure will continue so as to end up with a useable drug that has a therapeutic effect. These primary tests are purely in vitro tests, which mean that they are not performed on living organisms.
The preclinical stage
The next step in the process is the preclinical stage where the lead compound has been identified. In the preclinical stage, the scientists still do not have a lot of information on how it affects the targeted disease. The main goal at this stage is to get more information about the drug and its effects. At the same time, it is also important to obtain information about the negative things, most importantly, if any serious side effects exist. If all of these studies look good, the company will file an “Investigational New Drug” (IND) to the authorities to get approved for phase I. The IND contains all the information obtained at this stage along with a future plan for the clinical phases, which is the next step in the development process. At this stage, the research studies are still not performed on humans, but on animals.
Clinical Research
Drugs are tested on people to make sure they are safe and effective: Phase I, Phase II, and Phase III.
- Phase I
In phase I, the testing is performed on a small (20-80) group of persons, who at this point are healthy people. F&D. U.S. (2015). The aim of the research studies in phase I is to evaluate the effects the drug has on human beings and compare them to those found in the preclinical phase. But the most important thing is how well the drug handles the transition from being applied to animals to now getting applied on real human beings. Therefore it would be ideal that the picture of the test results obtained in the preclinical phase resembles the picture obtained when the drug is applied to human beings. The test results obtained in this phase are the foundation for the work that continues in phase II.
- Phase II
Phase II continues the work begun in phase I, but the tests in phase II include a larger group of test persons (100-300). Furthermore, a part of these people suffers from the disease in question. This is necessary in order to track the effects that the drug has on both sick people and healthy people and to find out how the drug acts in different settings. Phase II is often the phase where most applications are dropped (if the drug enters the preclinical phase). This is often because the drug does not have the efficacy. The rejection of the drug development project is often done by the company’s management at this stage, and not by the authorities.
- Phase III
The objective of phase III is to look at the long-term effects as well as the effects on a much larger scale. The group of test persons is increased severely now (1,000-3,000). This is done to increase the documentation of the effects found in the previous phases and to confirm the effectiveness of the drug, while still monitoring side effects, toxic level and so on. This is among the reasons for why the industry uses this divided phase process so it is possible to discard a project at an early stage due to bad test results.
Approval
When a company has completed all the phases it is time to file the entire information as a “New Drug Application”, NDA, to the European Medicines Evaluation Agency, Harvard Law Review (1995), EMEA. Then it is up to the authorities to decide whether the test results and the documentation are enough to approve the drug. Sometimes the documentation is not thorough enough, and the authorities will demand extra studies completed before a final decision can be made. In some cases, the authorities will accept the drug but still demand more test results. Therefore we can sometimes experience the use of a phase IV that covers this exact situation.
Patent
FDA monitors all drug and device safety once products are available for use by the public. The patent is used from the beginning of the process of research and development to protect the drug, Sereno (2010). The patent period is normally 20 years, but with an R&D period of normally 12 years, it only leaves 8 years with market exclusivity. Normally patent protection is sought in those countries where the company in question wants to market the drug. So for a larger company with consumers all over the world, the patent seeking process could end up as a rather expensive cost. Patent protection is basically a method for companies to devote many resources to the R&D process without the risk of generic competition when completed. The 20-year period is estimated to be long enough for the companies to cover all the R&D costs experienced during the development phases and still make a profit. After the 20-year period, the patent expires and the chemical structure is released on the market. With the chemical structure in hand, it is possible for other companies to make a generic copy of the product and sell it at a far lower price because they only need to be concerned about the manufacturing costs and not any R&D expenditures. The number of patents that companies seek varies a great deal and is, of course, dependent on the size of the company R&D expenditures, F&D. U.S. (2015, 2016).
Product lifecycle
The typical product life cycle for a normal drug development (assumed that it is approved and enters the market) is based on annual net incomes. When the product enters the market, the net income rises very much due to the patent-protected price, which generates a huge net income during the patent protected period. When the patent expires, the income of the product will drop instantly as a result of other players entering the market with an identical product offering, but at a fraction of the price, Rubio and Lamothe (2010).
Pharmaceutical Industry & Business Analysis
Table 1 shows the growth profile of the global pharmaceutical industry. The sales for 2015 amounted to over 1,000 billion, IMS Health (2016). These sales are mainly concentrated in the region of North America, and then followed by the European Union, Asia Pacific, Latin America remains a relatively low turnout of the world market.
Table 1 The growth profile and sales.
| A growth Profile, % | 2015 Sales in billion of dollars | The pharmaceutical market | The biotechnology devices/ hardware | Services for life science | |
|---|---|---|---|---|---|
| The global pharmaceutical industry | [4,8] | >1000 | 75.65% | 22.65% | 1.70% |
| Region of North America | 45.00% | ||||
| The European Union | 25.00% | ||||
| Asia Pacific | 24.00% | ||||
| Latin America | 3.80% | ||||
| Others | 2.20% | ||||
| Sales in billion | |||||
| Novartis | 50.38 | ||||
| Pfizer | 43.36 |
Source: Own author. Using information from IMS Health (2016) and financial statements of companies.
In the pharmaceutical industry dominated by large companies in developed countries, that power can be seen in its market share and control of global innovation.
At the enterprise level, it highlights in the first place the Novartis pharmaceutical in 2015 (Table 1 and 2) followed by Pfizer with sales of several billion of dollars (Pfizer remained in first place for several years until the year 2010 by the acquisition in 2001 Warner-Lambert in 2003 and Pharmacia in 2009 from Wyeth). In the third place, Rocher it appears, followed by Sanofi, Merck & Co., Johnson & Johnson, Glaxo SmithKline (GSK), AstraZeneca, Gilead Sciences and finally AbbVien in tenth place.
Table 2 The global pharmaceutical market
| Country | The global pharmaceutical industry |
|---|---|
| The United States | Pfizer |
| Johnson & Johnson | |
| Merc & Co. | |
| Gilead Sciences | |
| Abbvie | |
| England | GSK |
| Astra Zeneca | |
| Switzerland | Novartis |
| Roche | |
| France | Sanofi |
Source: Own author.
Thus, the top ten companies account for half of the global pharmaceutical market, where five companies are headquartered in the United States (Table 2), two in England, two in Switzerland and one in France.
Pfizer Inc. is a research-based, global biopharmaceutical company that discovers, develops, manufactures, and markets prescription medicines for humans and animals, as well as consumer healthcare products worldwide. Pfizer, whose corporate headquarters are located in New York, NY, got its start in 1849. Pfizer has now grown to be the top pharmaceutical in the United States and one of the top 10 in the world, New York, Pfizer (2015).
In this research, we present an analysis of Pfizer, Johnson & Johnson, Amgen and Eli Lilly, through several methodologies of real options to be offer the power of flexibility for the investors when they consider this methodology in their decision-making of big investments, according to the type of projects to be considered for their evaluation. Is presented two different methodologies to determine a capital budgeting; the advantage and disadvantages of assessment and the investor´s knowledge available going from traditional methodologies as a deterministic net present value to real options methodologies that provides flexibility in their decision-making.
Thus, as in a world of risk and uncertainty, it becomes a prudent assessment of the options that could lead to the project as part of a strategic planning that affects in a beneficial way for the company to minimize as much as possible, both elements. Besides, the incorporation of a fuzzy model into the traditional discrete-time binomial model, allowing operate and define the ambiguity underlying, through triangular or trapezoidal fuzzy numbers, particularly in order to estimate movements upward or downward as described Zdenek (2010); Liao and Ho (2010); Milanesi (2014), Cruz-Aranda, Ortiz-Arango and Cabrera-Llanos (Fall 2016).
The several methodologies used to differentiate and analyze the results of the financial evaluation of the investment in research and development in the pharmaceutical industry and provide to investors a more robust way for investment decision-making in an uncertain environment.
This research proposes the following hypothesis: “The valuation method of real options is a methodology of valuation of investment projects that allows top management to know the different options related to the same investment project and the cost of various alternatives that they can analyze and consider in their decision-making, each of them represents an excellent alternative in the process of evaluation and acceptance of the initiatives presented to the authority, with the objective of developing projects in the pharmaceutical industry, during a specific period. So, with additional knowledge to incorporate into its analysis the fuzzy logic, the evaluation is strengthened with its verification or corroboration presented in results and discussion section. It is important to note that the classic net present value of the investment project is also calculated, but it is a deterministic model in that managers cannot properly capture management´s flexibility to adapt and revise later decisions in response to market development and unexpected economic environment; while the real options give the executive the right, but not the obligation, to conduct certain business initiatives.” Thus, to obtain a set of results that will allow you to have different contributions and benefits in the pharmaceutical industry, showing its limitations and scope, including recommendations from experts in several periods of valuation of the pharmaceutical industry. We use information from Economatica (2016).
Methodology
We present different methodologies for project evaluation through a traditional deterministic net present value method that incorporate a discount rate denominated the weighted average cost of capital and the other as the real option methods that include the flexibility in the investment project.
Net present value of an investment project
Net present value of an investment project, I0, with expected cash flows CFi and brought to present value at a rate represented by the weighted average cost of capital (WACC), rWACC, It is given by the following equation:
The Net present value, NPV, has the limitation of not providing flexibility in their decision-making of investors because it’s a deterministic model with n cash flows. Therefore, for an investment project be feasible, the present value of expected cash flows discounted at rWACC should be greater than initial investment to keeping alive the investment option. Luehrman (1998) states that this methodology is now obsolete and it´s necessary to use other methodology. For this reason is necessary searching another alternative of valuation of the investment projects that give de investor more flexibility in decision-making.
Real Options Method in the evaluation of investment projects
Real Options analysis allows you to value risk, creating strategies to mitigate risk and how to position yourself to take advantage of risk, Mun (2002, 2006). The technique of real options valuation assumes that the world is characterized by change, uncertainty and competitive interactions between companies; and that their managers have the flexibility to review and adapt future decisions in response to changing circumstances. Real options incorporate this learning model, akin to having a strategic roadmap.
Real options give the executive the right, but not the obligation, to conduct certain business initiatives; which means added value for the investor, i.e. they provide a more informed decision on strategic projects, this is one of the reasons that real options valuation is a useful and robust tool used in valuation of investment projects and situations in which corporate managers are prepared to make the right decisions at the right time, (Dixit and Pindyck,1994), Stewart Myers was one of the first to use the term of Real Options in 1984, in his book “Finance Theory and Financial Strategy”; the pioneers of the use of this technique were the developers of mining and petroleum projects; development and production of mines or oil wells could be visualized as a series of linked options.
A lot of researchers have deepened in the field of real options, such as Brach Marion A. (2003), Mascareñas, Rubio, and Lamothe, (2010), Lamothe et al., (2004), Bailey, W. et al. (2004), Kulatilaka (1995), Smith Rob (2002), Boer (2002), Mun (2002, 2006, 2010), Arnold (2014, 2004) and Cruz-Aranda et al. , (Fall 2016) among others.
Myron S. Scholes and Fisher Black were in the early 70´s in the MIT Sloan School of Management with its famous Black & Scholes formula (1973a, b, Nobel laureate in economics in 1997) for European options. An important contribution to this formula is by Robert C. Merton with his argument of not arbitrage, so they were first to provide a closed-form solution for financial options, as well as Cox et al (1979) who introduced an equivalent discrete binomial valuation approach that has proved to be very powerful in complex options settings.
The transition from Capital Markets’ theory to Corporate Finance’ theory occurred in 1977, when Stewart C. Myers published his idea a real option can be thought as a promising investment opportunity that can be experiment a wholly unforeseen event at valuation time, stemming from existing company’s capabilities and its core competencies.
Trigeorgis (1993) discusses general properties concerning the nature of options interactions and the valuation of capital budgeting projects possessing flexibility in the form of multiple real options.
It was not until 1996 when they held the first successful attempts to make the theory of real options accessible to financial practitioners when Lenos Trigeorgis published his book Real Options, Managerial Flexibility, and Strategy in Resource Allocation. Amram and Kulatilaka (1999) in turn presented the subject from a more practical point of view in his book, also called Real Options. Meanwhile, Copeland and Antikarov (2003) offered a less quantitative approach to applied real options. Chevalier-Roignant and Trigeorgis (2011) added game theory with real options valuation in their planning to help predict how competitors would play certain strategies so companies are more flexible to know how to react. According to Rubio and Lamothe (2010) technique, real options turns out to be the best alternative for the valuation of companies related to innovation, such as the pharmaceutical industry, since this technique, despite its complexity, collects randomness and flexibility that characterize this sector.
The utility of real options are not only in valuing a firm through its strategic business options but also as a strategic business tool in capital investment make decisions, Arnold (2014). Ioulianou S. et al (2017) contribute to multinational and real options theories by considering the role of firm heterogeneity in real options awareness for multinational corporations. They test the joint impact of real options awareness and multinational on firm value using an extensive sample of U.S.A.
The use of real options in the valuation of investment projects, give the economic agents to evaluate flexibility or optionality that could have the project, either: to extend, postpone, amend or abandon it at a future date.
American options with binomial model: call and put
The underlying cash flows is CFrwacc, the
rwacc is rate represented by
the weighted average cost of capital, Arnold, and
Crack (2004), rWACC, the
value of exercise or delivery is K and it represents the
investment in the project at any time, the deadline is T-t, the
time period is δt, the underlying asset value can increase from
CF to CFu or decrease from CF to CFd, with
0 < d < 1 < u and the parameters u =
1/ d, where
The expected cash flow value given market information at time t is given by
E[CF | ft] =
CFerδt, where δt is
the time period considered and the risk free rate is r the
annualized rate, the probability that the cash flow goes up or down in the next
period is given by
Where D = debt, E = equity, r = tax rate, rE = cost of capital and rD = cost of debt.
The present value of the American put option is given by the next equation:
With 0 ≤ i ≤ N -1 y 0 ≤ j ≤ i and in which it has a probability p to move from the node (i, j) at time iδt to the node (i + 1, j + 1) at time (i + 1)δt, and with probability 1 -p to move from node (i, j) at time iδt to the node (i + 1, j) at time (i + 1)δt.
While the present value of American call option, is given by:
So, we can to construct the binomial tree of American call option.
Merton model on assets and real options
Fisher Black and Myron Scholes (1973 a, b) developed a model for valuing a European option on a stock that does not pay dividends; the stock price is led by a geometric Brownian motion. However, the model was extended to non-financial assets that are not publicly traded, these are called real assets. Let CFt the initial cash flow, K the project investment, r the rate of the risk-free rate, T-t represents the contract term, σ the volatility of returns produced by the expected cash flows of the investment project. It is assumed that the cash flows are brought to present value at WACC rate, and are guided by a stochastic differential equation at time t, and in particular, a geometric Brownian process, given by
Where µ is the average yield on cash flows. The European call option gives the holder the right to invest in the project whose expected cash flows are discounted at WACC rate, given the market information at time t, is:
Where,
The probability of expected cash flows at time T-t is:
Fuzzy model
Professor Lotfi A. Zadeh (1965) introduced the concept of fuzzy set, thus allowing for the elements of a set take different grades of membership, which can be mapped into the interval [0,1], to unlike classical theory of sets, which considers the membership of elements of a set in absolute terms, that is in the set {0,1}. The fuzzy model in discrete time is to adapt the traditional binomial model fuzzy logic; allowing operate and define the ambiguity of the underlying through triangular or trapezoidal fuzzy numbers, particularly in order to estimate movements upward or downward as it points (Muzzioli and Torricelli (2004), Yoshida et al., (2006), Zdenek (2010), Liao and Ho (2010), Wang (2007), Milanesi (2014), and Cruz-Aranda et al., (2016).
A fuzzy number A is a set μA of the real line, convex and normalized such that Ǝ x0 ϵ R and is such that μA (X0) = 1 and μ A continuous pieces. Then all fuzzy number is characterized by a membership function, membership, μA: R → [0,1] and all function as described, it produces a fuzzy number, where x ϵ R, μA (x) is the degree of membership of for fuzzy number . The function used in the process of evaluation, It is triangular membership’ function, Cruz-Aranda et al (2016), with the object of operating and define the ambiguity of the underlying of the option. The triangular membership function is given by
The fuzzy logic is considered in our evaluation study of the investment project of four firms in the Pharmaceutical Industry. The advantage of the fuzzy theory applied in valuation models by means of real options is that it allows the possibility of capturing a value from a lower end and growing linearly to a maximum value and decreasing linearly to the upper end of an interval, this being the base of the triangle and originating a set of possible project values. In this model according to Milanesi (2014) and Liao and Ho (2010), values upward and downward are determined considering the volatility of returns of cash flows and its coefficient of variation cv, i.e.:
The odds upward and downward are given by:
The sum of cash flows discounted at the WACC rate is determined by:
To apply the diffuse binomial model (Milanesi 2014), it requires estimation three grids (or binomial trees): The first fuzzy binomial grid corresponds to the performance of the underlying. To do this, it is considered the ratio of cash flows to present value of the project.
It is determined the reason given by
In the second fuzzy binomial grid projection fuzzy cash flows are calculated by incorporating the value of RF(i,j)t,j' in each node, i.e.
The third fuzzy binomial grid is calculated from the above grids and taking into amount equivalent to the assumptions of American call option. For this reason, to build the fuzzy binomial tree of American call option (in fact a real option), with its corresponding probabilities, the value of nodes are given by
With i = 1, k = 3, m = 1, i = 2, k = 2, m = 2, i = 3, k = 1, m = 3.
To determine the positive bias, to the right, it is considered λ= AD / (AI + AD), where AD is the area of the triangle to the right of VOB base and AI is the area of the left triangle that capturing the negative bias. The λ factor represent optimistic-pessimistic index is known by Yoshida et al., (2006). Then the expected value, E[VOBc], of the American option with fuzzy logic, based on the defuzzification algorithm in which the expectation value is calculated by centroid method (Zadeth 1965, Tucha and Brem 2006, Yu, Lean et al., 2009, Cruz-Aranda et al., 2016) we have:
Results and Discussion
Then the binomial trees of expected cash flows due to investment in research and development of new products aimed at the health of people, i.e. in the pharmaceutical industry are presented, in particular to Johnson & Johnson, Figure 1 and in Figure 2 the value of the American call. We concentrated the results in the Table 3 and 4 to: Amgen, Eli Lilly, Pfizer and Johnson & Johnson. In this project evaluation of investment in research and development it is discussed the possibility of postponing the project within the more than three years and with the possibility of exercise before the specified deadline. The results are described following tree methods: Deterministic Net Present Value, Black & Scholes, and Binomial trees with volatility (American call). In the next paragraphs, the fuzzy logic analysis described.

Source: Own author. Amounts are expressed in thousands of American dollars.
Figure 1 Binomial tree of the projected cash flows to three years, Johnson & Johnson.
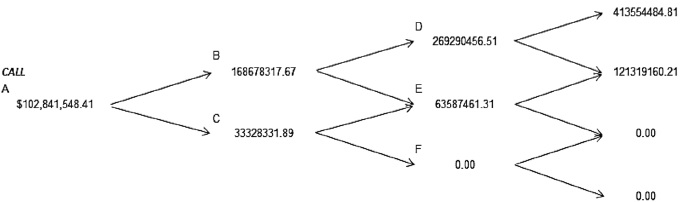
Source: Own author. Amounts are expressed in thousands of American dollars.
Figure 2 The values of the American Call for three years, Johnson & Johnson.
Table 3 The value of NPV, Call options with conventional methods
| Pharmaceutical sector | WACC | Net present value of project | Total Present Value of the expected cash flows of postponed project CF | Investment value updated to 3 years 91-day CETES.1 "Innovation" K |
|---|---|---|---|---|
| Amgen | 13.6393% | $6,427,185.82 | $105,070,357.09 | $98,643,171.27 |
| Eli Lilly | 10.4079% | $9,410,255.89 | $170,000,000.00 | $160,589,855.11 |
| Pfizer | 10.8300% | $26,549,297.27 | $400,000,000.00 | $373,45,702.73 |
| Johnson & Johnson | 8.5475% | $16,578,060.93 | $430,006,017.58 | $413,427,956.65 |
Source: Own author. Amounts are expressed in thousands of American dollars.
Table 4 Call options with conventional methods
| Pharmaceutical sector | Models | Call | % of investment |
|---|---|---|---|
| Black-Shoes model (European) | $47,967,554.85 | 48.63% | |
| Amgen | |||
| Binomial Trees with volatility, American | $50,525,039.20 | 51.22% | |
| Black-Sholes model (European) | $56,696,391.54 | 35.31% | |
| Eli Lilly | |||
| Binominal Trees with volatility, American | $59,602,601.05 | 37.11% | |
| Black-Sholes model (European) | $90,027,080.04 | 24.11% | |
| Pfizer | |||
| Binomial Trees with volatility, American | $92,716,500.91 | 24.83% | |
| Black-Sholes model (European) | $98,955,040.72 | 23.94% | |
| Johnson & Johnson | |||
| Binomial Trees with volatility, American | $102,841,548.41 | 24.88% | |
Source: Own author. Amounts are expressed in thousands of American dollars.
The WACC that is reported in Table 3 is calculated using equation (1). Table 3 shows that the net present value of the project is positive but it is a deterministic model in that managers cannot properly capture management´s flexibility to adapt and revise later decisions in response to unexpected market development; while the real options give the executive the right, but not the obligation, to conduct certain business initiatives. The financial statements of each of the companies in the period from December 31, 1995, to December 31, 2015, are used and forecasts are made of the expected cash flows of the investment project for a term of 20 years and brought to present value.
Shows the value of the purchase option obtained by different conventional methods.
Valuation of real option and fuzzy sets: Binomial Trees
Then cash flows are presented in a three-year period. The performance of the underlying given by

Source: Own author. Amounts are expressed in thousands of American dollars.
Figure 3 Binomial tree of the projected cash flows to three years, Johnson & Johnson

Source: Own author. Amounts are expressed in thousands of American dollars.
Figure 4 The value of the Call of real option, Johnson & Johnson
From the equation (5), the values of the real option in each period are:
Of the different methodologies used in the valuation of real options a concentrate of the results is as follows:
Table 5 Cash flow for every firm and the parameters in the model fuzzy.
| CF_rwacc | Investment, K | σ | R | C.V | |
|---|---|---|---|---|---|
| Amgen | $105,070,357.09 | $98,643,171.27 | 60.15% | 4.38% | 5.27 |
| Eli Lilly | $170,000,000.00 | $160,589,855.11 | 38.47% | 4.38% | 4.88 |
| Pfizer | $400,000,000.00 | $373,450,702.73 | 19.42% | 3.90% | 1.82 |
| Johnson & Johnson | $430,006,017.58 | $413,427,956.65 | 21.80% | 4.38% | 477.8 |
Source: Own author. Amounts are expressed in thousands of American dollars.
Table 6 Calculation of u´s, d´s, Pu´s and Pd´s by means of fuzzy analysis to four firms.
| Parameters in the binominal model fuzzy | |||||||||
|---|---|---|---|---|---|---|---|---|---|
| Amgem | Eli Lilly | ||||||||
| The upward | u1 | 0.6109 | Pu1 | 0.5771 | The upward | u1 | 0.7296 | Pu1 | 0.5083 |
| u2 | 1.8248 | Pu2 | 0.3891 | u2 | 1.4692 | Pu2 | 0.4618 | ||
| u3 | 5.4508 | Pu3 | 0.1635 | u3 | 2.9583 | Pu3 | 0.2697 | ||
| The downward | d1 | 1.6370 | Pd1 | 0.4229 | The downward | d1 | 1.3706 | Pd1 | 0.4917 |
| d2 | 0.5480 | Pd2 | 0.6109 | d2 | 0.6807 | Pd2 | 0.5382 | ||
| d3 | 0.1835 | Pd3 | 0.8365 | d3 | 0.3380 | Pd3 | 0.7303 | ||
| Pfizer | Johnson & Johnosn | ||||||||
| The upward | u1 | 0.852 | Pu1 | 0.414 | The upward | u1 | 0.8364 | Pu1 | 0.4199 |
| u2 | 1.2143 | Pu2 | 0.5536 | u2 | 1.2436 | Pu2 | 0.5476 | ||
| u3 | 1.729 | Pu3 | 0.4014 | u3 | 1.8489 | Pu3 | 0.3852 | ||
| The downward | d1 | 1.1725 | Pd1 | 0.5853 | The downward | d1 | 1.1956 | Pd1 | 0.5801 |
| d2 | 0.8235 | Pd2 | 0.4464 | d2 | 0.8041 | Pd2 | 0.4524 | ||
| d3 | 0.5784 | Pd3 | 0.5989 | d3 | 0.5409 | Pd3 | 0.6148 | ||
Source: Own author.
Table 7 The expected value of the American option with fuzzy logic.
| Pharmaceutical sector | Fuzzy binomial tree | |
|---|---|---|
| Amgen | VOBmin | $13,500,920.61 |
| VOBbase | $33,815,643.75 | |
| VOBmax | $332,515,908.96 | |
| Eli Lilly | VOBmin | $23,626,738.43 |
| VOBbase | $33,558,545.59 | |
| VOBmax | $101,891,854.92 | |
| Pfizer | VOBmin | $36,340,093.33 |
| VOBbase | $37,009,219.76 | |
| VOBmax | $38,834,945.13 | |
| Johnson & Johnosn | VOBmin | $78,275,663.15 |
| VOBbase | $82,728,438.76 | |
| VOBmax | $93,161,466.59 |
Source: Own author
Table 8 The expected value of the American option with fuzzy logic
| Pharmaceutical sector | Positive bias | Negative bias | Experts | |
|---|---|---|---|---|
| Optimistic | Pessimistic | |||
| LAMBDA | 0.9708 | 0.0292 | 0.6000 | |
| 1-LAMBDA | 0.0292 | 0.9708 | 0.4000 | |
| Amgen | ||||
| Fuzzy expected value option | 175.39% | 23.13% | 26.91% | |
| (Applied equation (4)) | No feasible | Feasible | Feasible | |
| LAMBDA | 0.8731 | 0.1269 | 0.6000 | |
| Eli Lilly | 1-LAMBDA | 0.1269 | 0.8731 | 0.4000 |
| Fuzzy expected value option | 39.08% | 20.90% | 23.37% | |
| (Applied equation (4)) | Feasible | Feasible | Feasible | |
| LAMBDA | 0.675 | 0.325 | 0.6000 | |
| Pfizer | 1-LAMBDA | 0.325 | 0.675 | 0.4000 |
| Fuzzy expected value option | 10.04% | 9.91% | 10.00% | |
| (Applied equation (4)) | ||||
| LAMBDA | 0.7009 | 0.2991 | 0.6000 | |
| 1-LAMBDA | 0.2991 | 0.7009 | 0.4000 | |
| Johnson & Johnosn | Fuzzy expected value option | 20.73% | 20.01% | 20.44% |
| (Applied equation (4)) | ||||
Source: Own author. Amounts are expressed in thousands of American dollars.
The value of the European option call extended to non-financial assets, Black & Scholes model, to postpone the innovation R&D project are between 23.94 % and 48.63% (Table 3, 4); while value of the American type real call option to postpone the project in research and development are between 24.83 % and 51.22% (Amgen, Eli Lilly, Pfizer and Johnson & Johnson) of the investment (Table 3, 4), and the value of real option, using fuzzy logic are between: 9.91% and 23.13% of the investment in a pessimistic scenario, and of the 10.04% and 39.08% of investment in an optimistic scenario (Table 5, 6, 7 and 8) these are better result. Note that the value of 175.39% is not feasible
Conclusions
The pharmaceutical sector is the industry where a patent system is of paramount importance, promising substantial returns to successful innovation. Pharmaceutical sector include research and development (R&D) a new molecules; products take a long time to develop and the projects are high risk, and in a world of uncertainty, it becomes prudent assessment of the options that could lead to the project as part of a strategic planning that affects beneficially for the company to minimize as much as possible the risk.
In this research the net present value of the project is positive, it means the investment is accepted, but it’s a deterministic model; while the real options give the executive the right, but not the obligation, to conduct certain business initiatives; the managers have the flexibility to review and adapt future decisions in response to changing circumstances.
Comparing the prices obtained of real option shows: From Black & Scholes’s model, it is observed that the options price, to postpone the project three years, R&D, are between 23.94 % and 48.63%; while value of the American type real call option to postpone the project in research and development for the innovation, R&D, are between 24.83 % and 51.22% (Amgen, Eli Lilly, Pfizer and Johnson & Johnson) of the investment (Table 3 and 4), and the value of real option. It has the advantage that it can be exercised at any time between the day of the subscription and the expiration time; the managers have the flexibility to review and adapt future decisions in response to the financial -economic environment.
On the other hand, fuzzy logic allows us to estimate the expected value of the American call option, in which has been considered a distribution function of triangular way, as well as a minimum value of the option, one maximum and another, base value, which incorporates volatility of cash flows and incorporated the coefficient of variation unlike only the minimum and maximum values. The payments on the option premium for Amgen, Eli Lilly, Pfizer and Johnson & Johnson are between 9.91% and 23.13% of the investment in a pessimistic scenario and of the 10.04% and 39.08% of investment in an optimistic scenario (Table 5, 6, 7 and 8) and for a experts scenario the option premium is between 10.00% and 26.91% of the investment, these are better results. The investor has the flexibility to exercise according to the financial-economic environment, what represent a great advantage for the investor. This kind of evaluation allows the membership relation of an element of a set change gradually and no discrete or absolute way as the classic theory of sets.
In turbulent and uncertain environments and competitive interactions between companies; Managers need to search methodologies to evaluate projects and capture the benefits of new opportunities or investment strategies and to mitigate the risk inherent in them. Fuzzy logic offers investors a more sophisticated and robust approach that helps them to support the results obtained and facing the challenge of infrastructure financing in the current economic scenario.
The future research lines will be focused on extending the analysis to various companies in the pharmaceutical sector.

