


Servicios Personalizados
Revista
Articulo
 texto en
  Inglés (pdf)
 Artículo en XML
 Referencias del artículo
 Enviar artículo por email
Indicadores
-
 Citado por SciELO
 -
 Accesos
Links relacionados
-
 Similares en
SciELO
Similares en
SciELO
Compartir

 Permalink
Contaduría y administración
versión impresa ISSN 0186-1042
Contad. Adm vol.64 no.1 Ciudad de México ene./mar. 2019
https://doi.org/10.22201/fca.24488410e.2018.1405
Articles
Methodological procedures for the study of restoration process servuctivos
1 Escuela Superior Politécnica Agropecuaria de Manabí, Ecuador.
2 Universidad Técnica del Norte, Ecuador.
3 Metropolitana de Santiago, Chile.
In this research addresses basic issues related to the management of services and within it the leading role of the servuction as service creation process. It is performed the design of a procedure that allows the deployment of the different stages leading to the implementation of the new service concept and methodological basis for implementation. Are applied tools like Delphi consensus method applied by working with experts to determine the attributes of service options that are valued by customers. The feasibility of using Matrix Importance - Perceived Presence to set priorities for improvement in those attributes that are most important to customers and are less suitable is also demonstrated.
Keywords: Restaurateurs services; Servuctivos processes; Service attributes
JEL Codes: M1; M31; M32
En la presente investigación se abordan cuestiones básicas relacionadas con la gestión de los servicios y dentro de ésta el papel rector de la servucción como proceso de creación del servicio. Se realiza el diseño de un procedimiento que permite realizar el despliegue de las diferentes etapas que conducen a la instrumentación del concepto del nuevo servicio y se presentan las bases metodológicas para su implementación. Se aplican herramientas de consenso como el método Delphi mediante el trabajo con expertos para la determinación de los atributos del servicio de restauración que son valorados por los clientes. También se demuestra la factibilidad de emplear la Matriz Importancia-Presencia Percibida para establecer las prioridades de mejora en aquellos atributos que sean más importantes para los clientes y que estén menos adecuados.
Palabras clave: Servicios restauranteros; Procesos servuctivos; Atributos del servicio
Códigos JEL: M1; M31; M32
Introduction
In the 1990s, the number of jobs in service organizations in industrialized countries such as the United States, France, Canada, Japan, and Great Britain increased from 60 to 80 percent. Several publications show how there has been a service-oriented shift in the economy, revealing that in 1984, for example, the service sector accounted for 66% of the US economy and 58% of that of the European Economic Community countries. In 1987, in Spain, the service sector accounted for 61.5% of the Gross Domestic Product (GDP); in 1993, in developed countries, services accounted for more than 60% of the GDP, with the sector generating the largest volume of employment (Grönroos, 1994).
Already in the 21st century, services account for 80% of the GDP in some countries. Paragraphs 1 and 2 describe in detail the composition of the economy in the 1990s, but do not make the same analysis of the current economy, which would highlight the general behavior or trend. It is important to support the growing behavior of the service-oriented economy with recent references.
This same behavior is manifested in less developed countries such as Cuba, Ecuador, Venezuela, Brazil, among others. This is why it is important to study the service systems and look for new ways to manage their servuction processes.
In a service company there are as many servuction models as there are services. In some service companies there are “traditional” servuction models with the intervention of the personnel and “automated” servuction models performed by the customer without having contact with the personnel. All of these have a common and, in general, unique element: the customer.
When we talk about production, we think of a factory and the manufacture of tangible goods. But is a service manufactured in the same way as any other good? The concept of service provides a particular vision of the management of companies, which is seen as the system of production of the service, that is, the visible part of the organization in which the services are produced, distributed, and consumed. This research aims to have this servuction approach.
The term “servuction” defines the process of service creation (Eigler and Langeard, 1989). These French teachers conceptualize servuction as “the production of service”. It is the systematic and coherent organization of all the physical and human elements of the customer-company relationship necessary for the performance of a service whose commercial characteristics and quality levels have been determined.
Servuction is all the tools behind providing good service. It is, therefore, important to study service systems and look for new ways to manage their servicing processes.
What does it take to manufacture a service? In short, one could say that you need labor, a physical support, and a beneficiary, i.e., a customer (Eigler and Langeard, 1989). For a simplified representation of a servuction system, the following elements are presented:
The customer. The costumer is involved in the manufacturing of the service. They are an essential element and their presence is vital.
Physical support. It is the necessary material support for the production of the service. It covers two categories: the necessary instruments for the service (furniture, machinery) and the material environment in which the service is developed (location, building, decoration).
Contact personnel. They are the people employed by the company who are in direct contact with the customers.
The service. It is the result of the interaction of the three basic elements: the customer, the physical support, and the contact personnel. This result constitutes a benefit that must satisfy the need of the customer.
The great difference between the manufacture of a service and the manufacture of a product is that the customer is a fundamental component of the service system: they are both producers and consumers. Therefore, it is key to understand the sequence of the acts of participation in the service that the customer carries out to benefit from the service offered.
Under the paradigm of this approach, evaluation from the perspective of the customer plays a preponderant role, for which Duque (2005) states that perceived quality and its evaluation depend on the specific characteristics of the service, of the customers, and of the context in which they develop, then the concept of service to be evaluated and its characterization must be considered. This implies that, as the representatives of the European and American schools of quality Grönroos and Parasuramant affirm, the perceived quality of services is the best way to conceptualize quality in the field of services (Parra Ferié, 2009). Stefano, Casarotto, Filho, and Godoy (2010) add that it is up to service providers to know the expectations of their customers in order to seek performance improvements that favor an always good perception, seeking to do research together with their customers in order to know and obtain continuous improvement, thus increasing the quality perceived by these customers.
In this sense Briceño and García (2008) argue that in the 21st century the customer is increasingly demanding in terms of compliance with minimum criteria of quality of service and the rights as a user, because they receive more information and because the components of competitiveness of companies (adequate standards of quality, quantity, costs, and time in the provision of services) increase the supply in the market for services, which makes it necessary to take maximum care to achieve customer satisfaction as a strength in the management of service quality.
Another important aspect to take into account in the management of services is the identification and measurement of tangible and intangible elements, through the use of different models for measuring service quality. Morillo Moreno et al. (2011) address issues that are still valid and were defined by authors such as Denton (1991) and Pride and Ferrel (1997), which raise the need to perform service quality measurement so that service providers know how their customers evaluate them.
The conceptual elements dealt with so far have a particular connotation in the foodservice processes, and it is necessary to look at them.
Foodservice activity can be summarized as the conversion of production factors (food, capital, work) through production and service, into products requested by a customer seeking consumption, satisfaction, and well-being (Cañizal, 1996 cited by Cisneros Mustelier and Hechavarría Viera, 2011). Consequently, Gómez (2006) proposes that it should be seen as a system that is comprised of three basic elements:
Material goods. They are comprised of the food itself, which is both the main element of each dish and the accompaniment. Their quality depends on the raw material used and on the set of processes that take place in foodservice, and which contribute to the quality of the offer.
The attributes of the product. They are determined by the elements that come with the food, which can be physical (furniture, cutlery, tableware) and in the form of service (friendliness of the employee, professionalism).
The extension of the product. It is the set of fulfillments that the customer presents as a result of the quality of the offer and the service received. It depends on the treatment received, the menu, and the ambience of the location. It is an element that allows assessing, in a general way, how the customer feels in the restaurant. One of the basic objectives of the restaurant is to satisfy the tastes and preferences of customers and to make it a pleasant experience; it is an obligatory consumption service, so the development of the same cannot be forgotten, if we take into account that the customer of the 21st century is becoming more demanding and their needs and expectations are increasingly higher.
It should also be noted that foodservice is complex, even more so if you want to provide an efficient service and at the same time generate profits, thus it is necessary to have a management with clearly defined objectives and the importance of having qualified personnel, committed to the work that they perform (Cisneros Mustelier and Hechavarría Veira, 2011).
It should be considered that two important elements converge in foodservice: the transformation of products for the preparation of the offer and the provision of the service, which are key processes because they are perceived by the customer and are the fundamental purpose of the organization (Espinosa, 2010).
Authors such as Betancourt Ramírez, Aldana de Vega, and Gómez Betancourt (2014) address three important elements for the comparative study of the performance of family and non-family restaurants, which have similarities with the research conducted, such as:
Quality: It includes the presentation, handling, and state of the food. It takes into account the presentation of the dish and beverages, temperature, taste, food and-for some dishes-the term or point of cooking, and originality in the presentation.
Service: It concerns the performance of the personnel, their capacity to assist the customer, the knowledge of the dishes on the menu, their politeness, agility, and punctuality.
Atmosphere: It includes elements such as decoration, theme, musical ambience, lighting, comfort of chairs, cleaning of the establishment, tableware, reception and façade; this according to the specialty of the restaurant.
The revised theoretical foundations allow the pertinence of the design of a procedure where it is possible to deploy the different stages that lead to the implementation of the concept of the new service, which will be discussed below.
Materials and methods
A cross-sectional or transversal correlational approach was applied for the development of the research, using scientific methods such as Analog, Induction-Deduction, and Analysis-Synthesis, through which the necessary information was gathered to arrive at the proposal of a methodological procedure for the design of servuction processes, taking into account the concept of the new service and its application in the field of foodservice.
Among the main techniques applied are the Delphi method for obtaining the attributes that characterize the restoration service process, Füller’s Triangle in pairwise comparison, and the Importance-Perceived Presence Matrix.
In the conception of the procedure it was taken into account that all the resources and energies of the company are dedicated to the realization of a service concept which is generally not formalized, as it evolves with time. It is, therefore, necessary to develop the formula of the new service.
Results
In order to arrive at the methodological procedure presented below, the formula of the new service was taken into consideration. It comprises five key decisions that are interested in the concept, segment, servuction, offer, and image (Hernández González, 2008).
A unique service concept
Service companies that want to become leaders cannot be satisfied with only having activities: they must also rely on strong concepts. To achieve this strength, they have to rely on a number of factors:
Creativity and mobilization of the concept: Creativity is indispensable and leads to a concept of service that is a coherent set of existing activities, known functions, different cultures, etc., that is to say, elements that until now have been separated. The mobilization of the energies of the company is both a necessity and a consequence, making it easier for the company to communicate the missions, function, and style of each one.
Concept and differentiation: Nowadays an activity is easily imitated, but a concept is difficult to imitate. The search for the concept of service is, therefore, based on specifying differentiation and communicating it to the customers. In this way, a strong concept will be obtained.
Unique concept: comprises originality and uniqueness. The concept of service draws its strength from its originality. To be original, it is not necessary to “revolutionize” the market. This means that it is also possible to be original (and that this originality is durable) by taking a set of elements that are known and have little impact separately, but together have a great power of anticipation. On the other hand, uniqueness is what confers the strength of market penetration and, for this, the concept must be unique. Good management will consist in choosing the best concept, which will be the one that best suits the market segment that is considered most interesting.
A unique and identifiable market segment
The segmented market approach: A service concept is a coherent response to certain types of needs. The concept cannot cover the entire market, rather it must follow a segmentation strategy.
Behavior variables and service attributes: In order to segment the market, behavioral variables must be taken into account in order to measure the profile of those who have the same need, as well as the situation in which the consumer finds themselves in.
Segment size and concept strength: The size of the segments varies greatly. A strong concept is one that involves the adhesion of a large number of consumers who are on the edges of the segment and who, by modifying their expectations and behavior, integrate the same.
A specialized and simple servuction
It is necessary to foresee in detail the functioning of the service and of its three main categories of components (personnel in contact, physical support, and customer) with the concern of preserving simplicity. This is necessary for two reasons: it favors the speed of development of processes, which is a competitive advantage that leads to success, and also allows customers to quickly learn what is expected of them.
It is also necessary to avoid the complexity of servuction, which is a danger for all large service systems.
A limited offer that is easy to structure
It must be a structured offer that responds to a double condition: on the one hand, to highlight the service that is perceived by the consumer; and on the other, to limit the number of peripheral services in order to maintain simplicity and, therefore, reliability of servuction. This is the most difficult field of decision to address.
A clear and easy to communicate service image
Given that services are intangible, it is a difficult task to create effective communication. Even if we use the media intelligently it will not be enough, as the image of the service also depends, and to a large extent, on the interaction of the company with its customers.
These customers, in turn, spread the image when they share their experience with the environment and, if the image they perceive is positive, it will greatly benefit the company. This is one reason why the image must be very clear. Image is also a key decision that depends heavily on the other four decision fields. If the concept is not unique and simple, the image will not be clear and meaningful.
Procedure for the design of servuction processes
Figure 1 shows the procedure with the stages or steps to be completed to carry out the design of a servuction process, bearing in mind the concept of the new service.

The first stage of the procedure is the diagnosis and characterization of the object of study. According to (Hernández Torres, 2008), the diagnosis should be used to act ahead of the processes, before the deviations occur, indicating the possible obstacles that will oppose the strategic course set, creating the conditions for the results to coincide with the objectives, in accordance with the characteristic of modern management control. This refers to the fact that it should be directed more towards the future as a prospective management control.
In this procedure the diagnosis consists of carrying out a characterization of the object of study, which goes from the general to the particular. Performing an analysis of customer satisfaction with the process. The possible techniques to apply in this first stage are: analysis and information gathering techniques, surveys to measure customer satisfaction with the process, method of the experts, Cause-Effect analysis, and Flowchart.
The second stage of the procedure is the structuring of the service system. The set of elementary, base, and peripheral services are related entities that form a system. The elements of the system are formed by each elemental service and its servuction, all of which have a common element: the customer. At this stage, the system must be structured so that all the processes and subprocesses are aimed at the customer and their satisfaction. Possible techniques to apply are: survey technique, flowcharts, and others.
The third stage of the procedure consists in applying the concept of servuction and of the new service; defining the exact idea of the service to be performed.
Servuction processes are all those where a service is performed or provided by the organization, with the participation of the customer as beneficiary of the service and represented through its property, which interacts with the contact staff on the basis or use of a physical support (Parra Ferié, 2009).
The proposal is based on relating the five key decisions that must be made before applying the concept of new service:
Concept, which understands key and essential characteristics in its use, these being creativity, originality, and differentiation.
Segment, where only one profile must be covered, and not the entire market, to be more objective in the way to proceed at the time of providing a service.
Servuction, which should be specialized and easy to simplify, within it we find the contact staff, the physical support, and the customer.
Offer, limited and easy to structure in order to avoid committing mistakes and creating a structure that is not the most adequate for the demand.
Image, one of the decisive factors in the creation of a service is communication. If the image is not clear and easy to communicate it will not create interest and what is not interesting is not bought. These key decisions must be taken into consideration in the whole process and in each of the actions executed during the same.
The possible techniques to apply in this stage are: analysis and information gathering techniques, market segmentation, benchmarking, servuction diagram, among others.
The fourth stage of the procedure is the identification and prevention of errors, after the analysis of the deviations. Action is taken at the service execution stage to prevent errors from becoming defects. If it is not possible to prevent the risk, then at least it should be detected. (Parra Ferié, 2009).
Error control has a direct impact on the results of the process. The follow-up given to the possible errors will allow the person in charge of each subprocess to make decisions. Of these, the five key decisions should not be overlooked. The prevention of errors is in itself an opportunity to improve the process. It is for this reason that the proposal is to apply an information gathering model according to Parra Ferié (2005) that makes it possible to identify Improvement Opportunities.
The cause analysis is the basis for timely and effective decision-making. The execution of the selected action projects must be controlled, evaluating the results at the local level, in order to evaluate the effectiveness of the improvement process on the fulfillment of the objectives initially proposed to the entity in the time horizon considered.
The fifth and final stage of the procedure is the implementation of the design.
As indicated by Amozarrain (1999), “the implementation phase can be prolonged in time, therefore, it is necessary to develop a concrete plan with the definition of those responsible and deadlines for each of the milestones”.
At this stage the process approach is fundamental. Authors such as Harrington (1998), Medina León and Nogueira Rivera (2012) emphasize the need to define the internal processes of the organization, as a way of aligning projected results with organizational objectives.
Before implementing the new process, it is necessary to reflect on the possible resistances to change and the possible countermeasures to be adopted, among which the following can be mentioned:
Communicate and involve the people who will be involved in the implementation of the new process
Provide the necessary training
Pick the right moment
Develop a progressive implementation: it is sought to start this with the most receptive people and with the most prestigious among their peers
In the schematic representation of the procedure presented in Figure 1, it is possible to appreciate the feedback that starts from the implementation until the diagnosis.
Analyzing the influence of other external processes that influence the proper functioning of the process is an aspect of the procedure of unavoidable importance, since these are interrelated in a whole and comprise the system, where communication plays a key role.
Partial application of the procedure in the study of the Food and Beverage process of Hotel Playa Caleta in Varadero.
As a practical validation of the procedure exposed above, the partial application of the same in Hotel Playa Caleta in Varadero is shown below, determining the Level of Service offered from a series of analyses conducted with a team of experts previously selected for this purpose. A set of techniques and tools were applied that allowed important conclusions to be reached concerning the quality of the service offered in the Food and Beverage process.
The Delphi method was applied to determine the attributes of the restoration service by the team of experts in the field of service management and, more particularly, in the field of restoration; the characteristics of the Delphi method were conducive to its instrumentation in research.
This method is developed through rounds and, as an additional advantage, it is not necessary to match the experts in the same time and place, making it possible to use experts located in different geographical locations. The experts referred to at this stage are selected specialists who make up the working group.
Authors such as Nogueira Rivera (2002), Negrín Sosa (2003), Parra Ferié (2009), and Diéguez Matellán (2008) recognize the need to endorse the degree of knowledge and reliability of the experts based on the application of the questionnaire of Competence of the Expert, which is a very useful instrument, particularly when it is required to gather information from the experience and knowledge of a group of people related to the object of the research.
Due to practical reasons, considering that this instrument is based on the assessment of the expert, the following variables were considered in the selection:
Experience in the marketing or provision of food and beverage services: this variable is fundamental, as it attributes a strong reliability to the arguments put forward by each expert.
Current professional training: the idea that with greater knowledge and a greater degree of professionalism within a service company there will be a higher level of offered service, considering it as a dominant variable for the process.
In the expert selection process, the competence coefficient must meet the condition of K ≥ 0.7, obtaining the results shown in Table 1, after processing the information collected on the candidates to join the group.
Table 1 Expert Competence Coefficients.
| Experto | E1 | E2 | E3 | E4 | E5 | E6 | E7 |
|---|---|---|---|---|---|---|---|
| Competence Coefficient | 0.73 | 0.85 | 0.70 | 0.87 | 0.92 | 0.81 | 0.89 |
Source: Own elaboration
As can be seen, the candidates show an adequate competence coefficient, thus the group of experts consisted of 7 specialists in the area.
Determination of the variables or attributes of foodservice
For the study of the foodservice process it is necessary to define the variables or parameters that characterize it and that are valued by customers during its consumption.
Among the various methods for making unstructured decisions about a system of variables to characterize an attribute that is as intangible as the benefits sought by customers in the food and beverage process, the Delphi method is considered useful and relevant based on the following:
The number of factors considered by a group is greater than what could be taken into account by a single person. Each expert will be able to contribute to the general discussion of the idea that they have on the topic debated from their area of knowledge.
Inability to bring all the experts together in the same place and at the same time
The professional condition of avoiding unipersonal criteria or individual subjectivity that could undermine the credibility and reliability of the investigation
In the first round of the Delphi method analysis, the experts were presented with an initial list of variables in order to decide whether they were sufficient to define the benefits sought by consumers, or whether any needed to be added or modified
In the second round, the variables resulting from the previous round were listed and presented to the experts, who were asked to vote according to the established procedures, that is, mark with “1” those elements with which they agree and with “0” those with which they do not agree.
In this step, the concordance coefficient is calculated for each of the variables under study, using the following expression:
Where:
Cc: Concordance coefficient expressed as a percentage
Vn: Number of negative votes
Vt: Total number of votes
The variables that meet the condition of having a concordance coefficient greater than 0.7 are selected.
The analysis carried out by the experts is shown below:
Table 2 Votes made by the experts.
| Variables | E1 | E2 | E3 | E4 | E5 | E6 | E7 | Negative votes by variable | Concordance by variable | Selection |
|---|---|---|---|---|---|---|---|---|---|---|
| Visibility of the facilities from the outside | 1 | 0 | 1 | 0 | 1 | 0 | 1 | 3 | 0.571 | Eliminated |
| Physical qualities of the facilities | 1 | 1 | 1 | 1 | 0 | 1 | 1 | 1 | 0.857 | Selected |
| View | 0 | 0 | 1 | 1 | 0 | 0 | 1 | 4 | 0.428 | Eliminated |
| Easy access | 0 | 0 | 1 | 0 | 1 | 0 | 1 | 4 | 0.428 | Eliminated |
| Communication and publicity of the product | 1 | 1 | 1 | 1 | 0 | 1 | 1 | 1 | 0.857 | Selected |
| Variety, type of cuisine/specialty | 1 | 1 | 1 | 1 | 0 | 1 | 1 | 1 | 0.857 | Selected |
| Type of service | 1 | 1 | 1 | 1 | 1 | 1 | 1 | 0 | 1 | Selected |
| Ambiance/Atmosphere of the place | 1 | 1 | 1 | 0 | 0 | 1 | 1 | 2 | 0.711 | Selected |
| Air condition | 1 | 0 | 1 | 1 | 1 | 1 | 1 | 1 | 0.857 | Selected |
| Service hours | 1 | 0 | 1 | 0 | 1 | 1 | 1 | 2 | 0.711 | Selected |
| Entry requirements | 0 | 0 | 1 | 0 | 0 | 0 | 0 | 6 | 0.142 | Eliminated |
| Quality-price ratio | 1 | 1 | 1 | 1 | 1 | 1 | 1 | 0 | 1 | Selected |
| Service quality | 1 | 1 | 1 | 1 | 1 | 1 | 1 | 0 | 1 | Selected |
| Skills shown by the personnel | 1 | 1 | 1 | 1 | 1 | 1 | 1 | 0 | 1 | Selected |
| Visibility of the preparation | 0 | 0 | 0 | 0 | 1 | 1 | 1 | 4 | 0.428 | Eliminated |
| Complementarity of wine services | 1 | 1 | 1 | 0 | 1 | 0 | 1 | 2 | 0.711 | Selected |
The selected variables or attributes that characterize foodservice are:
Physical qualities of the facilities
Communication and visibility of the product
Variety, type of cuisine/specialty
Type of service
Ambiance/atmosphere of the place
Air conditioning
Service hours
Quality-price ratio
Service Quality
Skills shown by the personnel
Complementarity of wine services
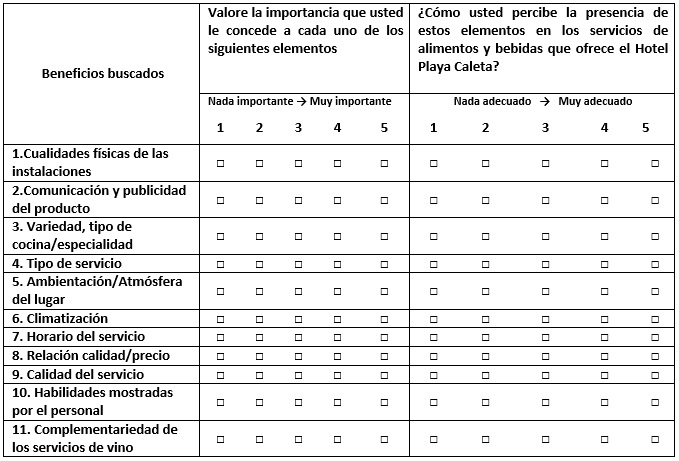
Once the attributes were defined, the survey was applied to the customers. In it they had to weigh the level of importance they give to each attribute and the level of perceived presence, that is, the extent to which they perceive the presence of this attribute in the foodservice they consume.
The survey was designed based on a 5 point Likert scale that will be used to evaluate both Importance (1=Not Important, 2=Of Little Importance, 3=Moderately Important, 4=Important, and 5=Very Important) and the Degree of perceived presence (1=Not at all adequate, 2=Poorly adequate, 3=Moderately adequate, 4=Adequate, and 5=Very adequate), given that Diéguez Matellán (2009), Pérez Gosende (2009), and Carreras Iler (2011) refer to it as one of the most used scales in commercial investigations and it is considered to cover all the existing criteria.
The table below shows the applied instrument, which was checked for reliability and validity by measuring the Cronbach’s Alpha coefficients (α) and the Multiple Regression Coefficient (R2), respectively.
The values obtained with the use of the statistical package SPSS version 20.0 were: Cronbach’s Alpha equal to 0.941 and R2 equal to 0.919, both values being higher than 0.70, demonstrating that the instrument is reliable and valid.
This survey is complemented with the Importance-Perceived Presence Matrix of the attributes of foodservice studied.

The proposal by Mantilla and James (1977) was the precursor to this matrix for the study of the image of tourist destinations. Shetna (1982) determined that the greater the difference between the importance given to an attribute and adequacy in a given product, the greater the dissatisfaction of the consumer towards the product and, therefore, the need to take corrective action.
It is a procedure that shows the relative importance of several attributes and their degree of perceived presence. In this way, the use of an analysis of this type can be of great help to those responsible for tourism management, since it facilitates the identification of aspects or attributes to which greater attention should be devoted, assigning them more resources and programs to improve.
The graphical representation is made on a coordinate axis, the origin of which is the mean value obtained for all attributes in terms of their importance and degree of perceived presence of the attribute, although the degree of perceived presence of the attribute can also be assigned a desired level. The data are presented in maps in which each attribute is located according to the value given to its importance and degree of perceived presence. The graphical representation of the data requires each attribute to be located in one of the four cells, facilitating a quick and visual evaluation of the attractive attributes of the object of study.
The results of the survey applied to a sample of customers of the Hotel under study are located in the Importance-Perceived Presence Matrix, thus being able to establish the priorities for the improvement in those attributes that are more important for the customers and that are less suitable, as shown in Figure 4.

Source: Own elaboration
Figure 4 Location of the values obtained from the survey applied to customers in the Importance-Perceived Presence Matrix
Improvement actions to increase the perceived presence of these benefits in the process should focus on the benefits found in the quadrants: High Importance - High Degree of Perceived Presence (strengths of the process) and High Importance - Low Degree of Perceived Presence (critical points), as well as on the existing gap in each of them.
Key:
Physical qualities of the installations
Communication and publicity of the product
Variety, type of cuisine/specialty
Type of service
Ambiance/Atmosphere of the place
Air conditioning
Service hours
Quality-price ratio
Service Quality
Skills shown by the personnel
Complementarity of wine services
Similarly, it was possible to determine the existing gaps between what customers perceive (current state) and what they would like (desired state), which is shown in Figure 5.
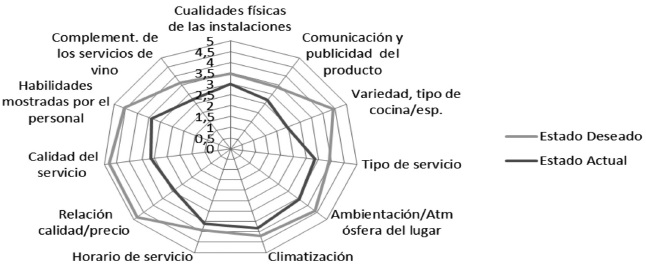
For the surveyed customers of Hotel Playa Caleta, the previous graph shows that the total benefits sought considered in the study receive scores of the degree of perceived presence below their importance, that is, for this group of consumers the service offered by Food and Beverages business did not satisfy any of the benefits sought by them.
The benefits that have a negative gap between what the customer wants and what the customer currently perceives are shown in Table 3. In all cases there is a negative gap between the two states, which indicates that the customers are dissatisfied with each of the benefits sought.
Table 3 Differences between the current state and the desired state of the customers.
| Benefits sought | Desired State | Current State | Gap |
|---|---|---|---|
| 1-Physical characteristics of the facilities | 3.46 | 3.01 | -0.45 |
| 2-Communication and publicity of the product | 3.4 | 2.68 | -0.72 |
| 3-Variety, type of cuisine/specialty | 4.43 | 2.45 | -0.98 |
| 4-Type of Service | 3.93 | 3.35 | -0.58 |
| 5-Ambiance/Atmosphere of the place | 4.39 | 3.55 | -0.84 |
| 6-Air Conditioning | 4.19 | 3.83 | -0.36 |
| 7-Service hours | 3.91 | 3.6 | -0.31 |
| 8-Quality-price ratio | 4.82 | 2.92 | -1.9 |
| 9-Service Quality | 4.78 | 3.15 | -1.63 |
| 10-Skills shown | 4.55 | 3.38 | -1.17 |
| 11-Complementarity of wine services | 3.64 | 2.7 | -0.94 |
Source: Own elaboration
Once the measurement of the perceived importance and degree of presence has been obtained, as well as the existing gap between the current state and the desired state of each benefit sought, will it be possible to define the opportunities for their improvement depending on the current position occupied. This could constitute an important point of support for decision-making related to the planning and execution of improvement actions to maintain or improve the current state at the desired level.
It can be observed in the matrix that the benefits located in the High Importance - High Degree of Perceived Presence quadrant are: quality of service, skills shown by personnel, ambiance/atmosphere of the place, and air conditioning. Even though the main strengths of the service are in this quadrant, it is necessary to highlight that all of these attributes or benefits have a score below “4” points and, in all cases, they are also perceived below the importance given to them. Therefore, they constitute the highest priority to improve the Food and Beverage service.
In the High Importance - Low Perceived Presence quadrant, the benefits are: quality-price ratio and variety, type of cuisine/specialty. The weaknesses of the service are identified here, which require special attention. Considering the results obtained from the analysis of the first quadrant, these attributes constitute the second priority.
In the Low Importance - Low Degree of Perceived Presence quadrant, the attributes are: physical characteristics of the facilities, communication and publicity of the product, and complementarity of wine services. Here are the attributes evaluated with a low degree of perceived presence and which have low priority for the customer.
In the Low-Importance - High Degree of Perceived Presence quadrant, the attributes are: type of service and service schedule. In these benefits the service has an irrelevant superiority, since the customer gives them little importance.
As a result of the analysis using the Importance-Degree of Perceived Presence Matrix used in the procedure, it was possible to visualize the strong points of the service from the perspective of the customers who consume it, as well as the critical points, as shown in Table 4.
Table 4 Benefits or attributes that constitute strengths and weaknesses of foodservice. Source: Own elaboration.
| Strong point | Gap | Weak points | Gap |
|---|---|---|---|
| Service quality | -1.63 | Quality-price ratio | -1.9 |
| Skills shown by the personnel | -1.17 | Variety, type of cuisibe/specialty | -1.98 |
| Ambiance/atmosphere of the place | -0.84 | ||
| Air Conditioning | -0.36 |
The gap or opportunity for improvement for each benefit sought is also considered, which is a significant point of support for Hotel Playa Caleta in Varadero in making decisions related to the provision of its services in the Food and Beverage process.
The benefits that represent strong points for the services of the process, according to the aforementioned analysis, show a negative gap that demonstrate that despite the strong points in the service they constitute improvement opportunities for the same, with the objective of being able to fulfill the expectations of the customers, strengthening those benefits that have a better perception in relation to the rest of them.
In the case of the benefits that constitute weaknesses in the process, special attention must be paid to them since they represent the worst rated attributes by the customer and are those that most negatively influence the service provided by the hotel. According to the analysis carried out, the improvement actions to increase the perceived presence of these benefits in the process must focus on the benefits that are located in the quadrants of high importance - high degree of perceived presence (process strengths) and high importance - low degree of perceived presence (critical points), as well as on the gap existing in each of them.
The improvement program must be based on those benefits that are most important for the customers, and that obtain an adequate degree of perceived presence in order to maintain their main competitive strengths. Among these, the main ones to focus on are: benefits such as quality of service, skills shown by the personnel, ambience/atmosphere of the place, and air conditioning.
It is worth pointing out that although these benefits constitute the strengths of the process, the highest priority for improvement should be given to them, since, overall, they present a negative gap between the two states. The critical or weak points of the process (high importance - low degree of perceived presence quadrant) must be managed in the same way, since they represent the dissatisfaction level of the customers with a low degree of perceived presence in the benefits sought by them, which in order of priority are focused on: quality-price ratio and variety, type of cuisine/specialty.
The second stage of the procedure is to determine the Level of Service offered with the application of the method proposed by Conejero et.al. (2008) from the multiplication of the weight or degree of importance of the attributes and their evaluation by the customer. To determine the weight or degree of importance of the attributes, paired comparison methods such as Füller’s Triangle, Expert Choice, among others, can be applied. In order to do this, it was first necessary to determine the weight of each criterion according to the experts, applying the Modified Füller’s Triangle.
To carry out this pairwise comparison, a criterion-criterion matrix is elaborated, where the preferences are obtained in each pair of criteria (1 means that criterion i is more important than criterion j).
Table 5 Criterion-Criterion Matrix.
| C1 | C2 | C3 | C4 | C5 | C6 | C7 | C8 | C9 | C10 | C11 | |
| C1 | 1 | 1 | 0 | 0 | 0 | 0 | 1 | 0 | 0 | 0 | 0 |
| C2 | 0 | 1 | 0 | 0 | 0 | 0 | 1 | 0 | 0 | 0 | 0 |
| C3 | 1 | 1 | 1 | 1 | 2 | 1 | 1 | 0 | 0 | 1 | 1 |
| C4 | 1 | 1 | 0 | 1 | 2 | 1 | 1 | 0 | 0 | 0 | 1 |
| C5 | 1 | 1 | 0 | 0 | 2 | 1 | 1 | 0 | 0 | 0 | 0 |
| C6 | 1 | 1 | 0 | 0 | 0 | 1 | 1 | 0 | 0 | 1 | 0 |
| C7 | 0 | 0 | 0 | 0 | 0 | 0 | 1 | 0 | 0 | 0 | 0 |
| C8 | 1 | 1 | 1 | 1 | 1 | 1 | 1 | 1 | 1 | 1 | 1 |
| C9 | 1 | 1 | 1 | 1 | 1 | 1 | 1 | 0 | 1 | 1 | 1 |
| C10 | 1 | 1 | 0 | 0 | 1 | 0 | 1 | 0 | 0 | 1 | 0 |
| C11 | 1 | 1 | 0 | 0 | 1 | 1 | 1 | 0 | 0 | 1 | 1 |
The following table shows the respective values and the subjective weight resulting from each criterion:
Table 6 Subjective weights of the criteria.
| Criteria | Σ | W | Weight (%) |
|---|---|---|---|
| 1-Physical characteristics of the facilities | 3 | 0.05 | 5 |
| 2-Communication and publicity of the product | 2 | 0.03 | 3 |
| 3-Variety, type of cuisine/specialty | 9 | 0.14 | 14 |
| 4-Type of service | 7 | 0.11 | 11 |
| 5-Ambience/Atmophere | 5 | 0.08 | 8 |
| 6-Air Conditioning | 5 | 0.08 | 8 |
| 7-Service hours | 1 | 0.02 | 2 |
| 8-Quality-price ratio | 11 | 0.17 | 17 |
| 9-Service quality | 10 | 0.15 | 15 |
| 10-Skills shown by the personnel | 6 | 0.09 | 9 |
| 11-Complementarity of wine services | 7 | 0.11 | 11 |
After finding the weight of each criterion it was concluded that the order of importance is as follows:
Quality-price ratio
Service quality
Variety, type of cuisine/specialty
Type of service
Complementarity of wine services
Skills shown by the personnel.
Ambience/atmosphere of the place
Air Conditioning
Physical characteristics of the facilities
Communication and publicity of the product
Service hours
Once the weight has been determined, the frequency of each of the criteria is calculated using SPSS software version 20.0 to determine the score or evaluation of the attribute, as shown below:
Table 7 Scores obtained for each attribute.
| Attribute | Score |
|---|---|
| Physical characteristics of the facilities | 3 |
| Communication and publicity of the product | 2 |
| Variety, type of cuisine/specialty | 2 |
| Type of service | 3 |
| Ambience/atmosphere of the place | 4 |
| Air Conditioning | 5 |
| Service hours | 4 |
| Qualityt-price ratio | 4 |
| Service quality | 9 |
| Skills shown by the personnel | 3 |
| Complementarity of wine services | 4 |
Once the necessary values are known, the Service Level is calculated, obtaining a level of service offered of 70% which, when compared with the standards established by the chain (92.25%) for a 4-star Hotel, is 22.25% below.
The attributes that most affect the obtained result and that must be considered to decrease their impact are:
Communication and publicity of the product
Service hours
Physical characteristics of the facilities
Variety, type of cuisine/specialty
Skills shown by the personnel
Ambience/Atmosphere of the place
Type of service
Air Conditioning
Complementarity of wine services
Service quality
Quality-price ratio
According to the analysis carried out, and in order to achieve an improvement in the Food and Beverage processes, the improvement actions to increase the perceived presence of the attributes in the process must focus on the benefits located in the High importance - High degree of perceived presence (Process strengths) and High importance - Low degree of perceived presence (Critical points) quadrants of the matrix analyzed above, as well as on the gap existing in each of them, which reflect how far it is from fulfilling the desires of the customer.
The improvement program must be in function of those benefits that are most important for the customers, and that obtain an adequate degree of perceived presence with the objective of maintaining their main competitive strengths; among them are benefits such as: service quality, skills shown by the personnel, ambience/atmosphere of the place, and air conditioning.
It is worth noting that although these benefits constitute the strengths of the process, the highest priority for improvement should be given to them, since they present a negative gap between the two states overall. The critical or weak points of the process must be managed in the same way, since they represent the level of dissatisfaction of the customers with a low degree of perceived presence in the benefits sought by them. These are, in order of priority: quality-price ratio and variety, type of cuisine/specialty, containing a gap of -1.9 and -1.98, respectively. Based on the diagnosis and analysis of the situation, the entity must propose an improvement plan that addresses the problems encountered.
Discussion
Service systems in their complexity comprise several types of services (base, base derivatives, and peripheral) in which decisions are made around the costumer. Decisions concerning the services of each of the elementary services lead to the quality of the overall service, where servuction is defined as the creative process of elaborating a service.
For the correct design of a servuction process it is necessary to have carried out a study of the attributes that must be present in the service provided, which are evaluated by the customers; this analysis makes it possible to obtain the gaps or deviations in relation to the presence perceived by them and which must be incorporated into the improvement plan of said process.
It is pertinent to apply the new service formula in foodservice, which comprises five key decisions that focus on concept, segment, servuction, offer, and image, all of which have a direct impact on the level of service offered.
Conclusions
There is a growing theoretical-conceptual basis on the management of foodservice, however there are still spaces for theoretical and practical research in relation to the application of the servuction approach as a way to achieve a better performance of the entities that provide it.
The previous studies consulted supported the relevance of the research carried out and the need to design a methodological procedure for the study of foodservice processes, which integrates different approaches to service management such as quality, servuction, marketing, and processes, with the implementation of the new concept of service being possible.
Based on the work with experts and the application of the Delphi method, it was possible to determine the 11 attributes that characterize the process of foodservice, through which it was possible to determine the level of presence of these and their incidence in the quality perceived by customers.
It was possible to determine the level of service offered with a value of 70% from the multiplication of the weight or degree of importance of the attributes and their evaluation by the customer. To this end, it was necessary to determine the weight of each criterion according to the experts, applying the Modified Füller Triangle. This Service Level value is 22.25% below the chain standard for a 4-star hotel, highlighting the shortcomings detected.
The analysis of the results of the assessment by the customers regarding the level of importance and the degree of perceived presence of the attributes of the foodservice that they have consumed was complemented with the application of the Importance-Degree of Perceived Presence Matrix, which made it possible to establish priorities for improvement in those attributes that are most important for the customers and that are less adapted.
Referencias
Aboal, D. et.al. (2009). La innovación y la nueva economía de servicios en América Latina y el Caribe Retos e implicaciones de política. Editorial Manosanta Desarrollo. Centro de Investigaciones Económicas CINVE, Uruguay. [ Links ]
Amozarrain (1999) La gestión por procesos. Editorial Mondragón Corporación Cooperativa. España. [ Links ]
Betancourt-Ramírez, José Bernardo; Aldana-de-Vega, Luzangela; Gómez-Betancourt, Gonzalo (2014). Servicio, ambiente y calidad de restaurantes en Bogotá. Estudio comparativo de empresa familiar y empresa no familiar. Revista Entramado, 10(2), 60-74. ISSN: 1900-3803. Universidad Libre. Colombia. [ Links ]
Briceño de Gómez y García de Berrios (2008). La servucción y la calidad en la fabricación del servicio. Revista Visión Gerencial. 7(1),21-32. ISSN: 2477-9547. Universidad de los Andes. Venezuela. [ Links ]
Cisneros Mustelier y Hechavarría Veira (2011) Factores que inciden en el costo de un servicio de bufet en un hotel citadino. Revista Contaduría y Administración. 233, 55-72. ISSN 0186-1042. Universidad Nacional Autónoma de México. [ Links ]
Diéguez Matellán, E. (2008). Contribución a la planificación de servicios complementarios extrahoteleros en destinos turísticos. Aplicación Varadero. Tesis presentada en opción al grado científico de Doctor en Ciencias Técnicas. Universidad de Matanzas. Cuba. [ Links ]
Denton, K (1991). Calidad en el servicio a los clientes. Ediciones Díaz de Santos S.A. España. [ Links ]
Duque Oliva, E. (2005). Revisión del concepto de calidad del servicio y sus modelos de medición. Innovar, Revista de Ciencias Administrativas y Sociales 15 (25), 64-80. ISSN: 0121-5051. Universidad Nacional de Colombia. [ Links ]
Eigler, P y Langeard, E (1989). Servucción, el marketing de servicios. McGraw-Hill / Interamericana de España. [ Links ]
Espinosa, J. M. (2010) Gestión de la Restauración. Editorial pueblo y educación, Ciudad de La Habana, Cuba. [ Links ]
George, D., y Mallery, P. (2003). SPSS for Windows step by step: A simple guide and reference. 11.0 update (4ª ed.). Boston, MA: Allyn & Bacon. [ Links ]
Grönroos, C. (1994). Marketing y gestión de servicios: la gestión de los momentos de la verdad y la competencia en los servicios. Madrid: Editorial Díaz de Santos. [ Links ]
Grönroos, C. (2001). The perceived service quality concept a mistake? Managing Service Quality. 11(3), 150-152. [ Links ]
Harrington, H.J. (1998). Mejoramiento de los procesos de la empresa. Mc Graw-Hill, Santa Fe de Bogotá, Colombia. [ Links ]
Hernández González, Y. (2008) Propuesta metodológica y aplicación de un procedimiento de diseño de sistemas servuctivos en el área de Recepción del Hotel Arenas Doradas. Tesis presentada en opción al título de Ingeniería Industrial. Universidad de Matanzas. Cuba. [ Links ]
Hernández Torre, M. (2008). Diagnóstico para la gestión del proceso de cambio integrado. Revista Ingeniería Industrial. 29(1),3-7. ISSN: 1815-5936 [ Links ]
Mantilla, J. A. & James, L. C. (1977) “Importante-Performance Análisis”. Journal of Marketing. 41 (1), 13-17. [ Links ]
Medina León, A., D. Nogueira Rivera, et al. (2012). Consideraciones y criterios para la selección de procesos para la mejora: Procesos Diana. La Habana, Revista de Ingeniería Industrial. 33 (3), 272-281. ISSN: 1815-5936 [ Links ]
Morillo Moreno et.al. (2011). Medición de la calidad del servicio en las instituciones financieras a través de la escala del SERVQUAL. Contaduría y Administración. (234), 101-130. ISSN 0186-1042. Universidad Nacional Autónoma de México. [ Links ]
Negrín Sosa (2003). El Mejoramiento de la Administración de operaciones en Empresas de servicios hoteleros. Tesis presentada en opción al grado científico de Doctor en Ciencias técnicas. Universidad de Matanzas. Cuba. [ Links ]
Nogueira Rivera (2002). Modelo Conceptual y herramientas de apoyo para potenciar el Control de gestión en las empresas cubanas. Tesis presentada en opción al grado científico de Doctor en Ciencias técnicas. ISPJAE. Cuba. [ Links ]
OCDE (Organizacion para la Cooperacion y el Desarrollo Economicos) (2010). Science, Technology and Industry Outlook 2010. Paris: OCDE. [ Links ]
Parra Ferié, C. (2005). Modelo y procedimientos para la gestión con óptica de Servucción de los servicios técnicos automotrices como elemento del sistema turístico cubano. Tesis en opción al grado científico de Doctor en Ciencias técnicas. Universidad de Matanzas. Cuba. [ Links ]
Parra Ferié, C. (2009). Procesos de servicios. Tendencias modernas en su gestión. Editorial Universitaria MES. [ Links ]
Pride y Ferrell (1997). Marketing. Conceptos y estrategias. 9na edición. Ediciones McGraw-Hill. México. [ Links ]
Stefano, Casarotto Filho & Godoy (2010). Medición de la calidad percibida en organización de servicio: utilizando o Índice de Potencial de Aumento de la Satisfacción del Consumidor (PASC) y Modelo dos 5 GAPS. Revista Electrónica Sistemas & Gestión, 5 (19, 17-31. ISSN, 2410-3977. [ Links ]
Received: January 30, 2017; Accepted: May 22, 2018
 Este es un artículo publicado en acceso abierto bajo una licencia Creative Commons
