


Servicios Personalizados
Revista
Articulo
 texto en
  Inglés (pdf)
 Artículo en XML
 Referencias del artículo
 Enviar artículo por email
Indicadores
-
 Citado por SciELO
 -
 Accesos
Links relacionados
-
 Similares en
SciELO
Similares en
SciELO
Compartir

 Permalink
Contaduría y administración
versión impresa ISSN 0186-1042
Contad. Adm vol.64 no.1 Ciudad de México ene./mar. 2019
https://doi.org/10.22201/fca.24488410e.2018.1247
Articles
Dynamics of the labor market of the transport sector in Mexico
1Instituto Politécnico Nacional, México.
In the present study the dynamics and structure of labor transport sector in Mexico is analyzed, specifically the “Drivers transport and mobile machinery” as well as the impact of economic growth on labor demand by categories of workers analyzed this sector according to the Classification of Occupations Unique of Mexican labor sector. The methodology presented is used by Kato (2004) following Sydsaeter and Hammond (1995) to determine the product elasticity of employment for the period 1996-2012, using microdata from National Survey of Income and Expenditure published by the National Institute of Statistics and Geography.
Keywords: Labor Economy; Labor force and employment; Size and structure; Labor demand; Occupational choice; Transportation economy
JEL codes: J01; J21; J23; J24; R40
En el presente estudio se analiza la dinámica y la estructura del sector laboral del transporte en México, específicamente de los “Conductores de transporte y de maquinaria móvil”, así como el impacto del crecimiento económico sobre la demanda de trabajo por categorías de los trabajadores de dicho sector de acuerdo a la Clasificación Única de Ocupaciones del sector laboral mexicano. Se utiliza la metodología presentada por Kato, E. (2004) y siguiendo a Sydsaeter, K. y Hammond, P. (1995), para determinar la elasticidad producto del empleo para el periodo 1996-2012, haciendo uso de microdatos de la Encuesta Nacional de Ingresos y Gastos de los Hogares (ENIGH) publicados por el Instituto Nacional de Estadística y Geografía (INEGI).
Palabras clave: Economía laboral; Fuerza de trabajo y empleo; Tamaño y estructura; Demanda laboral; Elección ocupacional; Economía del transporte
Códigos JEL: J01; J21; J23; J24; R40
Introduction
The Mexican Government, in its Sectoral Program of Communications and Transport of the National Development Plan 2013-2018, defined 3 cross-sectional strategies to bring the country to its maximum potential: 1) democratize productivity1, 2) approachable and modern government2, and 3) gender perspective3. This analysis will focus on the first strategy, specifically on objective 1: “To Strengthen well-functioning labor markets to boost the creation of formal, well-paid jobs”4 particularly in the transport sector. In this manner, the purpose of this work is to analyze the dynamic and structure of the transport labor sector in Mexico, as well as the impact of economic growth on labor demand by the categories of workers in the group: “Transport and mobile machinery drivers” according to the Unique Classification of Occupations (CUO for its acronym in Spanish) of the Mexican labor market by state. It also identifies which of the various unit groups comprising this group is the one with the greatest response to the growth of the Gross Domestic Product (GDP), according to the results obtained in the calculation of the elasticities.
Labor market dynamics are linked to multiple factors; the different levels of labor force specialization, globalization and financial inclusion can have a significant impact on labor demand. Authors such as Bauchet, Marshall, Starita, Thomas and Yalouris, 2011, and Cull, R., T. Ehrbeck and N. Holle, 2014, agree that such economic phenomena have a positive effect on labor market dynamics, on self-employment, emancipation, and the well-being of workers. According to a recent research by Fareed, Gabriel, Lenain and Reynaud (2017), access to financial services in Mexico can open up economic opportunities for women, especially as entrepreneurs. These results may be controversial. Authors such as González, G. (2004) point out that in Mexico, with the conditions in which the labor market develops in the context of economic globalization, there are serious problems for the growth of output and the generation of jobs that the working population demands.
Authors such as Burgos, B. and López, K. (2010) and Samaniego, N. (2013) carry out a separate study on the professional labor market, the aim being to analyze the dynamics of the labor market by professional activity. The authors develop an indicator of relevance to the labor market. The results, in general, coincide in that a significant portion of professionals work in areas that do not correspond to their career specialty and often do so in inadequate conditions. The same authors also agree that there are salary biases in different professional areas.
The literature that concerns the labor dynamics of the transport sector is not very abundant, however, a review of it makes it possible for us to approach, in a way, to the field of empirical analysis of studies of this sector. Works such as that by Islas, V., (1992, p.13), provide elements that define the transport sector as the set of institutions, people and inputs that participate-directly or indirectly-in the performance of a service that relates to the moving of people and/or goods and services. The supply of this service has its natural counterpart in its demand by other sectors of the economy.
In the same article, Islas (1992, p. 13) mentions that in some ways, the success or failure of the development activities of a country depends, to a large extent, on the transport systems that contribute to the productive activities of the economy. This makes transport an object of interest because it plays a strategic and irreplaceable role in the economy.
In this manner, this analysis is of interest within the actions presented by the federal government, as this study seeks to provide an overview of the current labor situation in the transportation sector in Mexico, with the intention of promoting the creation of formal jobs where these are demanded and according to the characteristics that each unitary group requires.
A document published by the INEGI (2014) concerning the transport sector in Mexico in 2012, analyzes the impact of employment given the changes in the economic units of this sector. In this publication, the INEGI indicates that there are more than 25,500 companies in the general cargo trucking industry, while only 19 companies were counted for maritime transportation. It also points out that those people employed in land transport represent little more than 90% of the workers in the transport sector. Similarly, it highlights the predominance of male workers over female workers, indicating that women represent only 13.9% of the personnel employed in this sector, a figure very similar to our own calculations (13.43%). The publication indicates that in 2012 there was a slight loss of employment (approximately 1%) compared to the previous year, which in terms of economic units represented 51 companies that ceased to operate.
On the other hand, the methodology proposed by Sydsaeter and Hammond (1995) in Kato (2004) will be used to determine the elasticity of the employment product. Furthermore, the most dynamic occupations in this sector that have a greater response to GDP growth will be identified.
The research covers a period of analysis from 1996 to 2012. The statistics used are generated from the management of information at the microdata level of the National Household Income and Expenditure Survey (ENIGH) published by INEGI. The effect of economic growth on employment in the group “Transport and mobile machinery drivers” in Mexico for that period will be calculated through a statistical analysis.
In recent studies, the analysis of elasticities has been used to study the relationship between employment output and the methodology proposed by Sydsaeter and Hammond (1995), which is taken up by ECLAC (2000) for a study of Latin America and the Caribbean. The same methodology was also used by Kato (2004) for their analysis of employment elasticity in the manufacturing industry in Mexico for the period of 1987-2001, but incorporating the social benefits variable, which the author uses to explain the changes in the magnitudes of the elasticities. For their part, Guerrero, C. (2007) quantifies the elasticities of employment by product and salary in the Central American Isthmus, carrying out an analysis of the evolution and perspectives of the labor market in that region.
On the other hand, Ruiz, C. (2005) uses the calculation of elasticities in an analysis of the integration of labor markets in North America. Cruz, G. and Ríos, H. (2014) calculate the elasticities resulting from employment to analyze the dynamics of the labor sector in Mexico for various occupations in the country. Ríos, J. and Carrillo, S. (2009) use them in an employment analysis in manufacturing in Mexico, in which they analyze the impact of employment in the face of changes in the output of the branches of this sector since the crisis of 2009. Finally, Navarro (2009) presents estimates on employment dynamics in Latin America, calculating employment-product and employment-wage elasticity. The work that has been done to analyze employment elasticity in Mexico has been applied mainly to the manufacturing sector; however, the methodology used in them can be adapted to any sector of the economy to be analyzed and serve as a guide for the analysis that will be presented here, which in this case is the transport sector in Mexico.
The main contribution of this research is the comprehensive analysis of the dynamics and structure of the transport labor sector in Mexico, which allows determining the impact of economic growth on the demand for labor by categories of workers in this sector, according to the Unique Classification of Occupations of the Mexican labor sector. On the other hand, the work shows, with empirical arguments, that the growth of the product unequally affects each of the unitary groups of workers from group 83 at the national and state levels.
This work is integrated as follows: the first section contains a general expose of what the CUO is and the criteria for the classifier, as well as a presentation of the activities carried out by the workers of the group “Drivers of transport and mobile machinery” provided by the INEGI in the National Survey of Occupation and Employment (ENOE for its acronym in Spanish). The second section presents an analysis of the statistics generated from the microdata of the ENIGH 1996 and 2012 of the “Transport and mobile machinery drivers” such as participation by gender, level of education, level of income and benefits. The third section presents, on the one hand, a review of the empirical evidence comparing the results obtained by various authors and those obtained in this analysis and, on the other hand, the results obtained from the calculation of the elasticities by unit groups of the “Transport and mobile machinery drivers” at the national and state levels. Finally, the conclusions are presented.
Description of the group “Transport and mobile machinery drivers”
The analysis of those in the group “Transport and mobile machinery drivers” will be examined through the Unique Classification of Occupations (CUO), which is a classifier of occupations that comprise the groups mainly in the concepts of: employment, occupation, and skill5.
According to the INEGI (2009), “CUO is a structure of main occupations according to the technical division of labor, it also takes into account situations arising from employment problems, such as self-employment. In this classification, occupation is defined as the set of functions, obligations, activities or tasks that an individual carries out in their job, trade or position, regardless of the economic activity carried out in the place where the individual works and of the relations established with the other employed persons. The basic criteria under which the classifier is formed are the following: i) the technical division of labor, ii) the level of qualification of the occupations and tasks performed, and iii) the use of similar instruments, tools and/or raw materials for the performance of the functions of each occupation”.
According to the ENOE6 (INEGI, 2009), “the workers classified in this group (Transport and mobile machinery drivers) control, service, and operate mobile machinery during the agricultural, industrial and construction production process, as well as for port loading and unloading and the movement of goods and commerce. For example: drivers of harvesters, tractors, excavators, asphalt pavers, forklifts, etc. This group also includes train, metro, and light rail drivers, who carry passengers or goods”.
Includes drivers of buses, trucks, cars, taxis, trolleybuses, trailers, etc., to transport passengers or goods. It also includes drivers of airplanes (airplanes, small planes, helicopters) and sea transport (ships, barges, boats) that transport passengers or goods. Also included are drivers of human-powered transport vehicles (tricycles, carts) and pack animals (oxen, mules, horses, donkeys). Driver assistants are considered in this group when they perform auxiliary tasks for the control and operation of transport equipment. Excluded from this main group are drivers of vehicles who promote, sell, deliver, and collect the product or merchandise in commercial establishments or at the address of the customers, as these workers are classified in the unitary group of dispatchers and shop assistants”.
The information presented in Table 1 is based on the criteria used in the CUO. Group 83 is comprised of 6 secondary groups (three figures) and 14 unitary groups (4 figures). In addition to this group and for the purposes of this work, three more unitary groups are being considered, as these were within this group in the previous classification, and it is considered important not to leave them out in this analysis. The unitary groups are as follows: 6,311 Agricultural and forestry machinery operators, 9,311
Table 1 Group 83: Transport and mobile machinery drivers
| 830 | Supervisors of transport and mobile machinery drives | |
| 8301 | Supervisors of transport and mobile machinery drives | |
| 831 | Air transport drives | |
| 8311 | Aviation pilots | |
| 832 | Maritime transport drivers | |
| 8321 | Captains and drivers of maritime transport | |
| 8322 | Deck officers and sailors and pilots | |
| 8323 | Engineer maritime transport officers | |
| 8324 | Drivers of small boats (barges, boats, canoes, etc.) | |
| 833 | Railway transport drivers | |
| 8331 | Railway transport drivers (train, subway, light train) | |
| 834 | Motorized land transport drivers | |
| 8341 | Drivers of trucks, vans, taxis, and cargo cars | |
| 8342 | Drivers of buses, trucks, vans, taxis, and passenger cars | |
| 8343 | Drivers in private homes | |
| 8344 | Motorcycle rider | |
| 8349 | Other motorized land transport drivers not previously classified | |
| 835 | Drivers of mobile machinery | |
| 8351 | Drivers of mobile construction and mining machinery | |
| 8352 | Drivers of mobile machinery for the movement of goods in factories, ports, shops, etc. |
Source: Own elaboration based on the Classification of Population and Housing Census 2010. INEGI, 2011.
Analysis of transport and mobile machinery drivers
In this section, statistics were generated from microdata from ENIGH 1996 and 2012. For the year 1996 a reclassification of the occupations of Mexico is made, since until 2008 the Mexican Classification of Occupations (CMO for its acronym in Spanish) was used, which consisted of 19 main groups. As of July 15th, 2011, the INEGI publishes a new classification called the Unique Classification of Occupations which consists of 53 main groups7. For the years 1996 and 2012, information is available at the level of microdata from the ENIGH which are weighted by the frequency variable expansion factor to represent the total number of workers in the country. A comparative analysis is made of the unit groups of the workers of group 83 for the years 1996 and 2012, according to the CUO, taking some characteristics such as: employed personnel, sex, level of schooling, level of income in minimum wages, and benefits.
Group 83 is among the most representative occupational groups in Mexico, representing 5.3% in 1996 and 4.7% in 2012. In a previous analysis of the Mexican labor sector (Cruz, G. 2013), only 22 of the 53 main occupation groups are the most representative, as they represent approximately 80% of the economically active employed population of the country, and the group of “Transport and mobile machinery drivers” is within this group of the 22 most representative occupations, occupying the 6th place in order of employed persons. For their part, Ruiz (2005), in their work on the integration of labor markets, mentions that the population dedicated to “Transportation, communications, and storage” is 6% of the total employment for the year 2003.
Table 2 shows the participation of the employed population in the group: “Transport and mobile machinery drivers”. It is observed that by the year 2012 there were two unitary groups with the most workers within this group: 46.80% of people employed were bus, truck, van, taxi, and passenger car drivers; and 35.90% were truck, van, and cargo car drivers. These two unitary groups represent approximately 82% of the employed persons in this group.
Table 2 Participation of the employed population (%). Group 83, 1996 and 2012.
| Unitary Group | Employed Occupation (%) | |
|---|---|---|
| 1996 | 2012 | |
| Aviation pilots (8311) | 1.01 | 0.07 |
| Captains and drivers of maritime transport (8321) | 0.39 | 0.08 |
| Deck officers and sailors and pilots (8322) | 0.03 | 0.03 |
| Drivers of small boats (barges, boats, canoes, etc.) (8324) | 0.24 | 0.16 |
| Railway transport drivers (train, subway, and light rail) (8331) | 0.15 | 0.04 |
| Drivers of trucks, vans, and cargo cars (8341) | 36.66 | 35.90 |
| Drivers of buses, trucks, vans, taxis, and passenger cars (8342) | 42.59 | 46.80 |
| Drivers in private homes (8343) | 2.20 | 1.30 |
| Other motorized land transport drivers, not previously classified (8349) | 0.50 | 0.06 |
| Drivers of mobile cosntruction and mining machinery (8351) | 3.22 | 3.56 |
| Drivers of mobile machinery for the movement of goods in factories, ports, commerce, etc. (8352) | 3.63 | 5.28 |
| Drivers of bicycle transport vehicles (9321) | 1.34 | 2.14 |
| Assistant drivers for motorized land transport (9311) | 3.74 | 1.74 |
| Agricultural and forestry machinery operators (6311) | 4.31 | 2.84 |
Source: Calculations and own elaboration based on microdata from ENIGH 1996-2012, INEGI.
The table shows that rail, air, and sea transport drivers have the lowest percentage of employed persons in both time periods, even in the five-unit groups of these two main groups (831 and 832) the employed population decreased except for those employed in group 8322: Deck officers and sailors and pilots.
Regarding the participation by gender of the population employed in this sector, in 1996, 99.65% were men and 0.35% were women. Figure 1 shows in detail the degree of participation by gender and by unit group; it can be observed that the unitary group 9311 (Assistants to motorized land transport drivers) and unitary group 8342 (Drivers of buses, trucks, vans, taxis, and passenger cars) were the only groups that had women participation, both with a small participation of 3.19% and 0.53%, respectively.

Source: Calculations and own elaboration based on microdata from ENIGH 1996, INEGI.
Figure 1 Participation by gender of the employed population (%). Group 83, 1996.
The scene changes for 2012, as women participation increased from 0.35% in 1996 to 13.43% of workers in this sector. Figure 2 shows in detail the degree of participation by gender and by unit group; it can be observed that unit group 9311 (Assistants to motorized land transport drivers) increased women participation significantly, as their participation increased from 3.19% to 61.06% of those employed in this group, while group 8342 (Drivers of buses, trucks, vans, taxis, and passenger cars) increased from 0.53% to 16.47% of women participation. In addition to these two unitary groups, there were six more that registered the participation of women: group 6311 (Agricultural and forestry machinery operators) with 8.38%; group 9321 (Drivers of bicycle transport vehicles) with 16.99%; group 8352 (Drivers of mobile machinery for the movement of goods in factories, ports, commerce, etc.).) with 6.32%; group 8351 (Drivers of mobile construction and mining machinery) with 4.38%; group 8341 (Drivers of trucks and cargo cars) with 9.90%; and finally group 8321 (Captains and drivers of maritime transport) with 22.23%.
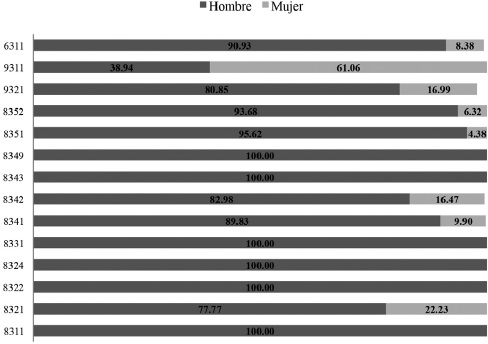
Source: Calculations and own elaboration based on microdata from ENIGH 2012, INEGI.
Figure 2 Participation by gender of the employed population (%). Group 83, 2012.
Regarding the levels of formal education for the workers in this group, Figure 3 shows the education level for 1996. It can be observed that the predominant education level of the workers in this group is primary school, followed by secondary school; four groups present higher levels of studies: group 8311 (Aviation Pilots) with 48.93%; group 8352 (Drivers of mobile machinery for the movement of goods in factories, ports, commerce, etc.) with 7.14%; group 8341 (Drivers of trucks and cargo cars) with 0.82%; and group 8342 (Drivers of buses, trucks, vans, taxis, and passenger cars) with 0.38%.

Source: Calculations and own elaboration based on microdata from ENIGH 1996. INEGI.
Figure 3 Education level of the employed population (%). Group 83, 1996.
For the year 2012, the levels of formal education for the workers in this group showed changes, Figure 4 shows that the predominant level of education is secondary school, followed by the upper middle level; in this period, three more groups are added to the four with higher level studies: group 6311 (Operators of agricultural and forestry machinery) with 1.58%, group 9311 (Driver’s assistants for land transport with motor) with 1.90%, and group 8351 (Drivers of mobile construction and mining machinery) with 1.93%.

Source: Calculations and own elaboration based on microdata from ENIGH 2012, INEGI.
Figure 4 Education level of the employed population (%). Group 83, 2012.
Regarding working conditions, these were measured in terms of whether or not people received benefits from their work. Figure 5 shows that a considerable percentage of the workers in this group have no benefits. By 1996 only three main groups had benefits for 100% of their employees: Group 8311 (Aviation Pilots), Group 8322 (Deck Officers and Sailors and Pilots), and Group 8331 (Railway Transport Drivers). The most precarious group was group 8324 (Drivers of small boats), as 71.75% of its workers had no benefits. For the year 2012 the situation does not change much because although there were two more groups that had better conditions due to having benefits: groups 8321 (Captains and drivers of maritime transport) and 8349 (Other drivers of motorized land transport not previously classified); group 8311 had a decline as it previously offered benefits to 100% of its workers and for the year 2012 only 48.84% of its workers had benefits.

Source: Calculations and own elaboration based on mricodata from ENIGH 1996-2012, INEGI.
Figure 5 Employed population without benefits (%). Group 83, 1996-2012.
Finally, Figure 6 shows the level of income of workers in 2012, classified into 6 categories of Minimum Average General Wage (SMGP for its acronym in Spanish), and which shows that the majority of workers obtain from 0 to 1 SMGP; only three unit groups obtain more than 10 SMGP: 6311 (Agricultural and forestry machinery operators) with 3.81%; and groups 8322 (deck officers and sailors and pilots) and 8311 (aviation pilots) with 100%.

*Classification based on the Average General Minium Wage of the United Mexican States, Ministry of Labor and Social Security- National Commission on Minimum Wages. (60.50 pesos per day as of November 26, 2012).
Source: Calculations and own elaboration based on microdata from ENIGH 2012, INEGI.
Figure 6 SMGP* income level (%). Group 83, 2012.
Evaluation of the elasticities of the drivers of transport and mobile machinery
Review of the empirical evidence
The main objective of this paper is to analyze the impact of economic growth on the demand for work by unit groups of employed persons in the group “Transport and mobile machinery drivers” by CUO categories, thus identifying which of the various occupations within this group are the most responsive for the country according to the results obtained in the calculation of elasticities. Studies show the empirical evidence of the analysis of the elasticity product of employment applied mainly to the manufacturing sector in Mexico in different periods of time, however, the methodology applied to them can be used in any sector of the economy; these studies serve as a guide for the analysis presented here.
Ruiz (2005) in their work on the integration of labor markets, presents an analysis of employment niches through an analysis of the elasticity of employment, in which they obtain that for the period of 1994-2000, at the national level, the growth of the country is intensive, but not so for the period of 1987-1993. The comparison by author at the national level is made with respect to the United States and Canada, so that in the end they observe that Mexico presents a loss in both periods of time. The estimate of the elasticity resulting from the employment obtained at the national level for the period of 1987-1993 in the “Transport, communications and storage” sector was of 0.81 and for the period of 1994-2000 it was of 0.58. For their part, Cruz and Ríos (2014) obtain a value of 0.75 from the estimate of the elasticity resulting from the employment of “Transport and mobile machinery drivers” for the period of 1996-2010. In the particular case of this investigation, the calculation is made in a more detailed manner for the group “Transport and mobile machinery drivers”, obtaining the calculation of the elasticities at the unitary group level of both the national total and of the federal state, which enriches the analysis for those who wish to consult in greater detail on this sector.
Guerrero (2007) makes an analysis of elasticities applied not only to employment but also to wages, that is, they make employment to product and wage elasticity calculations in the Central American region for the period of 1980-2004, where they present as restriction that the demand for employment depends only on the level of economic activity. One of the main results that the author reaches with this analysis is that: “the values of the elasticities of formal employment to product are, in themselves, reduced and considerably lower than those of total employment. Therefore, the results represent evidence that is favorable to the hypothesis, which affirms the existence of a labor bias in the development model in force in that region, in the sense of its limited capacity to generate quality jobs” (Guerrero, 2007, p. 19). This hypothesis coincides with the results obtained in this analysis when compared with the negative elasticity values, which are reflected in the decrease in the employed population in certain unit groups in the transport sector.
Ríos and Carrillo (2009), in their analysis of skilled and unskilled employment, present the values of the employment-product and employment-wage elasticity of the manufacturing sector in Mexico since the 2009 crisis. The authors state that the ratio of the employment-to-product elasticity of labor demand in the manufacturing sector will depend on the type of subsector, the type of enterprise and the jobs generated, in order for it to comply with the economic theory of being positive. One economic policy measure that the authors suggests for the retention of jobs is to preserve jobs even if they are unskilled in the manufacturing sector, so as not to have a more negative effect on the economic impacts of the crisis in that period of time. It refers to the government job preservation programs, whose measures sought to retain as many jobs as possible for a lower wage but promised to prevent the loss of those jobs, and to support businesses through a subsidy in exchange for maintaining the employment of their workers. However, given the result of the employment-product elasticity, the authors mention that such support was not sufficient for some manufacturing subsectors, such as the manufacture of clothing and furniture. Another important conclusion reached by the authors is that “the high-tech subsectors are not the only ones with the greatest elasticity in terms of output and employment and that, therefore, in the face of an economic crisis, they would be more affected by the consequent reduction in employment” (Ríos and Carrillo, 2009, p. 710). This conclusion reached by the authors coincides with the value of the elasticity calculation obtained in group 8311 (Aviation pilots), since the technology used in that group is greater and, therefore, when there is an economic crisis, jobs are more affected. This was the case with the 2010 crisis presented by this group, and the result was reflected in the negative elasticity value obtained in the calculations presented here. Not so in the case of group 8341 (Drivers of trucks, vans, and cargo cars), which although it had a decrease in the number of employed personnel, this result did not negatively impact the value obtained from the elasticity, which could be attributed, among other causes, to the fact that the processes used in this group are not high-tech.
Navarro (2009) makes an analysis of the dynamics of employment for 15 Latin American countries, calculating the employment-wage elasticity, in which “if this falls during recessions, policies aimed at reducing labor costs would have limited effectiveness in a recession such as the current one (2009)” (Navarro, 2009, p. 26). Their calculations result in “employment-product and employment-salary elasticities of signs that are consistent with international theory and empirical evidence”. An important conclusion is that “the results predict greater employment-product elasticity and lower employment-wage elasticity during the phases of product deceleration and contraction. This suggests that policies aimed at reducing labor costs would have limited impact in reducing unemployment during recessions. On the other hand, and according to the results, policies aimed at stimulating aggregate demand would strengthen their positive impact on employment in times of crisis” (Navarro, 2009, p. 38).
Finally, by revising the methodology presented by Kato (2004) following Sydsaeter and Hammond (1995), which consists in determining the elasticity of employment, which in turn calculates elasticity by dividing the rate of employment growth by the rate of output growth, this estimate basically consists of measuring how much employment grows, on average, as output increases. This methodology will be used in the analysis presented here to quantify the effect of economic growth on employment in Mexico for the period of 1996-2012 with the particularity of applying it to the group: “Transport and mobile machinery drivers” at the microdata level and by state of each unitary group contained in this working group.
Kato utilizes an additional variable: social benefits, to explain the changes in the magnitudes of the elasticities of the manufacturing sector, proposing as a hypothesis that “job creation in Mexico has had little increase, not only because of low rates of growth in production, but also because of the increase in the price of the labor input, since it has to cover its social benefits” (Kato, 2004, p. 91-92). The author concludes that the elasticity of employment tends to be greater in the manufacturing sector than in the economy as a whole; in addition, they contrast the above hypothesis with empirical evidence that “social benefits were reduced on average per worker and allow an expansion of the level of employment in the economy” (Kato, 2007, p. 95), i.e., benefits are sacrificed for job creation. In this case, this variable is not considered. However, as shown in Figure 5, there is a considerable percentage of workers who do not have benefits in neither of the two periods of time.
Analysis of the elasticity resulting from the use of “Transport and mobile machinery drivers”
According to Kato(2004) 8, and among other authors, “it is postulated that employment is a function of the level of production as proposed by the labor market scheme. Therefore, the employment-product ratio would be expressed as follows:
Where:
L is the level of employment
Q is the level of production, f'>0 and f''<0, which indicates that employment grows as production increases, although at declining rates.
Now, to estimate the elasticity resulting from employment, absolute and relative variations are first defined through Sydsaeter and Hammond (1995). Formally, the absolute variation of employment can be defined as follows:
In which, the change in employment ∆L is a function of the change in production ∆Q and its current level Q, prior to the change. Another measure of sensitivity of the change in employment, in addition to the absolute variation, may be the slope of function (1), which is ∆L/∆Q.
However, both the absolute variation and the slope have a problem of comparison, considering the units of measurement, given that if we wanted to compare modern industry with traditional production, we would have a high dispersion of the contrasting values due to the inherent nature of the activities. Likewise, the differential of productivity and intensity in the use of capital would be high.
A technical procedure that solves this difficulty of comparison is the standardization of the absolute change between the level of the variables. This is known as relative variation or growth rate. In the case of the employment variable it is expressed as:
From this definition, equation (4) constructs the concept of employment elasticity, which is the result of dividing the relative change in employment by the relative change in production:
According to Sydsaeter and Hammond (1995), this quotient is free of units of measure and only indicates how the level of employment responds to a variation in the level of production.
Thus, a 10% increase in employment is the same proportional variation, regardless of whether there are one hundred thousand or one million jobs in the economy. So, the variation for employment is:
Now, replacing
Therefore, ƐLQ is calculated as the result of multiplying the average productivity of the worker by the slope of employment in relation to a marginal change in production; elasticities are determined, as suggested in equation (4), by dividing the relative changes”9.
In this research an analysis is developed to test the hypothesis in the direction proposed by these authors, calculating the elasticity product of employment, with the particularity, as mentioned above, of carrying out the analysis by the unitary groups of workers employed in the group of “Transport and mobile machinery drivers” country and state-wise at the microdata level.
Figure 7 shows the result of the calculation of the elasticities for the period of 1996-2012 for “Transport and mobile machinery drivers” at the national level. Of the 14 groups, 5 showed negative elasticities. The group that presented the highest elasticity was group 9321 (Drivers of bicycle transport vehicles) with a value of 2.248; this could be caused by the increase in the implementation of programs in this type of vehicles. On the other hand, the unitary group with the lowest elasticity was group 8311 (Aviation pilots) with a value of -4.343, which could be due to the crisis faced in 2010 by the airline Mexicana de Aviación which suspended operations and later declared bankruptcy. Another of the conclusions obtained by Ríos and Carrillo (2014), which coincides with the result of Figure 7, is that positive elasticities correspond to a large extent to unskilled employment. In this case, the unitary groups with positive elasticities have a majority of secondary schooling. Again, the case of group 8311 coincides with what Kato (2004) refers to about the increases in unemployment, which they attribute to a decrease in the value obtained in the elasticity product of employment, since this group had a value in its elasticity of -4.343, going from 1.01 to 0.07% of its employed population in the period of 1996-2012; a similar conclusion even though they are from different sectors of the Mexican economy, since Kato refers to the elasticity of employment in the manufacturing industry and here it is about the transport sector in Mexico.

Source: Calculations and own elaboration based on microdata from ENIGH 1996-2012.
SCNM-GDP Annual, 1996-2012, Base year 2008. INEGI.
Figure 7 Elasticities: Transport and mobile machinery drivers, 1996-2012.
At the state level, the groups that had full participation in the 32 states were the workers in group 8341: Drivers of trucks, vans, taxis, and cargo cars; and the workers in group 8342: Drivers of buses, trucks, vas, taxis, and passenger cas. The rest of the unitary groups did not have total participation in the 32 states as shown in Table 3, in the results obtained in the calculation of the elasticities for each of the states.
Table 3 Elasticities by State: Transport and mobile machinery drivers, 1996-2012.
| 8311 | 8321 | 8322 | 8324 | 8331 | 8341 | 8342 | 8343 | 8349 | 8351 | 8352 | 9321 | 9311 | 6311 | |
|---|---|---|---|---|---|---|---|---|---|---|---|---|---|---|
| AGUASCALIENTES | 0.000 | 0.000 | 0.000 | 0.000 | 0.000 | 1.226 | 0.108 | -2.485 | 0.000 | -2.485 | 0.239 | 0.000 | 0.000 | -3.091 |
| BAJA CALIFORNIA | 0.000 | 0.000 | 0.000 | 0.000 | 0.000 | 0.133 | -0.168 | 0.000 | 0.000 | 5.161 | 7.206 | 0.000 | 0.000 | -0.176 |
| BAJA CALIFORNIA SUR | 3.692 | 3.170 | 3.604 | -2.000 | 0.000 | 0.014 | -0.009 | 0.000 | 0.000 | -0.169 | -2.225 | 0.000 | 3.604 | 2.808 |
| CAMPECHE | 2.406 | 0.000 | -1.357 | -1.221 | 0.405 | 0.189 | 0.286 | 0.470 | 0.000 | 0.502 | 0.385 | 0.119 | -1.395 | 2.857 |
| COAHUILA | 0.000 | 0.000 | 0.000 | 0.000 | 0.000 | -0.175 | 0.083 | 0.000 | -2.649 | -3.113 | 0.752 | 0.000 | -0.137 | -2.923 |
| COLIMA | 0.000 | 0.000 | 0.000 | 4.277 | 0.000 | 0.355 | 0.599 | 0.000 | 0.000 | -0.082 | -0.200 | 0.000 | 0.000 | -2.586 |
| CHIAPAS | 0.000 | 0.000 | 0.000 | 0.000 | 0.000 | 0.067 | 0.879 | 5.514 | 0.000 | -3.167 | 0.000 | 0.000 | 0.000 | -2.932 |
| CHIHUAHUA | 0.000 | 0.000 | 0.000 | 0.000 | 0.000 | 0.389 | 0.382 | 0.000 | 0.000 | -0.073 | 6.747 | 0.000 | 0.290 | -3.811 |
| DISTRITO FEDERAL | -1.244 | 0.000 | 0.000 | 0.000 | 0.000 | 0.367 | -0.243 | 0.041 | -4.031 | 0.000 | -3.453 | 7.236 | -4.396 | 0.000 |
| DURANGO | 0.000 | 0.000 | 0.000 | 0.000 | 0.000 | 0.297 | -0.009 | 0.000 | -3.003 | 0.000 | 0.184 | 4.970 | -3.186 | 6.128 |
| GUANAJUATO | 0.000 | 0.000 | 0.000 | 0.000 | 0.000 | 0.175 | -0.004 | 0.000 | 0.000 | -2.903 | -2.456 | 0.000 | -2.971 | 6.412 |
| GUERRERO | 0.000 | 0.000 | 0.000 | 5.741 | 0.000 | 0.211 | 0.937 | 0.000 | 0.000 | 0.000 | 0.000 | 5.187 | -3.535 | -3.374 |
| HIDALGO | 0.000 | 0.000 | 0.000 | 0.000 | 0.000 | 0.317 | 0.211 | -2.444 | 0.000 | 0.487 | -2.477 | 0.000 | 0.577 | 0.393 |
| JALISCO | 0.000 | 0.000 | 0.000 | 0.000 | 0.000 | 0.2725 | 0.301 | -0.037 | 0.000 | 1.065 | 0.520 | 0.000 | 0.000 | 1.302 |
| MÉXICO | -3.652 | 0.000 | 0.000 | 0.000 | -3.284 | 0.336 | 0.511 | 0.354 | -2.792 | 0.000 | 0.512 | 0.628 | -0.164 | -3.294 |
| MICHOACÁN | 0.000 | 0.000 | 0.000 | 0.000 | 0.000 | 0.206 | 0.527 | 0.000 | 0.000 | 5.802 | 0.000 | 0.000 | 0.000 | 5.208 |
| MORELOS | 0.000 | 0.000 | 0.000 | 0.000 | 0.000 | -0.003 | 0.161 | 4.889 | 5.102 | 5.971 | 0.000 | 0.000 | 0.000 | 0.000 |
| NAYARIT | 0.000 | 0.000 | 0.000 | 0.000 | 0.000 | 0.581 | 0.332 | 0.000 | 0.000 | 4.329 | 0.587 | 0.000 | -0.393 | -0.447 |
| NUEVO LEÓN | 0.000 | 0.000 | 0.000 | 0.000 | 0.000 | 0.264 | -0.113 | 0.000 | 0.000 | 5.008 | 0.668 | 0.000 | -2.682 | -2.741 |
| OAXACA | 0.000 | 0.000 | 0.000 | -2.436 | 0.000 | -0.503 | 0.388 | -2.622 | 0.000 | 1.503 | 0.511 | -2.769 | 0.000 | -2.946 |
| PUEBLA | 0.000 | 0.000 | 0.000 | 0.000 | 0.000 | 0.457 | 0.461 | -3.555 | 0.000 | 0.000 | -3.540 | 0.000 | 0.000 | 0.000 |
| QUERÉTARO | 0.000 | 0.000 | 0.000 | 0.000 | 0.000 | 0.383 | -0.113 | -0.027 | 0.000 | 3.871 | 0.052 | 0.000 | 4.894 | 4.058 |
| QUINTANA ROO | 0.000 | 4.217 | 0.000 | -2.534 | 0.000 | 0.716 | 0.268 | 0.000 | 0.000 | -0.444 | 0.000 | 0.000 | 4.134 | -2.518 |
| SAN LUIS POTOSÍ | -2.829 | 0.000 | 0.000 | 0.000 | 0.000 | 0.166 | 0.167 | 0.000 | 0.000 | -2.832 | -3.149 | 0.000 | -2.813 | 4.579 |
| SINALOA | 0.000 | 0.000 | 0.000 | 0.000 | 0.000 | 0.391 | -0.002 | 0.000 | 0.000 | -3.501 | 0.000 | 0.000 | 0.000 | -0.156 |
| SONORA | 0.000 | 0.000 | 0.000 | 0.000 | 0.000 | 0.213 | 0.510 | 0.000 | 0.000 | 0.745 | 4.956 | 0.000 | 0.000 | -3.538 |
| TABASCO | 0.000 | 0.000 | -1.284 | -1.319 | 0.000 | -0.060 | 0.681 | 0.000 | 0.000 | 0.006 | 0.000 | 0.000 | -1.567 | -0.002 |
| TAMAULIPAS | 0.000 | -3.177 | 0.000 | -3.058 | 0.000 | 0.328 | 0.253 | -2.911 | 0.000 | 0.000 | 0.000 | 0.000 | 0.000 | -0.722 |
| TLAXCALA | 0.000 | 0.000 | 0.000 | 0.000 | 0.000 | 0.288 | 0.390 | -2.540 | 0.000 | -2.488 | 0.847 | 0.000 | 0.000 | 0.000 |
| VERACURZ | 0.000 | -2.965 | 0.000 | 0.000 | 0.000 | 0.122 | 0.452 | 0.000 | 0.000 | 5.544 | 0.798 | 0.000 | 5.015 | 5.490 |
| YUCATÁN | 0.000 | 0.000 | 0.000 | 0.000 | 0.000 | 0.471 | -0.136 | 0.000 | -2.722 | 4.167 | 0.000 | 0.044 | 4.525 | 4.167 |
| ZACATECAS | 0.000 | 0.000 | 0.000 | 0.000 | 0.000 | 0.004 | 0.636 | 0.000 | 0.000 | 3.827 | 0.000 | 0.000 | 0.000 | -0.309 |
Source: Calculations and own elaboration based on microdata from ENIGH 1996-2012.
SCNM-GDP Annual, 1996-2012, Base year 2008. INEGI.
From the graphical analysis presented by the results obtained from the calculations of the elasticities of the “Transport and mobile machinery drivers” by state, it can be concluded, firstly, that the first group, mentioned above, consists of two groups present in the 32 states: unitary group 8341 and unitary group 8342. Secondly, Table 3 shows that not all the unitary groups have a presence in the 32 states, as is the case of unitary group 8331, which only had a participation in Campeche and Mexico with a positive and negative elasticity, respectively. Thirdly, there were entities in which the activities registered elasticities with high negative values, so their PEAO presented very low values and, conversely, there were activities in which they increased the participation of their PEAO due to positive elasticities. Fourthly, the states that had the greatest participation of the PEAO in this main group were: State of Mexico, Veracruz, Mexico City, Jalisco, Michoacán, Nuevo León, and Puebla; on the other hand, the states with the least participation of their PEAO in this main group were: Baja California Sur, Colima, Campeche, Tlaxcala, Aguascalientes, and Zacatecas. Finally, with respect to the elasticities, it can be observed that the same unitary group has a different behavior in each of the states where its PEAO participates, for example, for unitary group 8351 the state of Chihuahua had a negative elasticity of -0.073, but not so for the state of Hidalgo, which presented a positive elasticity of 0.487.
Conclusions
Going back to the central idea of the objective of this work, it has been verified, on the one hand, that the growth of the product has an unequal effect, at both the national and state levels on the unitary groups of the workers of group 83. It was identified which of the various occupations that exist in the group of “Transport and mobile machinery drivers” are those with the greatest response for the country according to the results obtained in the calculation of elasticities, since elasticities with positive and negative values were obtained. The working conditions of these subgroups are totally different because the levels of schooling and salary income could be at the extremes.
On the other hand, the strength of the PEAO of group 83, with more than one and up to three minimum wages, are workers with low education levels (primary and secondary), in addition to the existence of a higher participation of men than women, a situation that may be due to the very nature of the sector and not to gender discrimination. It should be noted that labor market conditions are not entirely favorable as most of the jobs created are low-wage or unpaid. As mentioned by Guerrero (2007) in their analysis of employment, sufficient and quality jobs must be created as the main development strategy. This conclusion applies not only to the six countries they analyze, since with the present analysis we observe that Mexico’s transport sector requires the generation of quality jobs: with better salaries, benefits and training of personnel according to the group in which they work.
There were states in which the activities recorded elasticities with negative values, so that the participation of their PEAO registered very low values; and on the contrary there were activities in which elasticities with positive values were registered, reflecting in an increase in the participation of their PEAO in 16 years. The states that had the greatest participation of the PEAO in this main group were: State of Mexico, Veracruz, Mexico City, Jalisco, Michoacán, Nuevo León, and Puebla; on the other hand, the states with the least participation of the PEAO were: Baja California Sur, Colima, Campeche, Tlaxcala, Aguascalientes, and Zacatecas.
Concerning the participation of the unit groups, those with more participation from their PEAO were: group 8342: Drivers of buses, trucks, vans, taxis, and passenger cars; group 8341: Drivers of trucks, vans, taxis, and cargo cars; group 8352: Drivers of machinery moving goods in factories, ports, commerce, etc. The unit groups with low participation of their PEAO were: group 8322: Deck officers and sailors and pilots; group 8331: Railway transport drivers; and group 8321: Maritime transport captains and drivers. It is observed that the elasticities of the same unitary group have different behaviors in each of the states, presenting positive elasticities in one state and negative in another. The states favored in the growth of the PEAO used in this main group “Transport and mobile machinery drivers” due to an increase in production-which is the main result of the analysis of the elasticity calculation-were: Campeche, Jalisco, Michoacán, Morelos, Sonora. Veracruz and Yucatán, just to mention the states where more positive than negative elasticities were recorded.
It is in this manner that this research provides the guideline for the generation of inputs for decision-making in public policies, such as the construction of training centers for workers to improve their quality of life, training in trades according to the labor demand of this sector in particular and the promotion of entrepreneurs, specifically for “Transport and mobile machinery drivers” focused on the needs of each state. On the other hand, in some unitary groups, the percentage of the population that does not have benefits is considerable, since there are groups in which more than 50% do not have them, which could indicate that they are perhaps working in the informal sector. In this sense, such personnel can be encouraged by including them in a social security system.
REFERENCES
Bauchet, J., C. Marshall, L. Starita, J. Thomas, y A. Yalouris (2011). Latest Findings from Randomized Evaluations of Microfinance. Washington, D.C. Financial Access Initiative, Innovations for Poverty Action, y Abdul Latif Jameel Poverty Action Lab. [ Links ]
Burgos, B. y López, K. (2010). La situación del mercado laboral de profesionistas. Revista de la Educación Superior, vol. 39. Núm. 156, oct./dic. 2010, México. [ Links ]
Comisión Económica para América Latina y el Caribe (2000). Economic survey of Latin America and the Caribbean 1999-2000. Santiago de Chile. [ Links ]
Cruz, G. (2013). Efecto de la escolaridad sobre el ingreso monetario para 22 ocupaciones en el sector laboral mexicano. Tiempo Económico, vol. VIII, núm. 23, primer cuatrimestre, pp. 37-51, México. [ Links ]
Cruz, G. y Ríos, H. (2014). Elasticidad producto del empleo de los trabajadores en México: un análisis por ocupaciones. Revista Mexicana de Economía y Finanzas, vol. 9, núm. 1, pp. 37-59, México. https://doi.org/10.21919/remef.v9i1.54 [ Links ]
Cull, R., T. Ehrbeck y N. Holle (2014). Financial inclusion and development: recent impact evidence, Washington, DC. World Bank Group, nota de enfoque CGAP; núm. 92. [ Links ]
Fareed, F. et al. (2017), “Financial Inclusion and Women Entrepreneurship: Evidence from Mexico”, OECD Economics Department Working Papers, No. 1411, OECD Publishing, Paris. https://doi.org/10.1787/2fbd0f35-en [ Links ]
González, G. (2004), La globalización y el mercado de trabajo en México. Revista Problemas del desarrollo, Vol. 35, núm. 138, julio-septiembre. [ Links ]
Guerrero, C. (2007). Evolución reciente y perspectivas del empleo, México, Naciones Unidas. http://www.cepal.org/es/publicaciones/5004-evolucion-reciente-perspectivas-empleo-istmo-centroamericano [ Links ]
Instituto Nacional de Estadística y Geografía, (2011). Clasificaciones del Censo de Población y Vivienda 2010. México. http://www.inegi.org.mx/ [ Links ]
Instituto Nacional de Estadística y Geografía (INEGI) (2006-2010). Encuesta Nacional de Ingreso y Gasto de los Hogares (ENIGH). México. http://www.inegi.org.mx/ [ Links ]
Instituto Nacional de Estadística y Geografía (INEGI) (2009). Encuesta Nacional de Ocupación y Empleo (ENOE). México. http://www.inegi.org.mx/ [ Links ]
Instituto Nacional de Estadística y Geografía (INEGI) (1995-2009). Sistema de Cuentas Nacionales de México (SCNM). México. http://www.inegi.org.mx/ [ Links ]
Islas, V. (1992). Estructura y desarrollo del sector transporte en México, El Colegio de México, 2ª edición, México. [ Links ]
Kato, E. (2004). Elasticidad producto del empleo en la industria manufacturera mexicana, Problemas del desarrollo, vol. 35, núm. 138, pp. 87-96, México. http://www.revistas.unam.mx/index.php/pde/article/view/7541 [ Links ]
OECD (2017), Economics Department Working Papers, No. 1411, OECD Publishing, Paris. https://doi.org/10.1787/2fbd0f35-en [ Links ]
Ríos, J. y Carrillo, S. (2014). El empleo calificado y no calificado en la manufactura de México ante la crisis de 2009, Economía, Sociedad y Territorio, vol. XIV, núm. 46, septiembre-diciembre, pp. 687-714. https://doi.org/10.22136/est002014393 [ Links ]
Ruiz, C. (2005). Integración de los mercados laborales en América del norte, Cuadernos de Relaciones Laborales, vol. 24, núm. 1, pp. 105-150. [ Links ]
Plan Nacional de Desarrollo 2013-2018 (2013). Programa Sectorial de Comunicaciones y Transportes. México. http://www.sct.gob.mx/fileadmin/banners/Programa_Sectorial_de_Comunicaciones_y_Transportes.pdf [ Links ]
Perfil de Transporte en México (2014). Instituto Nacional de Estadística y Geografía. México. http://www.inegi.org.mx/ [ Links ]
Samaniego, N. (2013). Reseña: Mercado Laboral de Profesionistas en México. Revista Economía UNAM, vol. 10 no. 30, sep/dic 2013, México. [ Links ]
Sydsaeter, K. y Hammond, P. (1995). Matemáticas para el análisis económico. (1ª Ed.) Madrid, Prentice Hall. [ Links ]
1The “Democratize productivity” cross-sectional strategy, will coordinate government actions aimed at carrying out public policies that will remove obstacles that limit the productive potential of citizens and businesses; it will encourage the efficient use of productive resources among all actors in economic activity; and analyze in a compre hensive manner public income and expenditure policy so that government strategies and programs incite formality. National Development Plan 2013-2018. Sectoral Program of Communications and Transport.
2The “Approachable and modern government” cross-sectional strategy, will be established through a foundation of collaboration between the coordinator of the sector, the Secretariat of Finance and Public Credit, and the Secretariat of the Civil Service. Ibid.
3The “Gender perspective” cross-sectional strategy, incorporates gender equality into the compensatory policies, programs, projects and instruments of the Ministry of Communications and Transport, especially in the Employment and Temporary Employment Program. A well communicated country contributes to the prevention of discrimination. Ibid.
5In 2008, within the framework of the meeting of the Sectoral Committee on Labor Statistics and Social Security, it was agreed to prepare it with the objective of generating information that reflects the occupational structure of the country and is comparable with other international classification systems. INEGI, 2010 Population and Housing Census Classification, July 2011.
6In 2008, within the framework of the meeting of the Sectoral Committee on Labor Statistics and Social Security, it was agreed to prepare it with the objective of generating information that reflects the occupational structure of the country and is comparable with other international classifcation systems. INEGI, 2010 Population and Housing Census Classifcation, July 2011.
7In this reclassification of occupations, there was a homogenization of the two databases, given that in the publica tion of the ENIGH-2010, the classification of occupations was completely changed, not only regarding the name of this classification, since until 2008 it was still called the Mexican Classification of Occupations, and for 2010 the new clas sification published in the ENIGH is called the Unique Classification of Occupations; additionally, the classification of occupations changes completely, for example: Main group 11 in 1996 pertained to Professionals. By 2010, group 11 pertains to Officials and high authorities of the public, private, and social sectors. Within this main group 11 there are subgroups, for example in 1996 the subgroup 111 pertained to physicists, astronomers, mathematicians, statisticians and actuaries; by 2010 the subgroup 111 pertains to government officials, legislators, and authorities. For this reason, it was necessary to reclassify the occupations in Mexico in order to make a comparative analysis between the two periods of study of the Mexican labor sector.
8 Kato, E. (2004). "Elasticity as a result of employment in the Mexican manufacturing industry", Problemas del desarrollo, vol. 35, no. 138, pp. 87-96, México.
9 Kato, E. (2004). "Elasticity as a result of employment in the Mexican manufacturing industry", Problemas del desarrollo, vol. 35, no. 138, pp. 87-96, México.
Received: September 24, 2016; Accepted: October 09, 2017
 Este es un artículo publicado en acceso abierto bajo una licencia Creative Commons
