


Services on Demand
Journal
Article
 text in
  English (pdf)
 Article in xml format
 Article references
 Send this article by e-mail
Indicators
-
 Cited by SciELO
 -
 Access statistics
Related links
-
 Similars in
SciELO
Similars in
SciELO
Share

 Permalink
Contaduría y administración
Print version ISSN 0186-1042
Contad. Adm vol.63 n.4 Ciudad de México Oct./Dec. 2018
https://doi.org/10.22201/fca.24488410e.2018.1359
Articles
International trade logistics of Pacific Region through a Network Data Envelopment Analysis
1Universidad Michoacana de San Nicolás de Hidalgo, México.
The aim of this research is to identify the degree of efficiency or inefficiency of the foreign trade logistics network (exports) from 17 countries that make up the Pacific region, as well as to analyze which variables can be improved and to what extent so that countries that do not Are efficient to achieve the optimization of their resources. The methodology proposed for the present research is the non-parametric model called Data Envelopment Analysis (DEA) Network presented in two stages in the first stage or node are used as inputs the variables customs, infrastructure and transport services and as outputs of the First node or stage and inputs in the second stage or node the variables logistic services, costs and execution time and finally the variables volume and value of exports were used as outputs for the second node. The results show that only Singapore obtained the three types of efficiency analyzed (Global Technical Efficiency, Pure Technical Efficiency and Scale Efficiency), while some countries show only Pure Technical Efficiency such as Mexico, China, Indonesia, New Zealand, Peru, Singapore and Thailand which shows that most countries are not operating at an optimal scale despite the fact that some countries make good use of their resources.
Keywords: Efficiency; logistics; foreign trade; DEA; Network
JEL classification: F10; F20; R40; R42
El objetivo de la presente investigación es identificar el grado de eficiencia o ineficiencia de la red logística del comercio exterior (exportaciones), de 17 países que conforman la región de la Cuenca del Pacífico, así como analizar que variables pueden mejorar y en qué medida para que los países que no son eficientes logren la optimización de sus recursos. La metodología propuesta para la presente investigación es el modelo no paramétrico de Análisis de la Envolvente de Datos (DEA) Network, presentado en dos etapas en la primer etapa o nodo, se utilizan como inputs las variables aduanas, infraestructura y servicios de transporte y como outputs del primer nodo e inputs en el segundo nodo, las variables servicios logísticos, costos y tiempo de ejecución y finalmente las variables volumen y valor de las exportaciones fueron utilizadas como outputs para el segundo nodo. Los resultados muestran que solo Singapur obtuvo los tres tipos de eficiencia analizados (Eficiencia Técnica Global, Eficiencia Técnica Pura y Eficiencia de Escala) mientras que, algunos países muestran solo Eficiencia Técnica Pura tales el caso de México, China, Indonesia, Nueva Zelanda, Perú, Singapur y Tailandia lo que muestra que la mayoría de los países no están operando a una escala óptima a pesar de que algunos aprovechan bien sus recursos.
Palabras clave: Eficiencia; logística; comercio exterior; DEA, Network
Clasificación JEL: F10; F20; R40; R42
Introduction
The probable origin of the term logistics is from the Greek logistikos, meaning “skilled in calculating” (BTRE, 2001). According to the Council of Logistics Management, logistics can be defined as a part of the supply chain process that plans, implements and controls the efficiency, forward and backward flow, and the storage of goods and services and information between the point of origin and the destination to satisfy the needs of the clients (Tilanus, 1997).
Logistics were initially utilized by the military who, through it, would efficiently plan military strategies in battlefields. Subsequently, logistics became an important part of the integral system of the production process. Its development was originated during the recession of the United States in the 1950s, when the industrial sector placed special importance on the circulation of merchandise. However, the term as such, was not a subject that interested academia until the 1960s.
The concept of logistics as an integrated management arises in the 1980s, where the physical distribution function is added to logistics as a response to the deregulation of transport and the growing globalization (Coyle, Langley, Gibson, Novack, & Bardi, 2009). In the mid1980s, logistics was recognized as a key element of trade, considering within its elements the costs of transport and storage (BTRE, 2001). However, it was in the middle of the 20th century when the rise of studies concerning international trade logistic systems began, as well as the acknowledgment of logistics as a vital element of business activities and to maintain competitiveness (Tseng, Yue, & Taylor, 2005).
A global trade competitive network is the epicenter of international trade (Arvis & et al., 2010). The new competitive reality presents a space where flexibility, speed of entry into the market and productivity will be the key variables that will determine the permanence of companies in the markets. It is here where the foreign trade logistics play a crucial role, parting from the efficient management of the flow of goods and services towards the end consumer (Monterroso, 2000).
Today, due to a stronger interconnection in the markets, foreign trade logistics has become a key factor in foreign trade, mainly due to two factors: costs and time.
Distances have increased the need of an adequate planning for the consumer to access the product they desire at the moment that they so require. To this end, it is essential that the products move through an integrated system at an accessible cost that allows the efficient performance of foreign trade. For these reasons, logistics is extremely important for companies (Yardımcıoğlu et al., 2012).
This research is structured in four sections: the first introduces foreign trade logistics; the second presents a review of the literature on efficiency in foreign trade logistics; the third addresses the methodological elements of the DEA Network model to calculate the global technical, pure technical and scale efficiency, as well as the node benchmarking and slacks variable analyses; and the fourth reviews the results obtained with the DEA Network measurements, thus identifying the economies of the region that comprise the Pacific Rim that efficiently utilized their resources. Lastly, the conclusions are established, highlighting the importance of the efficient use of resources through a logistic network to generate a greater volume and value of foreign trade.
Empirical studies of the efficiency in international trade logistics
According to Tuzun (2015), the logistic services, information systems and infrastructure resources are the three components of the system and are intimately linked. As such, the interaction of these main components in the logistic system is interpreted in the following manner: logistics services allow the movement of materials and products, thus logistics services comprise physical activities such as transportation and storage; as well as non-physical activities such as the design of the supply chain, etc.
Szymonik (2014) mentions that international logistics is comprised by two basic elements: the configuration of an international logistics system or network and a dimension of the international supply chain or the international operating channels of international trade. These basic elements include routes for all types of transportation, storage, logistic centers, terminals, containers, transportation equipment and their facilities, means of transmission and tracking, inspection points and skilled human resources throughout the network.
Several authors such as Coskuntunce (2014), Loder (2014) and Gebresenbet and Bosona (2012), state that the volume of international trade significantly improves among the countries that possess global networks and efficient logistics infrastructure. Therefore, logistics operations have become more important within the international trade framework. For these reasons, logistics services have become more relevant and are an essential part of the efficiency and effectiveness of foreign trade operations.
There are different perspectives concerning the study of international logistics; while looking to outline the problems that Japanese firms have concerning their operations in China, Yu (2011) identifies three elements that influence logistics competitiveness: process quality, costs and delivery times. Easton (2003) indicates in a comparative study of several countries that the international supply chain is highly inefficient and unreliable; additionally, he comments that a poor logistics and operational infrastructure limits the economic development and performance of local and foreign companies.
Ta et al. (2000) analyzed the international logistics performance of Singapore and found that one of the most important limitations for competitiveness in this country are transport problems. Carter et al. (1997) carried out a study to identify logistic barriers between the United States and China, discovering different problems that affect foreign trade competitiveness between these two countries, problems that include aspects such as transportation, bonded warehouse, import and export services and costs.
Yasui (2012), in his work “Customs Environmental Scan 2012”, carries out a study of the key factors that concern the international trade of merchandise and transport, measures and regulations of the borders, business practices and reinforcement of customs; where indicators such as the total volume of imports and exports, commercial treaties and agreements, trade facilitation and reinforcement of customs (profit, safety and intellectual property) stand out. Garaviz (2009), in his proposal for the development of a logistic cluster for a national and international competitive logistics corridor in Colombia, considers three factors to be key: access to markets, border administration and infrastructure of communication and transport.
The Florida Chamber of commerce, in its logistics study, considers the following as key factors for competitiveness in this sector: international transport systems, commercial flows, penetration of new foreign markets, capacity of the transport system and funds invested by the government sector. The importance of research on logistics operations in the international context has been acknowledged by Sweeney (1994), Hayashi et al. (2010) and Easton and Zhang (2002).
The World Bank (2013), in its report “Connecting to Compete 2012 Trade Logistic in the Global Economy”, utilizes the following variables: import and export time, red tape1 (such as import and export agencies, import and export documents) and delays, reliability and delivery services. The Logistics Performance Index (LPI) of the WB is a comparative tool carried out every two years to help countries identify the challenges and opportunities in their trade logistics performance, and to acknowledge the things that can be improved in said performance. The LPI (2014) allows comparing 160 countries and its results are based on surveys done on almost a thousand logistics professionals who provide qualitative feedback on the logistics reality of different nations.
LPI international: provides qualitative assessments of the countries on six defined areas, carried out by professionals in the world of logistics who work outside the country in question, with their indicators being:
Efficiency of the customs clearance process (customs).
Quality of the infrastructure related to commerce and transport (infrastructure.).
Ease of agreement for international shipments at competitive prices (international shipment).
Competence and quality in the logistic services (logistics competence).
Ability to monitor and track shipments, or traceability (tracking y tracing).
Frequency with which shipments arrive to the recipient in the programmed time, or punctuality (timeliness).
Two-stage DEA Network
The DEA (Data Envelopment Analysis) technique is an application of the linear programming methods, used to measure the relative efficiency of organizational units that have the same goals and objectives. This technique was initially developed by Charnes, Coopers and Rhodes (1978), who based it on a preliminary work by Farrell (1957).
The DEA technique is an alternative to the ratio and regression models, as it allows working with multiple input and output variables. Moreover, it does not require the variables of the models to collect special statistical characteristics, as this technique measures the efficiency of each country with regard to the other countries in the sample, providing greater flexibility in the selection of variables according to the different types of measures.
To calculate the relative efficiency of a firm, it is preferable to resolve the dual problem, a model that can be written in the following manner (Charnes et al., 1978):
Min 0,λ θ
s a:
-yi + λY ≥ 0
θxi - Xλ ≥ 0
λ ≥ 0
Where:
X = matrix of inputs K x N
Y = matrix of outputs M x N
θ is a scalar. Multiplies the vector of inputs
λ is a vector of constants N x 1. Multiples the matrix of inputs and outputs.
N = number of firms
The model presented assumes that all the cases called DMUs2 (countries in the case of this research) are operating at an optimal scale with constant returns to scale (CRS).
Subsequently, Banker et al. (1984) suggest an expansion of the model towards situations of variable returns to scale, modifying the linear program by incorporating a convexity restriction3 (N1’λ= 1). To differentiate it from the former, it is referred to as variable returns to scale (VRS), and the expression of the same is the following:
min 0,λ θ
s a:
- yi + λY ≥ 0
θxi - Xλ ≥ 0
N1 ́λ= 1
λ≥ 0
Where: N1 is a unitary vector N x 1.
Said modification allowed decomposing the technical efficiency into two parts: pure technical efficiency and scale efficiency. For this, the two models-CSR and VRS-must be calculated with the same data: if there is a difference between the two measurements for a specific firm, this means that there is an inefficiency of scale in said firm, and the inefficiency value is the difference between the CSR and VRS measurements.
The pure technical efficiency coincides with the VRS measurement. The inefficiency of scale originates from producing a suboptimal level of scale. The global technical efficiency is the product of the two efficiencies-pure technical and scale.
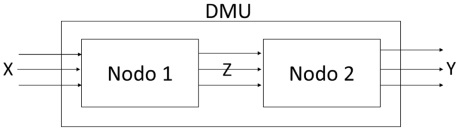
The two-stage DEA Network model considers that each DMU transforms some external X inputs into the final Y outputs, through the intermediary X measurements in a two-stage process, as shown in Figure 1 below.
Source: Own elaboration, 2016.
Figure 1 Construction of a two-stage model. Source: Own elaboration, 2016.
An example of this type of studies is the one presented by Charnes (1994), where a DEA model is applied in two stages to evaluate the policies and administration in the recruitment of the North American military. For his part, Zhu (2000) applies a two-stage model to analyze the financial performance of the first 500 companies according to the Fortune journal, through the generation of the best practice frontier through the eight financial performance variables that the journal utilizes for its classification.
Assume n DMUs (j = 1, ..., n), each one using m external entries xij, i = 1, ..., m in the first stage to produce q outputs zpj, p = 1, ..., q of this stage. The results obtained from the first stage are then utilized as inputs in the second stage to produce final products yrj, r = 1,..., s. In this basic context, only the external outputs to the first stage enter the system, and only the outputs of the second stage enter the system. Following the notation below:
j ϵ J = {1, ..., n}: Overall indices of the n DMUs.
j ϵ 2 J: Denotes the evaluated DMU.
Xj = (xij, i = 1, ..., m): The vector of the external inputs utilized by DMUj, j ϵ J
Zj = (zpj, p = 1, ..., q): The vector of the intermediate variables by DMUj, j ϵ J
Yj = (yrj, r = 1, ..., s): The vector utilized by the final products by DMUj, j ϵ J
n = (n1, ..., nm): The weight vector in the fractional model
v = (v1, ..., vm): The weight vector for the external inputs in the linear model.
u = (u1, ..., uq): The weight vector for the intermediate measures in the fractional model.
w = (w1, ..., wq): The weight vector for the intermediate measures in the linear model.
x = (x1, ..., xs): The weight vector for the final outputs in the fractional model.
m = (m1, ..., ms): The weight vector for the final outputs in the linear model.
e.g. o: The global efficiency of DMUj, j ϵ J
e.g. 1: The first stage efficiency by DMUj, j ϵ J
e.g. 2: The second stage efficiency by DMUj, j ϵ J
The model employed for this research has an output orientation, given that the objective of the logistics system is to increase the value and volume of international trade using the different elements that comprise the logistics network.
The DEA Network model proposed for this study has two stages comprised by nodes and intermediate variables. To this end, three tests (one for node 1, another for node 2 and a third one to verify the relation between the initial inputs and final outputs) were carried out through the factorial analysis, using the main components analysis technique to determine the validity of the inputs and outputs to be used in the study, as well as KMO4 tests for each analysis (see annex). Finally, it was determined that the models to be carried out in the research will be as follows:
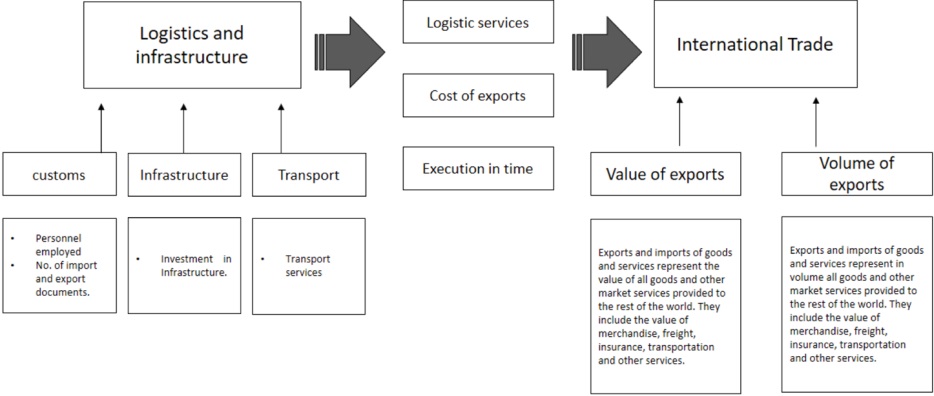
The first node or station is that of logistics and infrastructure, and is comprised by the Customs variable and the Infrastructure variable as inputs. The second node or station is that of international trade, and its outputs are the Value and Volume of the exports. The intermediate variables (that will act as outputs in the first station and as inputs in the second station) are International shipments, Logistics services, Traceability and Tracking, and Execution Time. The structure of the model can be better appreciated in Figure 2.
Source: Own elaboration, 2016.
Figure 2 DEA model network proposed in the logistics of international trade.
The data of the variables presented in Figure 2 were obtained from the database of the World Trade Organization, the World Customs Organization, and the World Bank for the year 2014, and are defined in the following manner:
a) Inputs
Customs personnel. Is comprised by the total number of people directly employed in customs.
Investment in infrastructure. This variable encompasses the infrastructure that is normally utilized to carry out logistics services such as storage, road, railroad, port and airport networks, employed and skilled personnel, construction, maintenance and investment in logistics infrastructure.
International freight services. This encompass all the transport services (maritime, air, land, internal rivers, spatial and duct) provided by the residents from one economy to the other, which involves the movement of goods (freight), the lease of carriers with crew, as well as the corresponding support and auxiliary services.
b) Intermediate outputs/inputs variables
Logistics Services. Includes the insurance and financial services, and other services related to the logistics of exported goods such as: freight insurance on exported goods and other direct insurance policies, such as life insurance; financial intermediation services, such as commissions, exchange transactions and brokerage services; and auxiliary services, such as operation and market regulation services.
Cost of exports. The cost calculates the rates applied to a 20 feet container in US dollars. All the charges linked to the realization of the procedures to export the products are included. These include documentation costs, administrative fees for customs clearance and technical control, fees of the customs clearance agents, handling expenses at the terminal and land transport. The calculation of the cost does not include fees or commercial taxes. Only the official costs are registered.
Execution Time. Refers to the delivery of products within the established time frames. The time is registered in calendar days. The calculation of time for a procedure starts at the moment in which it is initiated and executed until it has been concluded. If a procedure can be accelerated at an additional cost, the faster legal procedure is chosen. The waiting time between procedures-for example, during the unloading of the product-is included in the measurement.
c) Outputs
Value of the exports. Represent the overall value the goods and other market services provided to the rest of the world, including the value of the goods, freights, insurance, transport and other services.
Volume of the exports. Represent the overall volume of the goods and other market services provided to the rest of the world, including the value of the goods, freights, insurance, transport and other services.
Results
The results are presented in three sections; the first corresponds to the efficiency values obtained with respect to different types of efficiency, these being Global Technical Efficiency, Pure Technical Efficiency and Scale Efficiency. The second section shows the benchmarking behavior by node, thus making it possible to see the countries considered a point of reference according to the use of their resources and the results obtained (inputs-outputs). Finally, in the third part of the results the slacks variables are presented, as well as the projections. This is done in order to not only determine the efficiency or inefficiency of the countries with respect to the variables, but also to present proposals to correct the use of logistics resources for international trade in the inefficient countries.
Efficiency results
The Global Technical Efficiency (GTE) is calculated considering constant returns (CRS), that is, if the quantity of each of the factors is increased, the production increases at the same rate. The results of said efficiency are shown in column three, where it can be observed, in Table 1, that only Singapore is efficient.
Table 1 Efficiency results
| NO | DMU | GTE (CSR) | PTE (VRs) | SE | TYPE |
|---|---|---|---|---|---|
| 1 | Australia | 0.272299 | 0.01816 | 67.77% | decreasing |
| 2 | Canada | 0.077711 | 0.182582 | 42.56% | decreasing |
| 3 | Chile | 0.389024 | 0.429169 | 90.65% | decreasing |
| 4 | China | 0.210561 | 1 | 21.06% | decreasing |
| 5 | Korea | 0.420072 | 0.553939 | 75.83% | decreasing |
| 6 | United States | 0.051111 | 0.22812 | 22.41% | decreasing |
| 7 | Philippines | 0.371018 | 0.669324 | 55.43% | increasing |
| 8 | Hong Kong, China | 0.275776 | 0.643159 | 42.88% | decreasing |
| 9 | Indonesia | 0.376691 | 1 | 37.67% | increasing |
| 10 | Japan | 0.086221 | 0.217862 | 39.58% | decreasing |
| 11 | Malaysia | 0.432685 | 0.600356 | 72.07% | increasing |
| 12 | Mexico | 0.178268 | 1 | 17.83% | decreasing |
| 13 | New Zealand | 0.741265 | 1 | 74.13% | increasing |
| 14 | Peru | 0.794694 | 1 | 79.47% | decreasing |
| 15 | Russia | 0.10463 | 0.504205 | 20.75% | decreasing |
| 16 | Singapore | 1 | 1 | 100.00% | constant |
| 17 | Thailand | 0.684226 | 1 | 68.42% | increasing |
Source: own elaboration based on the dea NETWORK results.
The Global Technical Efficiency can be broken down into two efficiencies: Pure Technical Efficiency (PTE) and Scale Efficiency (SE). Pure Technical Efficiency encompasses variable returns (VRS) for the measurement of efficiency. In this manner, it shows the extent to which the analyzed productive unit extracts the maximum return of the physical resources available to it, that is, this type of efficiency analyzes how well a productive unit performs with the existing technology. For this case, the international trade logistics system of a country also works, given the resources that it utilizes.
Scale efficiency is relevant when the production technology presents variable returns to scale. Therefore, it shows if the unit has achieved the optimal scale point. In other words, returns to scale are obtained by proportionally increasing the number of factors that intervened in the production function. Due to the fact that only one country presented Scale Efficiency (Singapore), the results imply that most of the countries are not operating at an optimal scale, despite the fact that some of them make good use of their resources.
The results of the GTE and SE are reflected on the global technical efficiency standards, showing that they are not at an efficiency level as such-equal to 1-that is, they are not extracting the maximum feasible physical production given the existing technology with regard to foreign trade.
The last column allows classifying the results according to their types of returns to scale, which can be: increasing, decreasing, and constant.
The countries that showed growing values or for which the increase of a factor creates a greater rate rise to the initial increase are: Philippines, Indonesia, Malaysia, New Zealand and Thailand; the only country that showed a constant return was Singapore; and lastly, the countries that showed decreasing values were Australia, Canada, Chile, China, Korea, United States, Hong Kong, Japan, Mexico, Peru and Russia.
Benchmarking results
When analyzing benchmarking by nodes, it can be observed that for the first node (logistics and infrastructure) more countries are used as points of reference than in the second node (international trade). This stipulates that despite the fact that the Customs, Infrastructure and Transport variables are highly significant in the efficiency of international trade, it is not necessarily the same countries that are being referenced in both nodes.
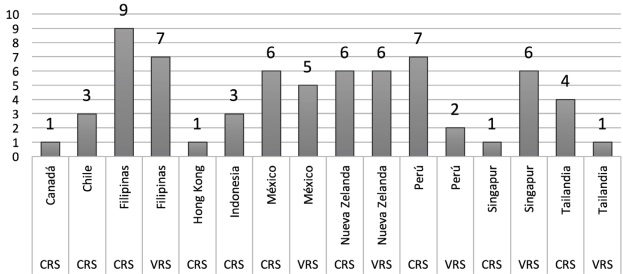
In the case of node 1, the Philippines is the country most used as a reference point with nine mentions for constant returns (CRS) and seven for variable returns (VRS), followed by New Zealand with six mentions, for both constant and variable returns, and Mexico with six mentions for constant returns and five for variable returns. It is worth noting cases such as that of Peru and Singapore. For constant returns, Peru is taken as a point of reference seven times, while for constant returns it is referenced only twice. Meanwhile Singapore shows the opposite effect, for variable returns it is referenced six times, and for constant returns only once (see Figure 3).
Source: Own elaboration based in the results of the DEA Network.
Figure 3 Benchmarking of node 1: logistics and infrastructure.
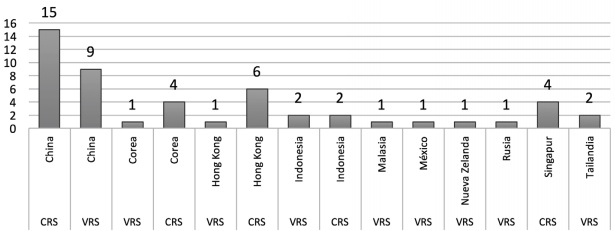
For the case of node 2 (see Figure 4): international trade, it is clear that China is the most referenced country as a role model, obtaining 15 mentions for constant returns and nine for variable returns; following China, it is Hong Kong, Korea and Singapore (the three with constant returns) that are referenced; six times the first, and four times the second and third.
Results of the slacks variables and projections
The slack analysis allows observing the excess of inputs and lack of outputs for DMUs within the model, indicating the variables that are limiting the efficiency for each analysis unit (Cooper, Seiford & Tone, 2000). When a DMU is shown as inefficient when carrying out a radial reduction on it towards a projected efficient point, it continues offering the possibility of a reduction of inputs. Therefore, said projected point cannot be considered truly optimal, as there may be the possibility for another utilization producing a similar number of outputs with a smaller consumption of inputs.
The distance between the efficient point radially projected to the reference efficient utilization is called slacks. Its measure will provide the slack inefficiency. According to the aforementioned, it is necessary to plan a second stage in the determination of the efficiency in order to eliminate the effect of the slacks inefficiency. Subsequently, the common consideration of both measures (radial and slack) will provide the technical efficiency (Coelli, 1998).
Through the analysis of the Slacks variables, the direction in which the inputs must be reduced is obtained, as well as the direction to increase the outputs to convert the inefficient DMUs into efficient ones. This section carries out the analysis for each of the divisions of the model, denominated nodes.
For node 1, the recommendations concerning the Customs, Infrastructure and Transport services variables are reviewed (see Table 2).
Table 2 Results of the Slacks variables and node 1 projections
| DMU | Slack (documents to export) | Slack (customs personnel) | Slack (Transport Services) | Slack (Investment in Infrastructure) |
|---|---|---|---|---|
| Australia | -664378.86 | 0.00 | 0.00 | -1624412952.08 |
| Canada | 0.00 | -3523.25 | 0.00 | -13822211728.71 |
| Chile | 0.00 | 0.00 | -9.60 | -204371793929.66 |
| China | -38863569.53 | -32530.60 | 0.00 | -387856950473.28 |
| Korea | -11536754.69 | 0.00 | 0.00 | 0.00 |
| United States | -11764061.73 | -37568.94 | 0.00 | -61774346186.33 |
| Philippines | 0.00 | -1112.86 | 0.00 | 0.00 |
| Hong Kong, China | -8494702.67 | 0.00 | 0.00 | 0.00 |
| Indonesia | 0.00 | -4718.25 | 0.00 | 0.00 |
| Japan | -13492395.59 | 0.00 | 0.00 | -1203490968179.95 |
| Malaysia | -2446047.51 | -7861.96 | 0.00 | 0.00 |
| Mexico | 0.00 | 0.00 | 0.00 | 0.00 |
| New Zealand | 0.00 | 0.00 | -4.20 | 0.00 |
| Peru | 0.00 | 0.00 | 0.00 | 0.00 |
| Russia | 0.00 | -29268.40 | 0.00 | -16437335458.96 |
| Singapore | 0.00 | 0.00 | 0.00 | 0.00 |
| Thailandia | -1532643.81 | -1863.21 | 0.00 | 0.00 |
Source: Own elaboration based on the results of the DEA Network
Concerning the Customs variable, measured through the number of documents and customs personnel, it is obtained that: with regard to the number of electronic and physical documents, it is necessary (according to the results shown in Table 2) that customs in the United States, Hong Kong, Australia and Thailand, decrease the number of requested documents to carry out exports; while China, Japan and Korea, given the level of outputs that they obtain, could even increase the number of required documents, without this affecting the value and volume of their exports. Regarding the customs personnel, the results of the slacks show that the United States, China and Russia, mainly, have too many staff according to their results or outputs obtained. The same is true, to a lesser extent, for Malaysia, Indonesia, Canada, Thailand and the Philippines. It is worth pointing out that this number of employees could be due to the level of safety intended to be implemented in said customs offices. This is because customs have two functions: the facilitation of foreign trade and national security; nevertheless, for the analyzed variable-Foreign Trade-a smaller number of staff could be used and achieve a better output.
With regard to the Infrastructure variable, the results of the Slacks variables show a higher expense with respect to the results obtained for the United States, Chile, Russia, Canada and Australia. It is important to highlight that the expense in transport infrastructure encompasses the infrastructure that is normally utilized to carry out logistics services, such as warehouses, road, railroad, maritime and air networks, employed and skilled personnel, construction, maintenance and investment in logistics infrastructure, so it is not only useful for cargo transport, but also serves the dual purpose of promoting tourism, the transport of individuals, etc. Therefore, this excess expense could represent an investment to promote tourism and could offer a better communications service to individuals. Conversely, for the cases of Japan and China, the results of the Slacks variable recommends an increase in the expense on infrastructure in order to achieve a higher efficiency in foreign trade.
For the Transport variable, most of the analyzed countries are efficiently utilizing their transport services (maritime, air, land, internal rivers and ducts) that involve the movement of goods (freight), with the exception of Chile and New Zealand, which could decrease the use of cargo transport, maybe by utilizing transport under the co-modal concept, that is, that a same means of delivery transportation also returns with a load, reducing costs and time.
In node 2 (Table 3), the recommendations concerning the Cost, Insurance and Logistics Services variables and Execution Time are reviewed.
Table 3 Results of the Slacks variables and node 2 projections
| DMU | Slack (Cost exports) | Slack (Insurance and financial services) |
Slack (Execution Time) |
|---|---|---|---|
| Australia | 14.45 | -1.46 | 1.45 |
| Canada | 256.09 | -3.03 | 2.22 |
| Chile | -23.35 | 0.25 | -0.85 |
| China | 4170.46 | 52.88 | 7.99 |
| Korea | 573.23 | 2.11 | 1.69 |
| United States | 3353.50 | 34.16 | 6.66 |
| Philippines | -221.29 | 0.86 | -0.70 |
| Hong Kong China | 545.14 | -6.07 | 0.91 |
| Indonesia | 71.58 | 2.71 | -0.86 |
| Japan | 1250.25 | 2.67 | 4.05 |
| Malaysia | -32.54 | 0.05 | 0.65 |
| Mexico | 0.00 | 0.00 | 0.00 |
| New Zealand | -302.43 | -0.74 | 0.44 |
| Peru | 0.00 | 0.00 | 0.00 |
| Russia | 1580.59 | 13.81 | 3.24 |
| Singapore | 0.00 | 0.00 | 0.00 |
| Thailand | -97.88 | 1.69 | -0.16 |
Source: Own elaboration based on the results of the Network DEA.
According to the results of the slacks, for the Costs of Exports variable, New Zealand, Philippines, Thailand, Malaysia and Chile need to reduce the cost that exporting entails; while, in descending order, China, the United States, Russia, Japan, Korea, Hong Kong, Canada, Indonesia and Australia could increase their costs and continue being efficient with the current volume and value of their exports. It is important to point out that, theoretically, the aim is to reduce costs to be more competitive. However, what the model indicates in this point is that costs could increase without affecting the efficiency of their foreign trade, and this could imply a benefit for the personnel that works in these areas, implying a direct improvement for their families and an indirect and consequent improvement in the welfare of their communities. For the cases of Mexico, Peru and Singapore, the cost of their exports is adequate according to the model.
Regarding the insurance policies and logistics services, Hong Kong, Canada, Australia and New Zealand could decrease their logistics services to be efficient; while China, the United States, Russia, Indonesia, Japan, Korea, Thailand and, to a lesser extent, Philippines, Chile and Malaysia, with value of 0.86, 0.25 and 0.05, respectively, must reduce their insurance policies and logistics services to be efficient. This suggest an excessive use of controls for the goods or a higher cost of insurance and contracted services with respect to the other countries.
Finally, the results of the Execution Time for the Slacks variables show that, in general, the countries that comprise the analysis have good execution times with respect to their foreign trade and the set of analyzed variables. It is interesting to note that the projections in days show different assumptions for each country corresponding to the set of variables, showing the number of optimal days for each country. In this manner, while for one country the number of optimal days could be a day and a half (1.5) as is the case for Peru, for China it could be of ten days (9.99), this according to their particular situations and, as has already been noted, the set of analyzed variables. The countries that need to decrease the execution time are Chile, Indonesia, Philippines and Thailand.
Conclusions
The theoretical foundations of the research are based on the concept of logistics and efficiency. Logistics taken as an example of a systems approach to solve problems within foreign trade, and efficiency as a part of competitiveness that references the achievement of goals with the least amount of resources, or operating so that resources are more adequately utilized.
Counteracting the theory with the results, it can be observed that there are more countries, with regards to global technical efficiency, that show efficiency. With these being China, Indonesia, Mexico, New Zealand, Peru, Singapore and Thailand; said results indicate that the countries that showed efficiency in this column are adequately utilizing their available physical resources. There are several researches that utilize the same technique (DEA) in matters of logistics, particularly transport, where the authors conclude that investment in infrastructure and transport is very important, as it increases their quality and network, and allows reducing costs and times in the transport of people and goods, creating a greater coverage and connectivity.
The aim of this research is to identify the degree of efficiency or inefficiency of the logistics network of foreign trade, particularly of the exports of 17 countries that comprise the Pacific Rim region, as well as to analyze the variables that can be improved and to what extent so that the inefficient countries are able to optimize their resources. According to the objective of the research in this work, the measurement of the technical scale and pure efficiency of a constant return model with output orientation is presented through the DEA methodology. The variables of 17 countries in the Pacific Rim region are analyzed for the year 2014.
Based on the input and output data utilized to carry out the calculation of the efficiency levels for each country concerning foreign trade, it is possible to observe and conclude that Singapore is the country that shows the three types of analyzed efficiency (Global Technical Efficiency, Pure Technical Efficiency, and Scale Efficiency). While the countries of China, Indonesia, Mexico, New Zealand, Peru, Singapore and Thailand showed Pure Technical Efficiency, thus it can be concluded that they are adequately utilizing their available physical resources.
Regarding the benchmarking analysis, it can be concluded that the country with the best practices is the Philippines, while in the second node, it is China.
For the case of Mexico, it can be observed that despite a proper utilization of the available resources, it is not achieving an optimal level given the existing technology. Mexico will have to increase its Scale Efficiency and Global Technical Efficiency by 82.17 percent. The projections to achieve efficiency for Mexico are: an ideal execution time of 3 days, with an approximate cost of 1,499.30 dollars, with customs personnel of 7,347 people, mainly.
It should be noted that the technique utilized only analyzes the use of the existing resources and the results obtained with the utilization of the same, as well as comparatively with respect to the set of analyzed countries; therefore, the level of lag in the logistics infrastructure of some of the countries is not considered in this research.
Finally, the results show the need to implement an industrial policy that improves the technological lag and is more focused on the improvement of innovation and technology, strengthening labor training, specifically in micro, small and medium-sized companies, which are the ones that integrate most of the export sector.
Annex
Table A.1 shows the KMO and Bartlett test for node 1.
| Kaiser-Meyer-Olkin sampling adequacy measure | .948 | |
| Bartlett sphericity test | Approx. Chi-squared | 44.537 |
| gl | 21 | |
| Sig. | .002 | |
Table A.2 Communalities shows the levels of extraction or signifcance of the variables considered for node 1.
| Initial | Extraction | |
|---|---|---|
| Documents to export | 1.000 | .950 |
| Customs personnel | 1.000 | .930 |
| Transport services | 1.000 | .855 |
| Export costs | 1.000 | .854 |
| Insurance and financial services | 1.000 | .962 |
| Execution time | 1.000 | .923 |
| Investment in infrastructure | 1.000 | .804 |
Method of extraction: analysis of main components.
Table A.3 shows the KMO and Bartlett test for node 2.
| Kaiser-Meyer-Olkin sampling adequacy measure | .611 | |
| Bartlett sphericity test | Aprox. Chi-squared | 33.128 |
| gl | 10 | |
| Sig. | .000 | |
Table A.4 Communalities shows the levels of extraction or signifcance of the variables considered for node 2.
| Initial | Extraction | |
|---|---|---|
| Export costs | 1.000 | .902 |
| Insurance and financial services | 1.000 | .499 |
| Execution time | 1.000 | .887 |
| Exports value | 1.000 | .929 |
| Exports volume | 1.000 | .858 |
Method of extraction: analysis of main components.
Table A.5 shows the KMO and Bartlett test for the initial inputs and fnal outputs.
| Kaiser-Meyer-Olkin sampling adequacy measure | .590 | |
| Bartlett sphericity test | Aprox. Chi-squared | 50.766 |
| gl | 15 | |
| Sig. | .000 | |
Table A.6 Communalities shows the levels of extraction or signifcance of the variables considered for node 2.
REFERENCES
Arvis, J.; Saslavsky, D.; Ojala, L.; Shepherd, B.; Busch, Ch.; Raj, A.; Naula, T. (2016). Connecting to Compete 2016: Trade Logistics in the Global Economy--The Logistics Performance Index and Its Indicators. World Bank, Washington, DC. © World Bank. https://openknowledge.worldbank.org/handle/10986/24598 License: CC BY 3.0 IGO. [ Links ]
BTRE (2001) Logistics in Australia: A Preliminary Analysis. Bureau of Transport and Regional Economics, Canberra, <http://www.btre.gov.au/docs/wp49_contents.htm>. [ Links ]
Carter, J. R. J., Pearson, N. y Peng, L. (1997). Logistics Berries to International Operations: The Case of the People’s Republic of China. Journal of Business Logistics. Oak Brook. Vol.18 No.2, 129-145. [ Links ]
Charnes A, Cooper W, Rhodes E. (1978). Measurement the efficiency of decision making units. European Journal of Operational Research, 429-444. [ Links ]
Charnes, A, Cooper, W.W., Lewin, A.Y and Seiford, L.M. (1994). Data envelopment analysis: theory, methodology and application. Boston: Kluwer Academic Publishers. [ Links ]
Charnes, A., Cooper, W. y Rhodes, E. (1978). Measurement the Efficiency of Decision Making Units. European Journal of Operational Research, 429-444. [ Links ]
Coelli, T. (1998). A Multistage Methodology for the Solution of Orientated DEA Models. Operation Research Letters. Vol 23, Iss 3,5, 143-149. [ Links ]
Cooper, W.W., L. Seiford L. y K. Tone (2000). Data Envelopment Analysis: A Comprehensive Text with Models, Applications, References and DEA-Solver Software. Kluwer Academic Publishers. [ Links ]
Coskuntuncel, A. (2014). Defining the advancement of logistic sector of mersin. Master ́s Thesis, Mersin University Institute of Social Sciences, Mersin. [ Links ]
Coyle, J., Langley, J., Gibson, B., Novack, R., & Bardi, E. (2009). Supply Chain Management: A Logisitics Perspective. USA: Cengage Learning. [ Links ]
Easton, R. (2003). On the Edge: The Changing Face of Supply Chain Management in China. Supply Chain Perspectives. Accenture, 15-35. [ Links ]
Easton, R. y Zhang, T.B. (2002). Supply Chains in Asia: Challenges and Opportunities. Supply Chain Management. Accenture, pp. 5-11. [ Links ]
Farrell, M. J. (1957). The Measurement of Productive Efficiency. Journal of the Royal Statistical Society. Vol. 120, Part III. [ Links ]
Garaviz, E. (2009). Propuesta para el desarrollo de un cluster logístico para un corredor logístico nacional e internacional competitivo en Colombia. Universidad del Colegio Mayor de Nuestra Señora del Rosario, Bogotá, Colombia. [ Links ]
Gebresenbet, G. and T. Bosona. (2012). Logistics and supply chains in agriculture and food, pathways to supply chain excellence. Dr. Ales Groznik (Eds), ISBN: 978-953-510367-7, InTech: 125-146. Available from http://www.intechopen.com/books/pathways-to-supplychain-excellence/logistics-chains-infood-andagriculture-sector. [ Links ]
Hayashi, T. Nemoto, N. Hashimoto y F. Kobayashi (2010). Procurement logistics of auto parts in inland China A case study of Japanese auto manufacturers in Sichuan. Journal of Japan Logistics Society, 18, 201-208. [ Links ]
Loder, (2014). World bank logistic performance index published 2014, logistic organization. Available from http://www.loder.org.tr/announces.php?id=278. [ Links ]
Moorstenn, R.H. (1961). On Measuring Productive Potencial and Relative Efficiency. Quarterly Journal of Economics 75, 451-467. https://doi.org/10.2307/1885133 [ Links ]
Monterroso, E. (2000). El proceso logístico y la gestión de la cadena de abastecimiento. Obtenido de http://www.unlu.edu.ar/~ope20156/pdf/logistica.pdf [ Links ]
Sweeney, M. (1994). A Methodology for the Strategic Management of International Manufacturing and Sourcing. International Journal of Logistics Management. Vol. 24 No. 1, 55-65. https://doi.org/10.1108/09574099410805072 [ Links ]
Szymonik A. (2014). Information Technologies in Logistics, Lodz University of Technology, monographs. [ Links ]
Ta, H., Choo, H y Sum, C. (2000). Transportation Concerns of Foreign Firms in China. International Journal of Physical Distribution & Logistics Management. Vol. 30 No. 1, 35-54. https://doi.org/10.1108/09600030010307975 [ Links ]
Tseng, Y.-y., Yue, W. L., & Taylor, M. (2005). The Role of Trasnportation in Logistic Chain. Proceedings of the Eastern Asia Society for Transportation Studies , vol. 5, 1657-1672. [ Links ]
Tilanus, B. (1997). Information Systems in Logistics and Transportation. Elsevier Science Ltd., UK. [ Links ]
Tüzün, R. S. y Coskuntuncel, A. (2015). The International Logistics Center of Turkey: Situational Analysis of Mersin Port ́s Seaways Logistics. International Journal of Management and Sustainability, 4(4), 89-103. https://doi.org/10.18488/journal.11/2015.4.4/11.4.89.103 [ Links ]
Yardımcıoğlu, M., H. Kocamaz and Ö. Özer, (2012). Transportation systems in logistic management and cost methods, II. Regional Problems and Turkey Symposium, Kahramanmaraş, 245-259. [ Links ]
Yasui, T., (2012). Customs Environmental Scan 2012. WCO Research Paper No. 23. World Customs Organization. [ Links ]
Yu, L. (2011). Logistics Barriers to International Operations: A Case Study of Japanese Firm in China. International Conference on Economics and Finance Research. Ipedr. Vol. 4, Iacsit Press, Singapore. [ Links ]
Zhu, J. (2000). Multi-factor performance measure model with an application to Fortune 500 Companies. European Journal of Operational Research. 123 (1), 105-124. Vol. 44, No. 1 (Jan., 1998), 49-61 https://doi.org/10.1016/s0377-2217(99)00096-x [ Links ]
1The Red Tape indicators show a lack of coordination in the border, which creates the need for private operators in logistics operations.
3The convexity restriction allows defining the border considering that any linear consideration of two observed decision units will pertain to the production set, if said observed units also pertain to the same. Therefore, the elimination of this assumption and the maintenance of the postulates of strong inputs and outputs availability and variable returns to scale modify the manner of the border production and, consequently, transform the production set.
Received: December 29, 2016; Accepted: June 19, 2017
 Este es un artículo publicado en acceso abierto bajo una licencia Creative Commons
