


 nueva página del texto (beta)
 Inglés (pdf)
 Artículo en XML
 Referencias del artículo
 Enviar artículo por email
 Citado por SciELO
  Similares en
SciELO
Similares en
SciELO 
 Permalink
Introduction
The electricity sector in Brazil has been through deep changes since the sector was privatized in the `90s and - with the segregation of generation, transmission and distribution - companies started competing against each other, stimulating competition. In the next decade, the sector had a crisis, causing blackouts and rationing, which led to an increase in energy tariffs. Agencies emerged with the purpose of regulating and supervising the sector (Aneel, 2012).
The National Electric Energy Agency (ANEEL) adopted the methodology of Benchmark Company to determine the maximum values of electricity tariffs of each of the distribution concessionaires. The benchmark company is a dummy company located in the concession area of distribution that mimics the operational conditions of the distributor, established with the purpose of ensuring customers the tariff paid beholds efficiency in service delivery, once the consumer has not the possibility to choose another supplier. With the exception of free customers, who can opt to choose the electricity distribution company (Aneel, 2012).
In 2012, the Federal Government proposed a reduction of the tariff, benefitting several sectors of society, especially the industry, which concentrates half of the national consumption. Companies are encouraged by the National Electric Energy Agency (ANEEL) to be efficient and to reduce their operating costs (Abradee, 2012). As ANEEL pre-establishes the tariffs consumers need to pay, distributors must continuously seek efficiency, aiming to reduce their costs and expenses to attain profit.
Among the main techniques, which can be employed to measure the relative efficiency of a group of companies, is the data envelopment analysis. This is a non-parametric technique able to identify the efficient frontier for similar units, from more efficient production units, using multiple inputs and outputs (Cullmann & Hirschhausen, 2014).
The energy savings provides social, environmental and competitiveness benefits to society, enabling the government and the entrepreneur to direct resources to other priorities without quality loss. In this context, the general objective is to determine the relative technical efficiency in the Brazilian distribution companies of electrical energy.
For the achievement of the general objective established, we propose the following specific objectives: (i) determine the input variables (inputs) and products (outputs); (ii) determine the rates of relative technical efficiency of the analyzed units; (iii) identify the determinants of relative technical efficiency; (iv) identify the leading companies for the inefficient via the benchmarks.
The electricity sector takes on considerable significance towards productivity and technical development of the country, in addition to providing key resources to the citizens. The pursuit of maximization of technical, economic and environmental efficiency in a sphere in which rates are fixed-rate and maintenance service is costly; it becomes essential for the attainment of corporate goals, which is obtain financial return.
In addition, the Federal Government, through the Provisional Act 579 (MP-579), issued a set of rules focused on the renewal of the licenses of power generation, transmission and distribution of energy. The MP-579 determines that the companies that agree to anticipate the renewal will have to promote tariff cuts, beneficial for both industrial and residential consumers. Therefore, to keep their profitability the concessionaires should increase their efficiency seeking cost reduction and maximizing output, as they will have affected its revenue by reducing costs.
This study was limited to determining the technical efficiency of the companies researched, estimating the relative efficiency rather than absolute efficiency. The data envelopment analysis determines index of relative efficiency, making the results valid only while companies remain equal. According to Coelli, Rao, ODonnell and Battese (2005) the results obtained with the data envelopment analysis depict the relative efficiency among the units analyzed, so that the result is limited to the sample used. Thus, the inclusion or exclusion of other companies in the sample will affect the results found. Therefore, the results displayed are valid only for the companies investigated, in the observed period.
This article has five sections. The first section shows the introduction to the subject justifying the significance of the study. We also mention the objectives and research limitations. The second section is comprised of the theoretical framework: (i) efficiency literature related to our study, (ii) data envelopment analysis and (iii) history of Brazilian electricity sector. Along the third section, we approach the dataset, model specifications, and inputs and outputs used in the efficiency analysis, which provided the achievement of the objectives established in this study. The fourth section details the results of the non-parametric approaches: DEA model CCR/CRS model with output orientation. We identified seven efficient companies, where 50% of them located in the Southeast region. We identified that population density, IDHM, concession area and network extension are not related to efficiency. The variables that most contributed to the achievement of efficiency were the Total Assets and Net Revenue. Lastly, the fifth section, mentions the conclusions reached and contributions for future studies.
Literature review
This section discusses literature review about Efficiency, Data Envelopment Analysis and the Brazilian Electrical Sector.
Efficiency
Before addressing the methods of efficiency analysis, a few concepts are required as, despite being simple, the definitions are not very accurate (Cook & Zhu, 2015). For the authors, we can obtain productivity through the ratio, which was produced and spent in order for such output happen. The authors use the equation Productivity = outputs/inputs. Efficiency is the characteristic of a production unit to achieve the best performance with minimal errors and/or resource consumption (Pyatunin, Vishnyakova, Sherstneva, Mironova, Dneprov, & Grabozdin, 2015).
According to Carvalho, Boente, Steppan and Mól (2014), the company’s efficiency can be analyzed based on an economic perspective (allocative efficiency) or on a productive point of view (productive efficiency). Therefore, a company may be technically efficient but can still improve their productivity to increase the economic range. The author believes that productive efficiency is connected to the concepts of economic rationality and material productivity, showing the company's ability to obtain better results using minimal resources.
Cook and Zhu (2015) emphasize that the construction of the production boundary technique and productive efficiency indicators - called Data Envelopment Analysis DEA - allows efficiency analysis from two aspects, the technical and scale efficiency.
Technical efficiency is defined when a Decision Making Unit (DMU) is 100% efficient, if the performance of another DMU does not show that some of their inputs or outputs can be improved without aggravation of some of their other inputs or outputs. Technical efficiency takes place when a business can maximize the level of production according to inputs and technology available (Aparicio, Pastor & Zofio, 2015). A DMU may be a company or a non-governmental organization with multiple inputs and outputs (Camioto, Moralles, Mariano & Rebelatto, 2016).
According to Carvalho et al. (2014) the definition of economic efficiency is related to the profit of a company represented by the difference between revenues and costs. Peña (2008) concludes, when he says that economic efficiency is a complement of technical efficiency, when involving monetary aspects besides physical aspects. Therefore, a DMU can provide technical efficiency and not economic efficiency, because it did not take advantage of the best combination of inputs to reduce costs or increase revenues (Peña, 2008).
We conclude that the economic efficiency relates to producing more products with the same cost, or reducing costs while maintaining the same production. For this reason, it is necessary to reach technical efficiency, where the lowest possible level of inputs must be spent to produce a given level of output, or when you get the highest possible level of output with a given level of inputs. Therefore, the economic and technical efficiency are related.
According to Gumbau-Albert and Maudos (2002), efficiency is considered a determinant of cost of the strategic cost management, once the maximization of the production level could be achieved by a combination of factors. Riley (1987 as referred to in Hansen and Mowen, 2001) propose a list of determinants of costs, divided into two groups: structural (scale, scope, experience, technology and complexity) and execution (commitment of the workforce, total quality management, utilization capacity, efficiency of the layout of the premises, product configuration and operation of links in the value chain). Souza, Souza and Pessanha (2010) argue that the origin of productivity gains is primarily by market growth and increased consumption by the distributors. The productivity gain is due to the presence of economies of scale.
In this research, the method used to determine relative efficiency is the Data Envelopment Analysis, is discussed in the next section.
Data Envelopment Analysis
The Data Envelopment Analysis, DEA is a nonparametric mathematical technique which makes no assumptions regarding the distribution of inefficiencies or the functional form of the production function, developed by Charnes, Cooper and Rhodes (1978) used to measure the relative efficiency of several units of an organization (Charnes et al., 1978). It is intended for performance evaluation of a number of entities called Decision Making Units (DMU), which convert multiple inputs into multiple outputs (Cook & Zhu, 2015).
DEA uses input and output data themselves to compute the production possibility frontier. The efficiency of each DMU is measured as the ratio of weighted output to weighted input, where the weights used are calculated by the technique itself so as to reflect the unit at its most efficient relative to all others in the dataset (Johnes, 2006).
In 1978, the CCR model arose (the first letters of the authors´ last name: Charnes, Cooper and Rhodes) also called Constant Returns to Scale (CRS), which evaluated the total efficiency by identifying efficient and inefficient DMU, using multiple inputs and outputs, with the construction of a single virtual input and a single virtual product. Later in 1984, it was developed the BCC model, created by Banker, Charnes and Cooper, also known as Variable Returns to Scale (VRS). This model evaluates the technical efficiency and may present variable returns to scale that is, increasing or decreasing.
The CCR and BCC models can be oriented towards input and output. We use the input orientation when seeking to reduce the resources used, without changing the level of production. We apply the output orientation when seeking to maximize production, without modification on the resources employed. In an input orientation, outputs are fixed and the possibility of proportional reduction in inputs is inspected, whereas, in an output orientation, it is inputs which are fixed while the possibility of a proportional expansion of outputs is revised (Johnes, 2006).
The BCC models differ from the CCR models due to the insertion of the variables *u and *v, applied in the orientation toward input and output. These variables represent scale factors, indicating decreasing returns to scale when positive, or indicating increasing returns to scale, when negative. When they present null values are determined by constant returns to scale (Melo, Clímaco & Meza, 2009; Souza, Souza & Pessanha, 2010).
An advantage of using DEA method is that does not require the specification of particular production or cost functions and the ability to investigate changes in efficiency resulting from input saving, and also assess whether the reasons for such changes are, for example, improvements in scales (Rodríguez & Rodríguez, 2014).
Besides, Camioto et al. (2016, p.70) argue that DEA allows obtaining slacks, witch "each slack expresses to what degree the current performance of the DMU is distant, for each variable, from its ideal performance. This ideal performance can be considered a target for the ineficiente DMUs". Slacks are express in percentage level of improvement required for each variable of each DMU, they set how much each DMU should increase or decrease each variable to achieve efficiency, being represented by a virtual DMU (benchmark), which is at the efficient frontier (Camioto et al., 2016).
In the next section, we present the framework of the electrical energy sector.
Electrical Energy Sector
In 1996, the Project for the restructuring of Brazilian Electrical Energy Sector with the objective to encourage investment in the sector and to ensure the expansion of energy supply in Brazil was implemented. Following the restructuring, companies were no longer vertically integrated and there was the segregation of the activities in generation, transmission and distribution, making them independent (Abradee, 2012).
The distribution segment is the thread dedicated to delivering electrical energy to an end user. The distribution companies represent the connection between the electrical power sector and society, as their installations receive from transmission companies most of the supplies intended for the supply in Brazil (Aneel, 2012).
According to the Brazilian Association of Electricity Distributors (ABRADEE), the distribution sector services under a contract with the regulatory agency of the sector -ANEEL-, and is one of the most regulated and supervised in the electricity sector. At the state level, the distributors are still supervised in compliance with state regulatory agencies, such as the Regulatory Agency for Energy and Sanitation of the State of Rio de Janeiro (AGENERSA) and the Agency for Regulation of Public Services Delegates of Rio Grande do Sul (AGERGS). Hence, the energy distribution cannot set their own prices, as concessionaires are the public service power distribution, signatories of concession agreements that establish prices to consumers.
In these agreements, rules are established regarding price, regularity, continuity, security, timeliness and quality of services and care provided to consumers and penalties if ANEEL finds irregularities. The provisions establish that, the more efficient companies are regarding maintenance and operaon from distribution installations, avoiding disconnections for any reason, the higher their revenue (Aneel, 2012).
In September 2012, the Federal Government presented a MP-579, converted in Law nº 12.783/13, which deals with the renewal of concessions and establishes the reduction of the tariff. The electricity distributors received an offer regarding the possibility to renew their leases in advance without participating in the bidding; however, they should reduce charges levied on the tariff. The companies that fail to renew the concessions shall comply with the services until the end of the contract period between the years 2015-2017, during which the government will conduct bidding.
In view of Law 12.783/13, the distributors had a reduction worth of revenue, undermining the ability of investment and the quality of services, so companies should look to reduce costs and expenses, implementing strict management so that they can further the outcomes, operating with fewer resources.
In the following section, appears the methodological procedures used in this study.
Methodological procedures
This research established the technical efficiency in the electrical sector distribution companies from the data envelopment analysis through survey. In relation to the approach to the problem, we found it to be quantitative.
Population
We chose the companies listed on the BM&FBOVESPA with the sectorial classification Public Utilities/Electrical Energy/Electrical Energy, pertaining to the electricity distribution segment. We justify the use of the companies listed on the BM&FBOVESPA since they are traded companies, which allows data accessibility. Thus, the population make up to 18 electricity distribution companies, as shown in Figure 1.
Fig. 1 Effective population
| Company | State | Company | State |
|---|---|---|---|
| AES Sul | RS | CEEE-D | RS |
| AMPLA | RJ | CPFL-Paulista | SP |
| BANDEIRANTE | SP | CPFL-Piratininga | SP |
| CELPA | PA | ELEKTRO | SP |
| CEMAT | MT | ELETROPAULO | SP |
| COELBA | BA | ENERSUL | MS |
| COELCE | CE | ESCELSA | ES |
| CEMAR | MA | LIGHT | RJ |
Source: Authors from BM&FBOVESPA site
The choice is justified by the current moment the sector is inserted. The Law no. 12783/13 - which establishes the order of some costs and the reduction of tariffs being practiced by the distributors who anticipate the renewal of the distribution service - introduced changes that will provide consumers tariff moderateness, making it a more competitive segment. In addition, companies will have their profits reduced due to the third Tariff Review Cycle, because of decreased return on capital. Regarding the period of analysis, we decided to record data of 2012, as this research does not intend to present a longitudinal context.
Variables used
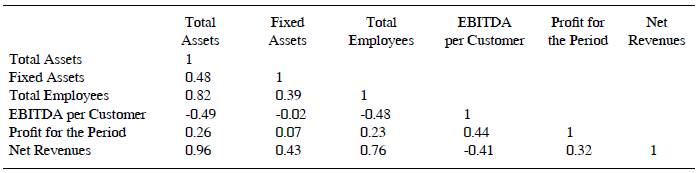
Previous studies outlined the input and output variables: Total Asset (Kassai, 2002); Fixed Assets (Chiu, Huang & Ma, 2011); Total of Employees (Çelen, 2013; Chiu, Huang & Ma, 2011), Profit (Saurin, Miranda and Costa Junior, 2010), Net Income (Chiu, Huang & Ma, 2011), EBITDA per customer (Anjos, Bordin and Melo 2010, Saurin, Miranda and Costa Junior, 2010). The results do not suggest collinearity in relations between input variables x input or product x product, which would signal the unviability of their use (Table 1).
The selected variables as inputs were: Total Asset (is the total of all assets of a company), Fixed Assets (tangible assets is usable for more than one year and are held for use in the production or supply of goods or services for rent or for administrative purposes) and Total of Employees (the total number of employees is given by the sum of staff and outsourced employees).
The variables selected as outputs were: Profit (profit or loss), Net Income: corresponds to gross revenues of the entity, from sales of goods or goods and services, minus the sales returns and canceled, the discounts granted unconditionally and taxes and contributions levied on sales and EBITDA per customer (representing the company's operating profit, disregarding financial income or expense). Anjos, Bordin and Mello (2010) argue that the use of the ratio EBITDA/ number of customers is more advisable than the use of isolated variable number of customers because companies with a larger number of customers are likely to have higher EBITDA.
Collection and Data Processing
Data were collected in the database of the BM&FBOVESPA, on the site www.bmfbovespa.com.br/Cias-Listadas/Empresas-listadas/BuscaEmpresaListada.aspx?segmento=Energia+Eletrica&Idioma=pt-br and through ANEEL’s site (http://www.aneel.gov.br/), between May and June of 2013.
The value of total assets and fixed assets were found from the balance sheet; the value of the result for the period and the net income derive from the Statement of Income, available on the BM&FBOVESPA’s site; the value of earnings before taxes, depreciation and amortization (EBITDA) were obtained on the unadjusted Administrative Report; the overall number of employees is located by the Social Report, and the number of customers of each company was located on ANEEL´s site, http://www.aneel.gov.br/area.cfm?idArea=550.
Regarding the manipulation of data, there was no need for treatment of established variables for analysis. Therefore, the variables: total assets, fixed assets, income statement and EBITDA were expressed in monetary values; variables: total number of employees and total number of consumers are in absolute numbers.
The EBITDA and income statement variables have negative results. An alternative was elevating them squared, however it was not a viable option, once CEMAT - the company that had the biggest loss among the companies in the sample - is considered efficient while using this procedure.
Another possibility is to add to variables EBITDA and income, the lowest observed value for all firms in the sample. The lowest value found for EBITDA was -696 863 and the lowest value found for the result for the period was -406 526. Despite this action, and with the use of Frontier Analyst ® software (FA) it was not possible to calculate the efficiency scores and the FA delivered the message: ‘Variable values by too many orders of magnitude 1502360/0.1’. To solve this problem, the outcome variable of the period still had their values divided by 1000, due to the high difference between the minimum and maximum values, which demonstrated to be more efficient and complied satisfactorily.
Based on Ali and Seiford (1990) and Kassai (2002), this change of the negative values to positive does not affect the classification of the efficiency scores. The variables presenting a null value had their values modified to 0.1, as the software does not work with zero values.
Method Application and Data Processing
In this research, we used the model DEA-CCR/CRS with output orientation (Figure 2). We used the CCR model, once Cava, Salgado Junior and Branco (2016, p.70) consider "that score measurement calculates the proportional maximum input reduction or the proportional maximum output expansion".The guidance was to output because according to Almeida, Mariano and Rebelatto (2006, p. 7), ‘this orientation is defined based on the configuration problem’ so the orientation of the model was chosen to be the output according with the purpose of research, since it you want to maximize outcome while maintaining the same amount of inputs.

In this model, vi and ur are respectively input i , i =1, ... , m , and output r, r =1, ... , s, multipliers; xij and yrj are DMU j, j =1, ... , n inputs i and outputs r; xi0 and yr0 are DMU 0 inputs i and outputs r.
For the data processing, we used the Frontier Analyst® software. After we analyzed data, determining the efficient firms.
Discussion of results
This section discusses results of efficiency through DEA. First, is discussed efficiency scores and after that benchmarking units and possible improvements.
Efficiency Scores
The study includes the analysis of technical efficiency on 18 electrical energy distributors. The DEA methodology considers only the efficient units that reached a 100% score. The companies were grouped in three clusters: Cluster A, companies with 100% score; Cluster B, companies with a score from 80% to 99.9%; Cluster C, companies scored below 80%. Seven companies have achieved the efficient frontier: BANDEIRANTE, COELBA, COSERN, CPFL-Piratininga, CPFL-Paulista, ENERSUL and RGE. The other companies were considered inefficient, and the score ranges from 53.4% to 96.3%. Table 2 shows the scores of the units analyzed.
The seven companies considered efficient are spread across Brazil, where 50% of them are located in the Southeast region, and the remaining in the Midwest, Northeast and South. We observed the companies that reached a score below 80%, presenting the highest concentration between 71 and 80%, are located mostly in the Northeast region.
We verified the most efficient companies are located in more developed regions. For this, we have the following null hypothesis (H0): there is no relationship between being efficient and being in a developed region, and the alternative hypothesis (H1): there is a relationship between being efficient and being in a developed region.
Using a simple regression analysis, in which the dependent variable is the efficiency score and the independent variable is the Municipal Human Development Index (IDHM), at a significance level of 5%, we found a p-value 0.52, indicating, with a 95% probability, there is no relationship between efficiency and the development of the region.
We also verified that the high population density might contribute to the efficiency of enterprises. We used as null hypothesis (H0): There is no relationship between being efficient and service more consumers, and an alternative hypothesis (H1): there is a relationship between being efficient and serve more consumers. Using simple regression analysis, in which the dependent variable is the efficiency score and the independent variable is the population density, at a significance level of 5%, we found a p-value of 0.58, indicating, with the probability 95% that there is not relationship between efficiency and the care of a greater number of customers per area. In Çelen (2013) research, the author found that customer density affect the efficiencies positively.
The results of the tests indicated that the IDHM and the population density were not relevant for determining the efficiency of the companies and hence are not explaining factors to account for the efficiency of companies.
Table 2 presents the data from IDHM, population density, concession area and extent of the network used in the regression tests.

Adopting the simple regression analysis, at a significance level of 5%, in which the dependent variable is the efficiency score, and the independent variable is the extent of the network, where the null hypothesis (H0): there is no relationship between company efficiency and the size of the network extension, and as an alternative hypothesis (H1): there is a relationship between the efficiency of the company and the extent size of the network, the p-value was 0.549. This value indicates that the size of the network extension is not related to the efficiency of the units analyzed.
We verified whether there is a relationship between the efficiency of the units analyzed and area serviced by the distribution company. The dependent variable is the efficiency score and the independent variable is the concession area. When assuming the null hypothesis (H0): There is no relationship between the efficiency of the company and the concession area of the distributor and the alternative hypothesis (H1): There is relationship between the efficiency of the company and the concession area of the distributor, at a level of significance of 5%, we found a p-value of 0.06, indicating, with a 95% probability that there is no relationship between efficiency and the area served by the distribution company.
The results of the tests indicated that the region where the company is located, the population density, the size of the concession area, and the extent of the network were not relevant for determining the efficiency of the companies, and hence are not determinant factors to account for the efficiency of companies.
On the study of Sampaio, Ramos and Sampaio (2005), from the 71 hydroelectric power plants analyzed, the public sector companies were more efficient than the companies in the private sector were. This research cannot infer that public companies are inefficient because there is only one company in the population and is not statistically significant to be considered inefficient because is a public company.
All, out of the seven efficient companies have received the ABRADEE Award, and the BANDEIRANTE, ENERSUL, CPFL-Paulista and RGE companies received the award in 2012, COSERN in 2011, CPFL-Piratininga in 2010 and COELBA in 2009. Regarding the other companies, the ones that received the award were ELETROPAULO in 2012, CEMAR in 2011, AES Sul in 2011 and 2013, and COELCE and ELEKTRO in 2012.
Anjos, Bordin and Mello (2010) analyzed the efficiency of the energy distribution from the Southeast, based on 2009 data, and the companies CPFL-Paulista, CPFL-Piratininga and BANDEIRANTE achieved a score of 99%, 92% and 95%, respectively. These results were very close to the results of this research, where these companies have achieved 100% efficiency.

Over the variables that most contributed to the achievement of efficiency, in cluster C, the variables that most contributed to the efficiency are Total Assets and Net Revenue, except CEMAT where the Total Employees and EBITDA Consumer Units are the variables that contributed, as can be seen in Table 3.
In efficient companies, there is a greater variety of combinations to achieve the efficient frontier. In CPFL-Piratininga we could see the Total Net Revenue and variables; in BANDEIRANTE and COSERN were Total Assets and Net Revenue; RGE were the Fixed Assets and EBITDA/Consumer Units; CPFL Paulista were Fixed Assets and Revenues.
The least efficient unit was CEMAT, which obtained a score of 53.4%. In 2012, CEMAT struggled initially for bankruptcy reorganization announced in February 2012 and subsequently, the controlling interest passed in to Equatorial Energia, in November of the same year. The company closed the year with a loss of nearly R$ 700 million and EBITDA loss of about R$ 400 million (Cemat, 2013).
CEEE-D, another company regarded as inefficient with the score of 64.7%, ended the year 2012 with a loss of R$ 308.7 million, representing an increase of 52.14% compared to a net loss in 2011 which was R$ 202.9 million. This negative effect was mainly due to the impact of the MP-579, and the third Cycle of Periodical Tariff Review in which the B installment was reduced by approximately R$200 million. The increase in taxes in recognition of deferred tax liabilities in the amount of R$ 47 million and the rising cost of energy purchased in the amount of R$ 325 million, from 1.17 billion in 2011 to 1.49 billion in 2012 also contributed to the negative outcome (Ceee-D, 2013).
ELEKTRO ended the year 2012 with a slight increase compared to 2011. The net operating revenues increased by only 0.2% compared to 2011; EBITDA has decreased by 25.9% compared to 2011 and the net income decreased 27.5% compared to the same period a year earlier. The company justifies these values because of the reduction of tariffs from August 2012 along with the tariff review, resulting in an average effect of -3% perceived by consumers and reduction of 11.7% in the consumption of captive customers in the industrial class (Elektro, 2013).
CEMAT obtained a score of 78.6%. In 2012 it ended the year with a loss of R$ 52.9 million and a decrease of 53.2% in EBITDA, from R$ 538.7 million in 2011 to R$ 252 million in 2012. According to the company, the main factors that affected operating results are: a) changes in costs related to the amount paid by the energy represented an increase of 33.3% compared to 2011. This increase was mainly due to low reservoir levels of hydropower and the increase in the volume of electricity purchases in the Chamber of the Electrical Energy Trading environment plants. The increase in power purchase happened as a result of failure to comply with power delivery by some distributors in auction, whether because of the delay in construction of the plants, or by the cancelation of the grant by ANEEL; b) growth in the volume of electricity purchased for resale, as a result of market expansion in the provision of electricity (Cemat, 2013).
Besides these factors, since August 31, 2012, ANEEL approved the intervention in CEMAT for one year. This intervention was extended for two more years, because of the indefinition about the future and the of company stock changes. The main objectives were to measure the public interest, the preservation of adequate service to consumers and business management of the concessionaires.
Due to the intervention, CEMAT was prevented from applying rate adjustments between April 8 and August 31, 2012, which meant the loss of income of $ 58 million. In 2009, CEMAT was fined in R$ 346,514.87 by the high cost and the lack of electricity. ENERSUL, despite having been considered efficient, also experienced financial problems in 2012. ANEEL approved intervention in CEMAT and ENERSUL, both part of the Grupo Rede Energia since August 2012.
AMPLA recorded an increase of 15.8% in EBITDA compared to 2011, and an increase of 10.4% in gross revenue. The increase in consumer units was 2.6% compared to that recorded in 2011, reflecting the increase of consumers in the residential class (Endesa, 2013).
COELCE ended the year 2012 with an increase of 9% on gross revenue, mainly due to the increase in low-income subsidy, which increased 36% compared to 2011 and the growth of electricity sales to captive customers (Endesa, 2013).
Among the inefficient companies, three of them - CELPA, CEEE-D and CEMAT - experienced financial problems, closing the year 2012 with a loss and breaches within the limits established for the Average Interruption Duration per Consumer Unit (DEC). This index equals the number of hours that a number of consumer units remains without power.
In the study of Saurin, Miranda and Costa Junior (2010), 29 power companies were analyzed, and based on 2008 data, and CELPA was placed 27th, CEMAT 25th, AMPLA 22th, and COELCE 19th. Except for CELPA, which obtained a score of 85%, other companies had a score below 80%, and were considered inefficient. These results corroborate the scores obtained in this study, although the data are not from the same year.
Benchmarks and Improvements
DEA methodology enables you to find solutions of efficiency for the least efficient DMU, called benchmarks. Based on Figure 3, it appears that BANDEIRANTE is benchmark for the greatest number of companies: AES Sul, AMPLA, CEEE-D, CELPA, COELCE, ELEKTRO, ELETROPAULO, ESCELSA and LIGHT. BANDEIRANTE was featured in the National Quality Award (PNQ) in the biennium 2011/2012 and received the Prize ABRADEE in the category Evolution Performance. Still in 2012, it held a split of its common shares, with the purpose of joining BOVESPA, the main indicator of securities in Latin America.
Fig. 3 Benchmark companies of inefficient units
| BANDEI-RANTE | COELBA | COSERN | CPFL-Paulista | CPFL-Piratininga | RGE | |
| AES Sul | X | X | X | |||
| AMPLA | X | X | ||||
| CEEE-D | X | X | X | |||
| CELPA | X | X | X | |||
| CEMAR | X | X | X | |||
| CEMAT | X | |||||
| COELCE | X | |||||
| ELEKTRO | X | X | X | |||
| ELETROPAULO | X | |||||
| ENERSUL | ||||||
| ESCELSA | X | X | ||||
| LIGHT | X |
Source: Authors
Table 4 shows potential for improvement for every company and every input and output in percentages. Companies should reduce the costs of inputs on average 15% of total assets; 57% of fixed assets, and 24% on the number of employees. As for the outputs, it is desirable to increase the amounts of net revenue by an average of 31%; EBITDA / Consumer Units average 140% and 71.122% for earnings. It is emphasized that the result for the period is the variable that has the highest standard deviation, being 129.019%. By presenting a high standard deviation in relation to other variables, you can explain the distribution of scores. Companies that have the lowest efficiency scores are those with the lowest values on this variable. In other words, they should attempt to raise outcome to become efficient. The Frontier Analyst® software estimated optimal values for each variable and company, so that they reach the efficient frontier. This does not mean that the optimal value can be achieved. Because the concessions from distributors impose limits to their performance, both in terms of areas and consumers, and in terms of rates, the capacity to amend these results is limited.

Among the variables that have excelled in promoting energy efficiency are the Total Assets and Net Revenue. In addition, the variables that need attention for stimulating results optimization are EBITDA / Consumer Units and the Profit for the Period.
Finally, the results did not allow identifying factors leading to efficient frontier. We cannot state that the more developed regions are inclined to a high level of efficiency; even companies that serve to a larger number of customers in a smaller concession area are associated with efficiency improvement.
Final considerations
This study determined the relative technical efficiency of 18 Brazilian Electricity Distribution Companies through a non-parametric technique called Data Envelopment Analysis. With the Frontier Analyst ® software, we processed data, selecting the CCR/ CRS model with product orientation. Thus, based on previous studies, we selected the variables Inputs: total assets, fixed assets, total employees; Outputs: EBITDA per customer, net income and outcome of the period.
Out of the 18 companies analyzed, seven were efficient: BANDEIRANTE, COELBA, COSERN, CPFL-Paulista, CPFL-Piratininga, ENERSUL and RGE, meaning 38.8% of the sample, with half of the companies located in the southeastern region.
It appears that the IDHM, the size of the concession area of the distributor and the extent of the network, as well as population density, are not explanatory for business efficiency factors. All efficient firms have already received the Award ABRADEE, differently from the inefficient, of which only two companies received.
The variables that most contributed to the achievement of efficiency were the Total Assets and Net Revenue. Nevertheless, one should pay attention to efficient firms where other combinations of variables lead to score 100%. Among the main points that should be improved is the increase in income for the period and the reduction of fixed assets. BANDEIRANTE is benchmark for the highest number of companies, including AES Sul, AMPLA, CEEE-D, CELPA, COELCE, ELEKTRO, ELETROPAULO, ESCELSA e LIGHT.
The study confirms the results of Anjos, Bordin e Mello (2010) and Saurin, Miranda e Costa Júnior (2010), in which the efficiency scores were close. Among the inefficient companies, it is noticed that most of them went through financial problems and interventions by the regulatory agency.
Distribution companies are going through the third cycle of Periodical Tariff Review, a fact that will contribute to reducing the value of the bill to the extent that this review takes place. Whereas the electricity rates are pre-set and that the Federal Government by Laws No. 10 848 and No. 12 783, issued a set of rules aimed at the renewal of concessions of generation, transmission and distribution services, companies must find ways to remain efficient. Therefore, they can ensure the technical and financial return of their activities. This set foresees the reduction of charges on the electricity that benefit both industrial consumers and residential.
The theoretical contribution is made towards expanding national studies, as there is lack of research on the national level related to electricity distributors. Studies were identified: Anjos, Bordin and Mello (2010); Souza, Souza and Pessanha (2010); Mello, Climaco and Meza (2009). Other existing studies relate to other segments of the power sector. Moreover, unlike the study of Kassai (2002), where the author studied the distribution, generation and transmission, grouped in accordance with the enterprise size; Souza, Souza and Pessanha (2010) who studied electricity distributors, but clustered in the neural networks; Mello, Climaco and Meza (2009) where the distributors used as an example to analyze the possibility of using the DEA when the number of DMUs is not recommended. The focus of this research was to analyze the distribution electricity companies proposing a new mix of variables for the classification of the scores.
This study is expected to contribute to the academic literature on the Brazilian electricity distributors and will also provide useful information to regulators, members and other stakeholders of the market.
As a proposal to further studies, we suggest the continuation of this study, verifying the possibility to compare them with other countries. In addition, you can analyze historical data series in order to identify foreign factors that are directly or indirectly related to the scores obtained. Annual data can be analyzed in bimonthly or quarterly series, once Cook and Zhu (2015) states that is possible to disaggregate data. It also indicates the use of other techniques, which we can employ together, or individually in order to confirm the scores. We suggest the evaluation of the economic efficiency of the electricity distribution companies, thereby verifying that the economically performing companies are also technically efficient.
This research should be treated with reservation because the data envelopment analysis provides results related to the companies analyzed and the variables used, and cannot be compared with other sectors. Furthermore, the DEA analyzes the relative and not absolute efficiency, therefore cannot be a parameter for the highest efficiency.

