


Servicios Personalizados
Revista
Articulo
 texto en
  Inglés (pdf)
 Artículo en XML
 Referencias del artículo
 Enviar artículo por email
Indicadores
-
 Citado por SciELO
 -
 Accesos
Links relacionados
-
 Similares en
SciELO
Similares en
SciELO
Compartir

 Permalink
Contaduría y administración
versión impresa ISSN 0186-1042
Contad. Adm vol.63 no.1 Ciudad de México ene./mar. 2018
https://doi.org/10.22201/fca.24488410e.2018.1148
Articles
Classification trees as a tool to predict financial difficulties in Latin American companies through their accounting ratios
1Universidad Nacional de Córdoba, Argentina
The analysis of the accounting information of companies is relevant to detect situations of financial vulnerability. Although this information is usually available to those companies that trade in different stock markets, there is generally no explicit characterization that refers to its financial situation (i.e., in crisis or healthy). In this context, the objective of this work is to analyze the incidence of certain accounting ratios on the financial situation of companies from different Latin American markets: Chile, Peru and Argentina, based on the accounting statements that correspond to the 2001-2011 period. To detect the main accounting ratios that influence companies in crisis, recursive methods were applied: Classification Trees. In this manner, the aim is to have tools that allow predicting the financial status of companies. Profitability proved to be a determining factor in all markets, with a strong incidence in the classification of companies. It was subsequently excluded (to analyze the impact of other ratios) due to the fact that the variables with the biggest impact were different between countries. In the case of Argentina, the size of the company, the working capital, and the asset turnover were the most important predicting variables; in the case of Chile it was the flow of operating funds; and in the case of Peru it was liquidity, followed by asset turnover.
Keywords: classification trees; accounting ratios; financial crisis; Latin American companies
JEL classification: G32; G33; C38
El análisis de la información contable de las empresas resulta relevante para la detección de situaciones de vulnerabilidad financiera. Si bien esta información suele estar disponible para aquellas empresas que cotizan en diferentes mercados bursátiles, generalmente no se cuenta con una caracterización explícita referida a su situación financiera (i.e. en crisis o sanas). En este contexto, el objetivo de este trabajo es analizar la incidencia de determinadas razones contables sobre la situación financiera de empresas de distintos mercados latinoamericanos: Chile, Perú y Argentina, en base a los estados contables correspondientes al período 2001-2011. A fin de detectar que las razones contables influyen primordialmente en las empresas en crisis, se aplicaron métodos recursivos: Árboles de Clasificación. De esta manera, se propicia contar con herramientas que permitan predecir el estado financiero de las empresas. En todos los mercados la rentabilidad resultó determinante con una fuerte incidencia en la clasificación de las empresas. Posteriormente, a efectos de analizar el impacto de otras razones, se la excluyó siendo las variables de mayor impacto disímiles entre los países. En el caso de Argentina, el tamaño de la empresa, el capital de trabajo y la rotación del activo resultaron las variables predictoras más importantes; en el caso de Chile fue el flujo de fondos operativos; y en el de Perú, la liquidez seguida por la rotación del activo.
Palabras clave: árboles de clasificación; razones contables; crisis financiera; empresas latinoamericanas
Clasificación JEL: G32; G33; C38
Introduction
The prediction of insolvency is one of the main topics of financial analysis, arousing the interest of not only academia, but also of a broad spectrum of users associated with the business world. Since the 1960s (Beaver, 1966, 1968; Altman, 1968), different methodologies both univariate and multivariate (discriminant, logit, probit, etc.) have been applied. In these, the accounting ratios work as explicative variables, obtaining very satisfactory results.
Altman (1993) used classification (decision) trees for the prediction of business crises in developed economies. In this line of thought, this work expands this study to companies that trade their shares in the Latin American stock markets through an insolvency prediction model. The aim is to detect the main accounting ratios that influence companies in crisis. In this manner, the relation between the state of crisis of a company, defined as the state of financial vulnerability caused by important losses that absorb the capital or the net worth of the company, or by having to start preventive bankruptcy or bankruptcy proceedings, and the behavior of certain accounting ratios is studied. This work is a starting point for companies, financial entities, investors-among others-to predict the state of financial vulnerability of the companies through the behavior of some accounting indicators, all the while being a motivator to continue research in this particular area of interest.
The determination of cut-off points through the implementation of the decision trees technique could be considered as an intermediate step towards the application of models for longitudinal data, the first precedents of which in relation to their implementation in Latin American countries can be found in Caro, Díaz, et al. (2013) and Caro and Díaz (2015). In this manner, these cut-off points allow analyzing the accounting states of the companies, and making decisions according to the value assumed by the same in each fiscal year.
Consequently, this work contributes to the construction of prediction models that would allow a first approximation to determine the financial ratios that are significant in the classification of companies. It also establishes a rule that determines the thresholds that will indicate whether a new company is in a crisis situation or not.
This work has been structured in the following manner: we begin with an introduction in which the objectives and motivation are presented with a brief reference of the first precedents in the literature. Subsequently, the selected samples and the measured variables are explain, followed by the implementation of classification techniques that will make it possible for us to evaluate whether the accounting information is relevant for the detection of financial vulnerability situations. Finally, we present the results obtained, as well as the conclusions and general considerations on the developed work.
Precedents
The research problem addressed in this work is contextualized in the utility theory of accounting information for decision making. The change in approach generated through what was called the "accounting revolution" (Beaver, 1981) changes the perspective of the financial measurement of profit to an "informative" approach. Among the main aspects established by Beaver (1981), the fact that accounting has suffered significant changes since the 1960s stands out, with these changes being reflected on more financial requests being made by regulatory bodies to the companies. This caused an increase in the amount of financial data needed by the users, and the subsequent change in accounting statements. The purpose of financial statements today is to provide the owners of the capital with information so that they can predict benefits (future flow of funds) and analyze the efficiency and efficacy of the overall performance.
The existing close relationship between the economic and financial indicators created from the accounting statements of the companies and their future situation justify their consideration in the study for the prediction of risk for a financial crisis. Companies with financial difficulties, though defined with different terms such as: companies in crisis, insolvent, bankrupt, unsuccessful, at a disadvantage, failed, among others, are those that present symptoms of financial vulnerability and which are in a position contradictory to the concept of healthy companies or companies without these difficulties.
The prediction problem for the state of financial crisis, which is present in all economies of the world, was initially brought up at the beginning of the 1930s, when the investigations on the financial situation of the companies were focused on the ratio trend. This period was characterized by the use of univariate descriptive methods, analyzing the behavior of each ratio individually and inquiring on the differences observed between groups of companies with financial problems and healthy companies (Fitzpatrick, 1932; Winakor and Smith, 1935; Merwin, 1942).
A predictive stage was developed since 1960s, wherein the statistical significance of each index among the groups of companies was analyzed, along with the capacity that they have to be able to predict the bankruptcy of a company. Beaver (1966, 1968) and Altman (1968) began with the development of models with these characteristics in developed economies, which then started being adapted and extended to emerging economies. Altman (1968) resorted to the implementation of multivariate statistical tools, such as the discriminant function analysis, to classify companies according to their risk of bankruptcy, where the methodology used was based on a paired design of non-random samples and the application of linear and square discriminant analyses. For their part, it was in the 1980s that the first objections to the non-randomized design emerged (Ohlson, 1980; Zmijewski, 1984), along with the logistic regression or probit model (Jones, 1987; Maddala, 1991; Ohlson, 1980).
One of the of the criticisms attributed to the models by Altman (1968, 1993) is that its application is not convenient for emerging economies without the corresponding adaptation, as they are models created with the information of the financial statements of companies in developed countries. It has been proven that the error rates are high (Sandin and Porporato, 2007) and that the right approach is to create models with the data of the domestic companies of each country, considering the information in the time available for each one of them.
Another disadvantage of using transversal cut models (discriminant analysis, logistic regression, among others) is of the methodological kind, that is, the verification of certain assumptions for the obtained results to be reliable.
Concerning the application of decision tree techniques, the works by Altman (1993), Frydman, Altman and Kao (1985) and Bonsón Ponte, Escobar Rodríguez and Martín Zamora (1997) stand out. The results indicate that these techniques achieve a greater degree of accuracy than the traditional techniques when classifying companies into solvent and insolvent, with a greater explanatory capacity (Bonsón Ponte et al., 1997). All these methods work with transversal cut data, that is, with an annual balance per company, making it possible to replicate them one, two, three or more years before the manifestation of insolvency.
Additionally, there are other statistical methods applied to this topic that work with longitudinal data, that is, data that are correlated over time, taking the information derived from annual accounting reports into consideration. In this sense, Jones and Hensher (2004, 2007) applied mixed models to Australian companies, concluding that the explanatory indicators of crisis situations are those that collect information on cash or liquidity, flow of funds from operations, working capital, profitability, volume of business, indebtedness and repayment capacity of the debt service. Caro, Díaz, et al. (2013) used mixed models for the prediction of crises in Argentinian companies in the 1990s and then Caro and Díaz (2015) did it with companies in the 2000s.
Altman et al. (1977) were pioneers in adapting their transversal cut models to be able to apply them to emerging economies. Consequently, new research works have emerged in Latin America (Altman et al., 1979; Pascale, 1988; Swanson and Tybout, 1988; Romani Chocce et al., 2002; Sandin and Porporato, 2007; Zurita, 2008; Mongrut Montalván et al., 2011) with the objective of studying the behavior of accounting indicators to predict the risk of insolvency.
It can be said that the statistical models respond satisfactorily to the need to anticipate situations of financial vulnerability. While supervised classification models were applied at first for transversal cut data (considering in the analysis one, two or three years before the manifestation of crisis, according to the different researches), presently, it is considered more appropriate to use those models that contemplate the history of the companies for the explanation and prediction of financial crises.
An important step forward in the application of methodologies in different areas of economic sciences has been observed in the last few years. De Llano Monelos, et al. (2014) have developed models to diagnose and predict business failure based on financial variables, applying three analysis methodologies: discriminant, logit, and multivariate linear. Mathematical programming DEA (Data envelopment analysis) was also used as basis for the determination of failure, a methodology that provided significant factors regarding its implementation for the prediction of business failure. However, these techniques have the disadvantage that they are based on more or less restrictive hypotheses regarding the distribution properties of the explicative variables which, in the particular case of accounting information, are not usually complied. In an attempt to overcome this limitation, techniques from the field of Artificial Intelligence are being used due to their non-parametric nature, as they also do not require pre-established hypotheses on the starting variables. Within these techniques, the ones most used in the analysis of business solvency are the neural network systems, rough sets, genetic algorithms or the rule induction systems and decision trees.
Sample and data
This work contributes, in general terms, to the promotion of research in the accounting and administration area and, in particular, to the research aimed at the crisis prediction models through the use of advanced statistical models which not only allow detecting future situations of financial vulnerability, but that also promote the adoption of appropriate courses of action to prevent said situations in the scenario of Latin American countries.
The main objective of the prediction models, particularly in emerging economies, is the timely detection of companies that could fail in the future. Their practical use is only of interest when said models are able to differentiate the companies that do not fail from those that do.
The target population is comprised by Argentinian, Chilean, and Peruvian companies that listed their shares in the 2001-2011 period in the corresponding Stock Markets:
Buenos Aires Stock Exchange (BCBA for its acronym in Spanish), founded on July 10th, 1854, is the most important Stock Market in Argentina, recognized as the financial center of the country. Its main transactions concentrate on corporate shares, bonds, foreign currency and futures. It is a non-profit civil association directed by representatives from the different business sectors, regulated by Law No. 17.811 and supervised by the National Securities Commission. The particularity of Argentina’s stock market system is that the Stock Exchange and Stock Market are two different institutions, each one with specific roles and functions, unlike much of stock systems in the world, which have one sole institution called the Stock Exchange. The companies that wish to list their shares in the Buenos Aires Stock Exchange must give quarterly reports of their financial statements and provide all relevant information.
Santiago Stock Exchange (BCS for its acronym in Spanish), founded on November 27th, 1893, is the main stock exchange center of Chile. Its transactions are shares, bonds, and foreign currency. The Stock Exchange is a founding member of the Ibero-American Federation of Stock Exchanges (FIAB for its acronym in Spanish) since 1973. Concerning indicators, we can mention the Shares General Price Index (IGPA for its acronym in Spanish), created in 1958 and comprised by the majority of shares and annual reports; and the Selective Price Index (IPSA for its acronym in Spanish), which corresponds to the 40 most transacted shares.
Lima Stock Exchange (BVL for its acronym in Spanish) re-emerged with the name of Lima Stock Market in 1898. The stock market is regulated by the Securities Market Law, Legislative Decree No. 861 and the regulatory body is the Securities Superintendence (SMV for its acronym in Spanish), a specialized technical body whose purpose is to ensure the protection of investors, the efficiency and transparency of the markets under its supervision, the correct formation of prices, and the dissemination of all necessary information for said purposes. The Lima Stock Exchange (BVL) is the only authorized entity with the ability to work in the country and has the goal of facilitating the negotiations of registered shares.
One of the reasons why other Latin American countries were not considered is that some of them do not have a Stock Exchange (Uruguay), or do not provide the datum of financial vulnerability (Colombia and Brazil).
The temporary scope of this research comprises the 2001-2011 period, in accordance with the availability of data that are not distorted by economic instability situations. After this period, these countries began implementing the New International Accounting Standards that establish some different criteria regarding the valuation and exposure of information. Therefore, it is not convenient to use accounting reports from periods after the implementation of said standards, as their results would not be comparable.
Within the total number of companies in each stock exchange, those companies that have listed in a reduced manner during the period of analysis were identified as companies in crisis, as well as those whose shares have been cancelled, as informed through the Stock news, due to having entered a period of cessation in payments, by having declared bankruptcy or through the amount of losses obtained that absorb a portion of their capital or net worth. The sample (Table 1) is comprised by the financial statements of the companies in crisis along with those of a number of selected healthy companies, understood as those companies that do not manifest these signs of vulnerability, available for each one of the markets in the considered period. Particularly, the financial statement of the year prior to the detection of their financial vulnerability was taken for the companies in crisis, whereas the statement of the last available period was taken into consideration for healthy companies. All banks, financial and insurance companies were excluded as they possess a specific regulation and their analysis would not be comparable with the others (Altman, 1968).
Table 1 Number of companies by market
| State | Chile | Peru | Argentina |
| Healthy | 158 | 37 | 44 |
| In crisis | 33 | 13 | 13 |
| Total | 191 | 50 | 57 |
Source: Own elaboration
Since the amount of companies that list in the Latin American Stock Market is not great, an analysis by sector was not possible given that some of them were not represented and others had very few companies. For this reason, the companies were divided by type of activity (industrial, commercial and services), which was not statistically significant and was therefore not considered in this investigation.
The dependent variable is the state of the company, with financial difficulties (crisis) and without them (healthy). For their part, the predictive variables are defined by accounting ratios, which are indicators used in previous studies, built from the information of the financial statements presented by the companies. More recent studies have included ratios that have not been previously taken into consideration, such as the flow of operational funds, which is important to include in this work.
The indicators considered in this work are the ones utilized by Caro, Díaz, et al. (2013) based on Altman (1968) and Jones and Hensher (2004), being the most utilized ratios and which have been validated in several applications in different markets:
Flow of Funds Ratio (FF_AT): measures the position of cash originated by the operations with regard to the total shares.
Liquidity Ratio (E_AT): measures the proportion of the more liquid resources of the company (availabilities and investments that can be cashed within 24 hours) over the total assets.
Asset Turnover Ratio (V_AT): is the coefficient that measures the relation between sales and total assets.
Indebtedness Ratio (D_PN): measures the relation of the debts (third party capital) over the capital provided by the owners of the company.
Working Capital Ratio (CT_AT): expresses the degree of fluidity of the assets and indicates the measure of immobilization of the total assets neutralized by the working capital.
Economic Profitability Ratio (GE_AT): measures the profitability with regard to the profit of exploitation.
Size of the Company (LNA): measured as the natural logarithm of the total assets.
Method
Altman (1993) was one of the pioneers in the use of classic (such as the discriminant analysis) and non-classic methodologies (such as the neural networks and classification and/or decision trees) in developed economies.
This work uses a methodology based on the induction algorithm of rules called CHAID (Chi-squared Automatic Interaction Detector), which was developed by (Kass, 1980; Breiman et al., 1984). This statistical segmentation technique generates a tree of rules that specify the different segments in which the sample is divided in relation to the dependent variable, allowing the classification of the companies according to the different values presented by their accounting ratios.
Although there are several algorithms capable of generating rules based on classification trees, the choice of the CHAID is due to both its wide dissemination and important benefits.
First, it is not based on any probability distribution, using only the Chi-square goodness of fit test (derived from the contingency tables) which, with an acceptable sample size, almost always produces good results. Second, it also allows determining a variable to maximize, which is desirable and is not always possible with other segmentation techniques. Third, the classification through segments is relatively easy to analyze, as it contributes with rules that are intuitive and easy to interpret by non-expert users, something that does not always happen when working with other methodologies. Fourth, the technique ensures that the segments always have a statistical meaning, that is, that they are all different and the best possible based on the sample data. Consequently, the classifications done with the rules found are mutually exclusive, and therefore the decision tree provides one sole response based on the calculation of the probabilities to belong to a certain class. Finally, CHAID is a non-binary algorithm, that is, it is able to build more than two divisions of the data according to the categories to explain on each node.
The CHAID algorithm comprises several steps from its application to the obtainment of the rules (Breiman et al., 1984):
Division of the continuous explicative variables: These variables are discretized and divided into a set of categories.
Merging of categories of the explicative variables: This algorithm merges those values of the explicative variables that are statistically homogenous with regard to the dependent variable, and keeps the heterogeneous ones separated. Each final category obtained from an explicative variable X represents a child node if the variable is then utilized to divide the tree. For each explicative variable X, the algorithm finds the couple of X categories with the least significant difference with regard to the dependent variable Y, that is, with the most p-value, which is obtained through the Chi-square test.
Division of nodes: Each variable is evaluated regarding its association with the dependent variable according to the p-value obtained with the statistical test, so that the algorithm selects the best predictor to create the first division of the tree, that is, the explicative variable with the greater association with the dependent variable (the one whose Chi-square test resulted in the lowest p-value). If this value is lower or equal to the division threshold set by the user, then the variable is used as a division variable for the node, and each of the merged categories of the division variable defines a child node. Once the node in question has been divided, the child nodes are examined to see if they allow more divisions with the application of this merging/division process. This process continues until the tree is set up and no more divisions can be made. The level of confidence of each rule (terminal node) represents the ratio of records of each rule that pertain to the selected j category. Similarly, the level of confidence of a set of rules can be defined as the ratio of cases of each rule that pertain to the given j category.
Index: the index of each of the rules obtained for a j category is obtained as the ratio between the level of confidence of each rule or terminal node and the level of confidence of the j category in the total sample. The profit for each terminal node (t) is defined in absolute terms as the number of cases in the selected j category. For a set of rules or terminal nodes, in relative terms, the profit represents the percentage of cases in the j category, and it is possible to detect where it is equal to 1 if the case has the j category, and 0 otherwise.
Results3
Profitability was a determinant factor with a strong incidence in the classification of the companies in the three markets. Subsequently, in order to analyze the impact of other ratios that were overlooked, it was excluded, obtaining relatively more dissimilar results between countries.
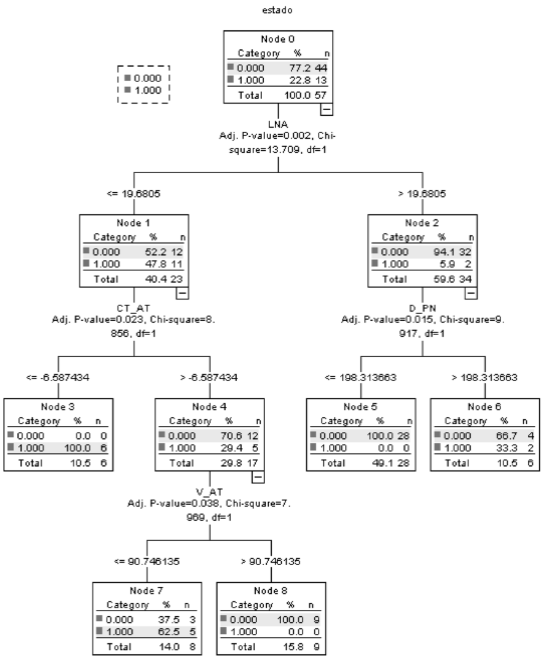
In the case of Argentina, where the most complex tree was obtained concerning the number of branches (Figure 1), size was the main predictive variable for the state of the companies. 94.1% of companies with a big size, with an LNA ratio above 19.68%, are healthy. Additionally, from this group of companies, 100% with an indebtedness ratio (D_PN) inferior to 198.3% are healthy. On the other hand, the companies with a smaller size are equally distributed among the categories, with 47.8% in crisis; although from these, 100% of those that have a working capital ratio (CT_AT) inferior to -6.59% correspond to that category. Regarding the total companies with these characteristics, they have an asset turnover (V_AT) lower than 90.75%
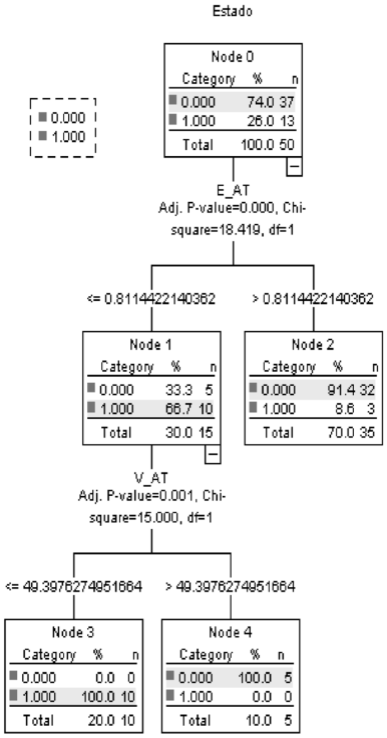
Regarding Peru, liquidity was the most relevant predictive variable (Figure 2): 91.4% of companies with a ratio above 0.81% are healthy, while 66.7% with a ratio under that value are companies in crisis. Additionally, this group of companies with a lower liquidity is completely determined by asset turnover, given that the totality of companies with a ratio lower than 49.4% are in crisis, while those above are healthy.
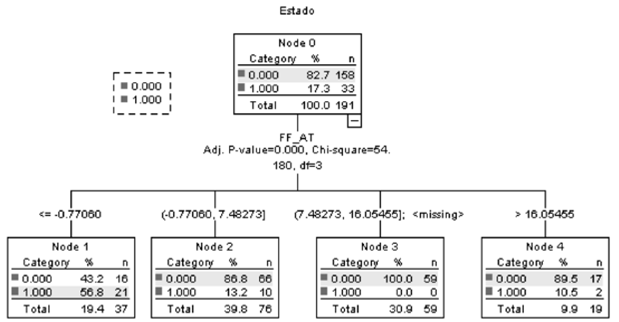
Regarding Chile, the flow of funds was the dominant predictive variable (Figure 3). From the totality of companies in crisis from the sample of this country, 64% have a level of flow of funds (FF_AT) lower than -0.77% (comprising 56.8% of the companies with this characteristic), while 92% of the companies with a ratio above this magnitude are healthy.
Regarding the goodness of the functioning of the model in the different countries, and considering the correct percentage of classification (Table 2), Peru had the best performance both at a general level (94%) and in the specific classification of healthy companies (100%), also achieving 76.9% in the case of companies in crisis. Subsequently, the companies of Argentina were correctly classified at a 91.2% along with a better performance regarding the companies in crisis, with an 84.6% of correct classification. Finally, the global classification rate of the Chilean companies was very good, achieving an 85.3%, although in relation to the companies in crisis the performance was a little lower at 63.6%.
Table 2 Percentages of correct classification by market
| State | Argentina | Chile | Peru |
| Healthy companies (0) | 93.2% | 89.9% | 100% |
| Companies in crisis (1) | 84.6% | 63.6% | 76.9% |
| Global Percentage | 91.2% | 85.3% | 94% |
Source: Own elaboration
The rules obtained identify high or low performance profiles, which would indicate that if one specific company has a certain behavior in its ratios, then it could be in danger of financial crisis. In accordance with the classification trees obtained (Figures 1 to 3) the intervals of the different ratios were calculated, which then served as basis for businesspeople, banks or investors to determine the financial crisis of the company in question (Table 3).
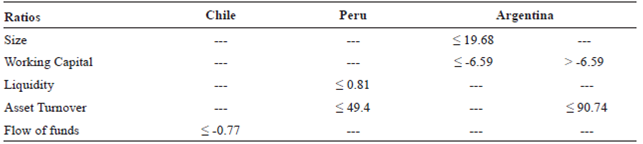
We can note from the above table that a Chilean company has a high probability of presenting financial problems if its ratio referred to the flow of funds assumes a value lower than or equal to -0.77. While in the case of Peruvian companies, the probability of going though crisis processes is greater if their liquidity ratio does not surpass the value of 0.81 and the asset turnover is at most 49.4. Regarding Argentinian companies with a greater probability of financial vulnerability, two types can be identified: companies whose size and working capital ratios have values lower than or equal to 19.68 and -6.59 respectively, and companies with a working capital above said magnitude but with an asset turnover no greater than 90.74.
Conclusions
This research presents the main financial and economic characteristics of the companies that rate in the Latin American Stock Markets. The rules or profiles obtained have helped us identify the companies according to the ratios of their financial statements. However, the main added value of this work is not having empirically confirmed the main variables to be considered in financial planning, but determining the quantitative levels or intervals to be considered as the objective in each of them, propitiating the prevision of financial inconveniences.
Thus, we can conclude that the application of these statistical methods makes it possible to identify companies with financial problems, which is of relevance in the modeling and prediction of this type of risk. In this manner, this work has been able to recommend a rule that allows, with the pertinent ratio values, to predict a state of vulnerability so that each company (catering to their particular circumstances, internal and external) can do their financial planning according to the rules that they consider feasible and sustainable.
Referencias
Altman, E. I. (1968). Financial ratios, discriminant analysis and the prediction of corporate bankruptcy. The Journal of Finance, 23(4), 589-609. https://doi.org/10.2307/2978933 [ Links ]
Altman, E. I. (1993). Corporate Financial Distress and Bankruptcy (J. W. a. Sons Ed. Second ed.). New York. [ Links ]
Altman, E. I., Baidya, T. K. & Dias, L. M. R. (1979). Assessing potential financial problems for firms in Brazil. Journal of International Business Studies, 10(2), 9-24. https://doi.org/10.1057/palgrave.jibs.8490787 [ Links ]
Altman, E. I., Haldeman, R. G. & Narayanan, P. (1977). ZETATM analysis A new model to identify bankruptcy risk of corporations. Journal of Banking & Finance, 1(1), 29-54. https://doi.org/10.1016/0378-4266(77)90017-6 [ Links ]
Beaver, W. H. (1966). Financial ratios as predictors of failure. Journal of Accounting Research, 71-111. https://doi.org/10.2307/2490171 [ Links ]
Beaver, W. H. (1968). Alternative accounting measures as predictors of failure. The Accounting Review, 43(1), 113-122. [ Links ]
Beaver, W. (1981) Financial reporting: an Accounting Revolution Prentice Hall. [ Links ]
Bonsón Ponte, E., Escobar Rodríguez, T. & Martín Zamora, M. (1997). Decision tree induction systems. Applications in Accounting and Finance. Paper presented at the Intelligent Technologies in Accounting and Business. Proceedings of the III International Meeting on Artificial Intelligence in Accounting, Finance and Tax. Huelva. [ Links ]
Breiman, L., Friedman, J., Olshen, R. & Stone, C. (1984). Classification and Regression Trees (Monterey, CA: Wadsworth and Brooks/Cole). [ Links ]
Caro, N. P. & Díaz, M. (2015). Factores determinantes para predecir la crisis financiera en empresas argentinas/Determinants factors in predicting the financial crisis in argentine companies. Cuadernos de Estudios Empresariales, 25, 29. https://doi.org/10.5209/rev_cese.2015.v25.53631 [ Links ]
Caro, N. P., Díaz, M. & Porporato, M. (2013). Predicción de quiebras empresariales en economías emergentes: uso de un modelo logístico mixto. Revista de Métodos Cuantitativos para la Economía y la Empresa, 16, 200-215. Disponible en http://www.redalyc.org/html/2331/233129568008/ Consultado: 26/10/2017 [ Links ]
De Llano Monelos, P., Sánchez, C. P. & López, M. R. (2014). DEA as a business failure prediction tool Application to the case of galician SMEs. Contaduría y Administración, 59(2), 65-96. https://doi.org/10.1016/s0186-1042(14)71255-0 [ Links ]
Fitzpatrick, P. (1932). A Comparison of ratios of successful industrial enterprises with those of failed firms. Certified Public Accountant, 1932. October, November, and December, 598-605. [ Links ]
Frydman, H., Altman, E. I. & Kao, D. L. (1985). Introducing recursive partitioning for financial classification: the case of financial distress. The Journal of Finance, 40(1), 269-291. https://doi.org/10.2307/2328060 [ Links ]
Jones, F. L. (1987). Current techniques in bankruptcy prediction. Journal of Accounting Literature, 6(1), 131-164. [ Links ]
Jones, S. & Hensher, D. A. (2004). Predicting firm financial distress: A mixed logit model. The Accounting Review, 79(4), 1011-1038. https://doi.org/10.2308/accr.2004.79.4.1011 [ Links ]
Jones, S. & Hensher, D. A. (2007). Modelling corporate failure: A multinomial nested logit analysis for unordered outcomes. The British Accounting Review, 39(1), 89-107. https://doi.org/10.1016/j.bar.2006.12.003 [ Links ]
Kass, G. V. (1980). An exploratory technique for investigating large quantities of categorical data. Applied Statistics, 119-127. https://doi.org/10.2307/2986296 [ Links ]
Maddala, G. S. (1991). A perspective on the use of limited-dependent and qualitative variables models in accounting research. The Accounting Review, 66(4), 788-807. [ Links ]
Merwin, C. L. (1942). Financing Small Corporations in Five Manufacturing Industries, 1926-36. [ Links ]
Mongrut Montalván, S. M., O’Shee, D. F., Delgado, F. A. & Yamashiro, M. A. (2011). Determinantes de la insolvencia empresarial en el Perú. Academia (47), 126. Disponible en Disponible en http://www.redalyc.org/html/716/71618917009/ Consultado: 26/10/2017 [ Links ]
Ohlson, J. A. (1980). Financial ratios and the probabilistic prediction of bankruptcy. Journal of Accounting Research, 109-131. https://doi.org/10.2307/2490395 [ Links ]
Pascale, R. (1988). A multivariate model to predict firm financial problems: the case of Uruguay. Studies in Banking and Finance, 7, 171-182. [ Links ]
Romani Chocce, G. A., Aroca González, P., Aguirre Aguirre, N., Leiton Vega, P. & Muñoz Carrazana, J. (2002). Modelos de clasificación y predicción de quiebra de empresas: Una aplicación a empresas chilenas. Paper presented at the Forum Empresarial. Disponible en Disponible en http://www.redalyc.org/html/631/63170102/ Consultado: 26/10/2017 [ Links ]
Sandin, A. R. & Porporato, M. (2008). Corporate bankruptcy prediction models applied to emerging economies: Evidence from Argentina in the years 1991-1998. International Journal of Commerce and Management, 17(4), 295-311. https://doi.org/10.1108/10569210710844372 [ Links ]
Swanson, E. & Tybout, J. (1988). Industrial bankruptcy determinants in Argentina. Studies in Banking and Finance, 7, 1-25. [ Links ]
Winakor, A. & Smith, R. (1935). Changes in financial structure of unsuccessful industrial companies. Bureau of Business Research. Bulletin, 51. [ Links ]
Zmijewski, M. E. (1984). Methodological issues related to the estimation of financial distress prediction models. Journal of Accounting Research, 59-82. https://doi.org/10.2307/2490859 [ Links ]
Zurita, F. (2008). La predicción de la insolvencia de empresas chilenas. Economía Chilena, 11(1), 93-116. [ Links ]
Received: February 14, 2016; Accepted: June 02, 2017
 Este es un artículo publicado en acceso abierto bajo una licencia Creative Commons
